. 2017 Apr 1;23(7):1862-1874.
doi: 10.1158/1078-0432.CCR-16-0620. Epub 2016 Sep 23.

Selective Targeting of Cyclin E1-Amplified High-Grade Serous Ovarian Cancer by Cyclin-Dependent Kinase 2 and AKT Inhibition

Affiliations

Selective Targeting of Cyclin E1-Amplified High-Grade Serous Ovarian Cancer by Cyclin-Dependent Kinase 2 and AKT Inhibition

George Au-Yeung et al. Clin Cancer Res. .

Abstract

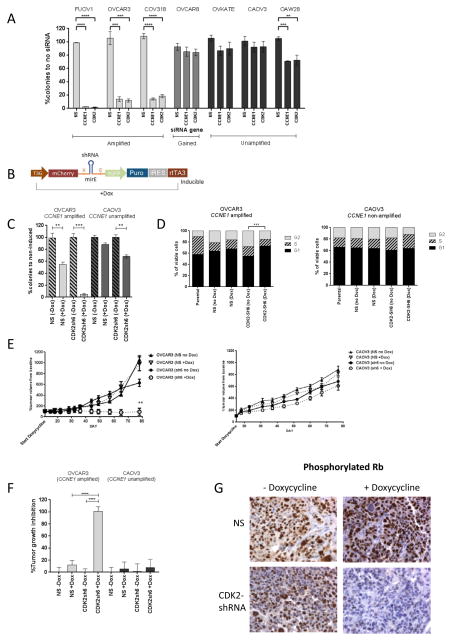
Purpose: Cyclin E1 (CCNE1) amplification is associated with primary treatment resistance and poor outcome in high-grade serous ovarian cancer (HGSC). Here, we explore approaches to target CCNE1-amplified cancers and potential strategies to overcome resistance to targeted agents.Experimental Design: To examine dependency on CDK2 in CCNE1-amplified HGSC, we utilized siRNA and conditional shRNA gene suppression, and chemical inhibition using dinaciclib, a small-molecule CDK2 inhibitor. High-throughput compound screening was used to identify selective synergistic drug combinations, as well as combinations that may overcome drug resistance. An observed relationship between CCNE1 and the AKT pathway was further explored in genomic data from primary tumors, and functional studies in fallopian tube secretory cells.Results: We validate CDK2 as a therapeutic target by demonstrating selective sensitivity to gene suppression. However, we found that dinaciclib did not trigger amplicon-dependent sensitivity in a panel of HGSC cell lines. A high-throughput compound screen identified synergistic combinations in CCNE1-amplified HGSC, including dinaciclib and AKT inhibitors. Analysis of genomic data from TCGA demonstrated coamplification of CCNE1 and AKT2 Overexpression of Cyclin E1 and AKT isoforms, in addition to mutant TP53, imparted malignant characteristics in untransformed fallopian tube secretory cells, the dominant site of origin of HGSC.Conclusions: These findings suggest a specific dependency of CCNE1-amplified tumors for AKT activity, and point to a novel combination of dinaciclib and AKT inhibitors that may selectively target patients with CCNE1-amplified HGSC. Clin Cancer Res; 23(7); 1862-74. ©2016 AACR.


Conflict of interest statement

Disclosure of Potential Conflicts of Interest

D. Rischin reports receiving research funding from Merck. No potential conflicts of interest were disclosed by the other authors.

Figures

Figure 1
Figure 1. CDK2 knockdown via siRNA and shRNA in vitro and in vivo results in selective reduction in clonogenic survival and tumor growth arrest in CCNE1-amplified HGSC
(A) Clonogenic survival after transfection with CCNE1 and CDK2 siRNAs in panel of HGSC cell lines. Average percentage of discrete colonies formed after 7–10 days relative to no siRNA controls shown (n=3). Error bars indicate SEM. Statistical significance (t test) calculated by comparison with non-silencing (NS) siRNA in the same cell line. **, p<0.01, ***, p<0.001, ****, p<0.0001. (B) Schematic of conditional LT3GECIR lentiviral vector showing inducible transcripts produced by vector. (C) Clonogenic survival after induction of a non-specific or CDK2 targeting shRNA in OVCAR3 (CCNE1-amplified) and CAOV3 (CCNE1-unamplified). Average percentage of discrete colonies formed after 7–10 days relative to no induction shown (n=3). Statistical significance (t test) calculated by comparison with non-induced (−Dox) in the same cell line. **, p<0.01, ***, p<0.001. (D) Cell cycle analysis following CDK2 knockdown with inducible shRNA. Proportion of cells in G1, S or G2 phase for PI stained cells analysed by flow cytometry 72 hours after induction with doxycycline. Mean of 3 independently performed experiments shown. Statistical significance (t test) calculated by comparison with non-induced (−Dox) in the same cell line. ***, p<0.001. (E) Mean percentage change in tumor volume ± SEM following induction of a non-specific (NS) or CDK2 (sh6) shRNA in subcutaneous xenograft tumors grown in immunocompromised mice, generated from OVCAR3 and CAOV3. Induced and non-induced groups as marked, n=5 per group. **, p<0.001, unpaired t-test comparison of mean percentage tumor volume change. (F)Percentage tumor growth inhibition following induction of non-specific (NS) or CDK2 (sh6) shRNA with doxycycline. Bars represent mean ± SEM, n=5 mice per group. Statistical analysis performed with analysis of variance (ANOVA) followed by Dunnett’s post hoc test to compare the percentage tumor growth inhibition between the treatment groups. ****, p<0.0001. (G) Immunohistochemistry assessment of phospho-Rb with or without doxycycline treatment in OVCAR3 xenograft tumor.
Figure 2
Figure 2. CDK inhibitor dinaciclib results in modest tumor growth inhibition in vivo but is not synergistic in combination with bortezomib in vitro
(A) Mean IC50 values for a panel of HGSC cell lines treated with dinaciclib generated from dose-response curves following standard MTS cell proliferation assays. Error bars represent SEM, n=3 experiments. (B) In vivo effects of dinaciclib. Immunocompromised mice bearing OVCAR3 (CCNE1-amplified) or CAOV3 (CCNE1-unamplified) tumor xenografts were treated with vehicle or drug as described in methods. Plots represent mean tumor volume change from baseline ± SEM, n=5 mice per group. (C) Percentage tumor growth inhibition following 21 days of treatment with vehicle or dinaciclib. Bars represent mean ± SEM, n=5 mice per group. Statistical analysis performed with analysis of variance (ANOVA) followed by Dunnett’s post hoc test to compare the percentage tumor growth inhibition between the treatment groups. **, p<0.01. (D) Immunohistochemistry analysis of Ki67 expression in OVCAR3 and CAOV3 tumor xenograft harvested 24 hours after dose of vehicle or dinaciclib. (E) Formal assessment of synergy between dinaciclib and bortezomib using Chou-Talalay Isobologram analysis. Figures are generated with CalcuSyn 2.0. Data are normalised, with connecting line at X and Y corresponding to combination index = 1, representing line of additivity. Datapoints above the line are antagonistic, along or near the line are additive and points below the line are synergistic. (F) Combination indexes for a panel of HGSC cell lines tested against dinaciclib in combination with bortezomib. Values represent mean ± SEM, n=3. (G–H) Scatter plots showing EC50 values for library compounds in combination with dinaciclib from primary screen for the comparison between (G) CCNE1-amplified and unamplified; and (H) resistant versus parental. Data points in red represent compoundstaken forward for secondary screen.
Figure 3
Figure 3. Dinaciclib in combination with non-selective BH3 mimetics are synergistic in CDK-inhibitor resistant cell lines
Combination indexes for parental and CDK inhibitor-resistant cell lines tested against dinaciclib in combination with (A) ABT-737, (B) ABT-263, (C) ABT-199. Values represent mean ± SEM, n=3. (D) Western blot demonstrating protein expression of Bcl-XL, Mcl-1 and PARP cleavage products in OVCAR3 parental and CDK inhibitor-resistant cell lines after treatment with dinaciclib and ABT-737. (E) Expression of anti-apoptotic proteins as assessed by quantitative real-time PCR. R-lines signify cell lines resistant to PHA533533. RD-lines signify cell lines resistant to dinaciclib. Bars represent mean ± SEM, n=3.
Figure 4
Figure 4. Dinaciclib in combination with two AKT inhibitors are synergistic in vitro and in vivo models of CCNE1-amplified HGSC
Combination indexes for a panel of HGSC cell lines tested against dinaciclib in combination with (A) MK-2206 and (B) GSK2110183. Values represent mean ± SEM, n=3. (C) HGSC cell lines were cultured in vitro with dinaciclib, MK-2206 or the combination for 24 hours and then analysed using flow cytometry for Annexin V/propidium iodide positivity. Bars represent mean ± SEM, n=3. *, p<0.05; **, p<0.01; ***, p<0.001; unpaired t-test. (D) In vivo effects of vehicle, dinaciclib, MK-2206 or combination. Immunocompromised mice bearing OVCAR3 (CCNE1-amplified) or CAOV3 (CCNE1-unamplified) tumor xenografts were treated with vehicle or drug as described in methods. Plots represent mean tumor volume change from baseline ± SEM, n=5 mice per group. (E) Percentage tumor growth inhibition following 21 days of treatment with vehicle, dinaciclib, MK-2206 or the combination. Bars represent mean ± SEM, n=5 mice per group. Statistical analysis performed with analysis of variance (ANOVA) followed by Dunnett’s post hoc test to compare the percentage tumor growth inhibition between the treatment groups. *,p <0.05; **, p<0.01; ****, p<0.0001. (F) Quantitation of immunohistochemistry staining for Ki67 and cleaved caspase-3. Bars represent mean percentage of Ki67 or cleaved caspase 3 positive cells relative to background number of cells measured ± SEM, n=3 in each group. Statistical analysis performed by analysis of variance (ANOVA) with Tukey’s multiple comparison test to compare between treatment groups. (G) Subcutaneous tumors were obtained after 24hrs of treatment and were examined by immunohistochemistry for biomarker analysis. Rb phosphorylation was inhibited by dinaciclib, but not MK-2206 treatment. AKT phosphorylation was inhibited by MK-2206, but not dinaciclib treatment. Proliferation (Ki67) was inhibited and apoptosis (cleaved caspase-3) was induced by the combination of dinaciclib and MK-2206 in CCNE1-amplified xenograft model (OVCAR3).
Figure 5
Figure 5. CCNE1 and AKT2 are co-amplified in primary HGSC samples
Dot plots of median shRNA abundance for each gene targeted by shRNA in HGSC cell lines, stratified by CCNE1 copy number or expression. Depletion of shRNA abundance within a group suggests requirement for maintained expression of its target gene. Only genes with a statistically significant difference shown, see Supplementary Table S3 for list of genes and cell lines analysed. Statistical significance (t test) calculated by comparison between CCNE1-amplified and unamplified or CCNE1 over-expressing and low expressing cell lines. *, p<0.05, **. p<0.01.
Figure 6
Figure 6. Cyclin E1 and AKT over-expression co-operates to promote uncontrolled growth in fallopian tube secretory epithelial cells
(A) Western Blot analysis of fallopian tube secretory cells transduced with cyclin E1, empty vector and AKT1, AKT2 and AKT3 over-expression constructs. Blots are representative of three independently performed experiments. (B) Proliferation assay of fallopian tube secretory cells (FT282) transduced with empty vector (EV), cyclin E1 (CCNE1), AKT2, and both cyclin E1 and AKT2 (CCNE1+AKT2). Plots represent mean of 3 independently performed experiments, error bars represent SEM. (C) Clonogenic survival assay of FT282 cells transduced as labelled. Images (left) show cells fixed and stained with crystal violet. Bar chart represents mean of 3 independently performed experiments, error bars represent SEM. Statistical significance (t test) calculated by comparison with FT282 cells transduced with cyclin E1 (FT282-CCNE1). (D) Anchorage independent assay of FT282 cells transduced as labelled. Images (left) represent cells fixed with 2% paraformaldehyde and captured using an Olympus IX81 live cell imager. Bar chart represents mean of 3 independently performed experiments, error bars represent SEM. Statistical significance (t test) calculated by comparison with FT282 cells transduced with cyclin E1 (FT282-CCNE1). *, p < 0.05, **, p < 0.01.

References

    1. Martini M, Vecchione L, Siena S, Tejpar S, Bardelli A. Targeted therapies: how personal should we go? Nat Rev Clin Oncol. 2012;9:87–97. - PubMed
    1. Burger RA, Brady MF, Bookman MA, Fleming GF, Monk BJ, Huang H, et al. Incorporation of bevacizumab in the primary treatment of ovarian cancer. N Engl J Med. 2011;365:2473–83. - PubMed
    1. Perren TJ, Swart AM, Pfisterer J, Ledermann JA, Pujade-Lauraine E, Kristensen G, et al. A phase 3 trial of bevacizumab in ovarian cancer. N Engl J Med. 2011;365:2484–96. - PubMed
    1. Fong PC, Boss DS, Yap TA, Tutt A, Wu P, Mergui-Roelvink M, et al. Inhibition of poly(ADP-ribose) polymerase in tumors from BRCA mutation carriers. N Engl J Med. 2009;361:123–34. - PubMed
    1. Ledermann J, Harter P, Gourley C, Friedlander M, Vergote I, Rustin G, et al. Olaparib maintenance therapy in platinum-sensitive relapsed ovarian cancer. N Engl J Med. 2012;366:1382–92. - PubMed

MeSH terms