. 2017 Feb;74(3):555-570.
doi: 10.1007/s00018-016-2357-0. Epub 2016 Sep 23.

Human adenosine deaminases ADA1 and ADA2 bind to different subsets of immune cells

Affiliations

Human adenosine deaminases ADA1 and ADA2 bind to different subsets of immune cells

Yuliia Kaljas et al. Cell Mol Life Sci. 2017 Feb.

Abstract

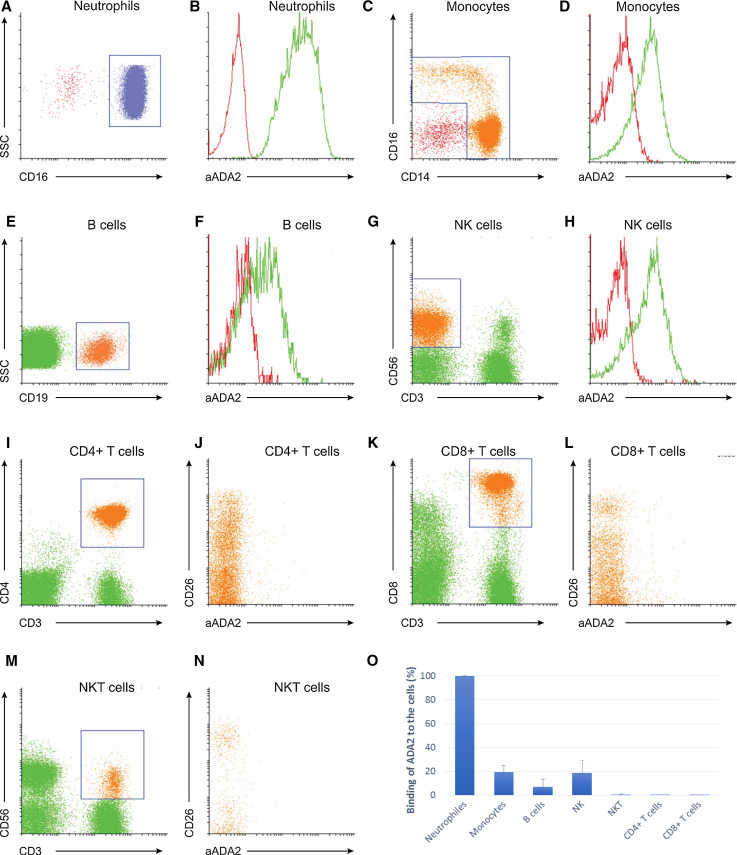
At sites of inflammation and tumor growth, the local concentration of extracellular adenosine rapidly increases and plays a role in controlling the immune responses of nearby cells. Adenosine deaminases ADA1 and ADA2 (ADAs) decrease the level of adenosine by converting it to inosine, which serves as a negative feedback mechanism. Mutations in the genes encoding ADAs lead to impaired immune function, which suggests a crucial role for ADAs in immune system regulation. It is not clear why humans and other mammals possess two enzymes with adenosine deaminase activity. Here, we found that ADA2 binds to neutrophils, monocytes, NK cells and B cells that do not express CD26, a receptor for ADA1. Moreover, the analysis of CD4+ T-cell subset revealed that ADA2 specifically binds to regulatory T cells expressing CD39 and lacking the receptor for ADA1. Also, it was found that ADA1 binds to CD16- monocytes, while CD16+ monocytes preferably bind ADA2. A study of the blood samples from ADA2-deficient patients showed a dramatic reduction in the number of lymphocyte subsets and an increased concentration of TNF-α in plasma. Our results suggest the existence of a new mechanism, where the activation and survival of immune cells is regulated through the activities of ADA2 or ADA1 anchored to the cell surface.

Keywords: Adenosine; Adenosine deaminase 2 deficiency; Adenosine deaminases; Immune cells.


Conflict of interest statement

The authors declare no competing financial interests.

Figures

Fig. 1
Fig. 1
ADA2 binding to blood cells. The binding of ADA2 to neutrophils (a), monocytes (c), B cells (e) and NK cells (g), which was detected by CF633-labeled anti-ADA2 antibodies, is shown on the histograms (b, d, f, h, j, l, n). Red and green lines on the histograms correspond to the cells stained with anti-ADA2 antibodies in the presence or absence of ADA2, respectively. The expression of ADA1 receptor CD26 on CD4+ T cells (i), CD8+ T cells and NKT cells (m) is shown on dot plots j, l and n. o The graph showing the relative binding of ADA2 to different cell subsets from three donors. ADA2 is expressed in geometric mean fluorescein intensities (MFI) and the values are normalized to the MFI of neutrophils (100 %)
Fig. 2
Fig. 2
ADA2 binding to lymphocyte subsets. Dot plots show the binding of ADA2 (c, f, i) to NK (a, b), monocyte (d, e) and CD4+ T-cell subset (g, h) from a healthy donor, which was detected by CF633-labeled anti-ADA2 antibodies. ADA2 binding to cell subsets from three healthy donors is shown in the graph (j). The binding of ADA2 to the cell subsets is expressed in geometric mean fluorescein intensities (MFI), and the values obtained for the healthy donors and ADA2-deficient patients are compared in the table (k)
Fig. 3
Fig. 3
ADA2 binds to FoxP3+ CD39+ regulatory CD4+ T cells that express low levels of ADA1 receptor CD26. a A dot plot showing four T-cell subset determined by the level of CD39 and FoxP3 expression. b Mean fluorescent intensity (MFI) of ADA2–Streptavidin–FITC binding and the level of CD39 and FoxP3 expression in four CD4+ T cell subset shown in A. c A histogram showing the difference in ADA2 binding to CD39+ FoxP3+ and CD39+ FoxP3− subsets of CD4+ T cells. d A dot plot showing four T-cell subset determined by the level of CD26 and FoxP3 expression. e MFI of ADA2–Streptavidin–FITC binding and the level of CD26 and CD39 expression in four CD4+ T-cell subset shown in d
Fig. 4
Fig. 4
ADA1 binding to monocyte subsets lymphocytes expressing CD26. Recombinant biotinylated hADA1 was bound to the cells following staining with Streptavidin PE. The binding of ADA1 to monocyte subsets (a, b) is expressed in geometric mean fluorescein intensities (MFI). c A histogram showing the staining of CD16− monocyte subset (region 3) with Streptavidin PE with ADA1 (blue line) and without ADA1 (red line). d, e Binding of biotinylated hADA1 to lymphocytes in the absence (d) and presence of competing wild-type hADA1. e Western blot showing the binding of biotinylated mouse ADA1 to THP1 cells in the absence (lane 1) or presence of unmodified human ADA1 (lane 2) and the binding of biotinylated mouse (lane 3) and human ADA1 (lane 4) to CD26+ HuT78 cells expressing CD26
Fig. 5
Fig. 5
Analysis of cell subsets in DADA2 patients and healthy controls. a CD3− CD56+ NK and CD3+ CD56+ NKT cells, b CD14+ monocytes and c CD19+ B-cells are shown on the dot plots. The gating strategy for lymphocytes and monocytes is shown in Table 1
Fig. 6
Fig. 6
The level of TNF-α secretion by LPS-activated monocytes is controlled by extracellular adenosine and ADA2. a Changes in the TNF-α secretion level by LPS-activated monocytes in response to the increased adenosine concentration. b Addition of enzymatically active ADA2 but not ADA (H88G) mutant to adenosine-suppressed monocytes increases the level of TNF-α by LPS-activated monocytes in the presence of 50 µM adenosine. c Analysis of ADA2 and TNF-α concentration in plasma of healthy donors and DADA2 patients and their relatives
Fig. 7
Fig. 7
A scheme showing the binding of human ADA1 and ADA2 to immune cell subsets and their possible role in the regulation of immune cell activity. It is shown that ADA2 is secreted by monocytes and it may bind proteoglycans, adenosine, or other unknown receptors expressed on the surface of CD16+ monocytes, CD16+ NK cells, CD16+ neutrophils, CD39+ Treg cells and B cells. In contrast, extracellular ADA1 could be found on the effector T cells expressing ADA1 receptor CD26. ADA1 may also bind CD16− monocytes and epithelial/stromal cells via adenosine or other unknown receptors and participate in bridging of T cells and monocytes. Some of the cells express ecto-enzymes CD39 and CD73 hydrolyzing ATP into AMP and AMP into adenosine, respectively. Adenosine can bind to A2A receptors, expressed on the same or other cells and regulate the cell function. ADA2 and ADA1 bound to the cells can also regulate the cells’ function either by decreasing the concentration of extracellular adenosine or by activating their corresponding receptors

References

    1. Hasko G, Linden J, Cronstein B, Pacher P. Adenosine receptors: therapeutic aspects for inflammatory and immune diseases. Nat Rev Drug Discov. 2008;7(9):759–770. doi: 10.1038/nrd2638. - DOI - PMC - PubMed
    1. Fredholm BB. Adenosine, an endogenous distress signal, modulates tissue damage and repair. Cell Death Differ. 2007;14(7):1315–1323. doi: 10.1038/sj.cdd.4402132. - DOI - PubMed
    1. Linden J, Cekic C. Regulation of lymphocyte function by adenosine. Arterioscler Thromb Vasc Biol. 2013;32(9):2097–2103. doi: 10.1161/ATVBAHA.111.226837. - DOI - PMC - PubMed
    1. Eltzschig HK, Sitkovsky MV, Robson SC. Purinergic signaling during inflammation. N Engl J Med. 2012;367(24):2322–2333. doi: 10.1056/NEJMra1205750. - DOI - PMC - PubMed
    1. Burnstock G. Purinergic signalling and disorders of the central nervous system. Nat Rev Drug Discov. 2008;7(7):575–590. doi: 10.1038/nrd2605. - DOI - PubMed

Publication types

MeSH terms