. 2016 Sep 1;30(17):1971-90.
doi: 10.1101/gad.283762.116.

Superenhancer reprogramming drives a B-cell-epithelial transition and high-risk leukemia

Affiliations

Superenhancer reprogramming drives a B-cell-epithelial transition and high-risk leukemia

Yeguang Hu et al. Genes Dev. .

Abstract

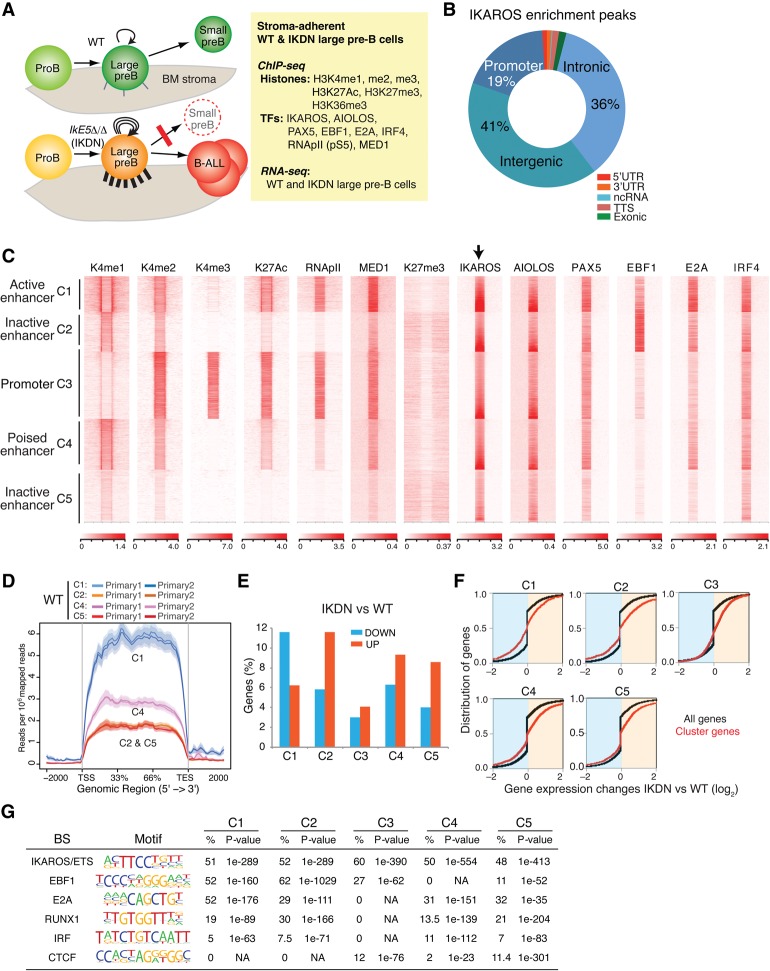
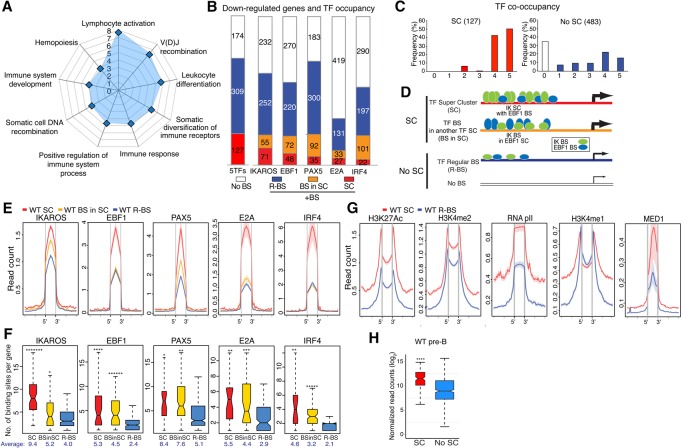
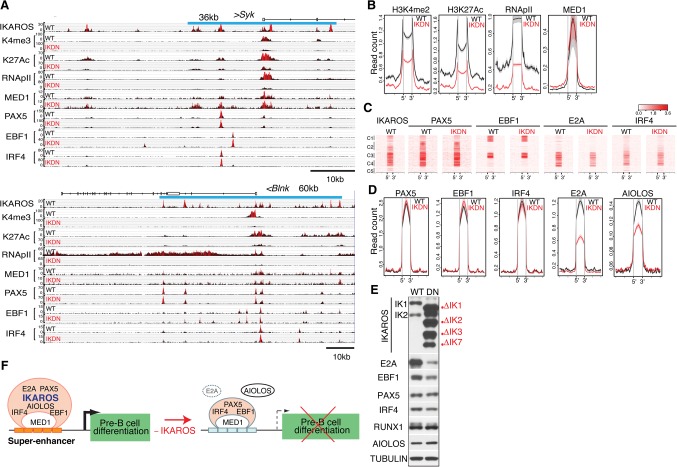
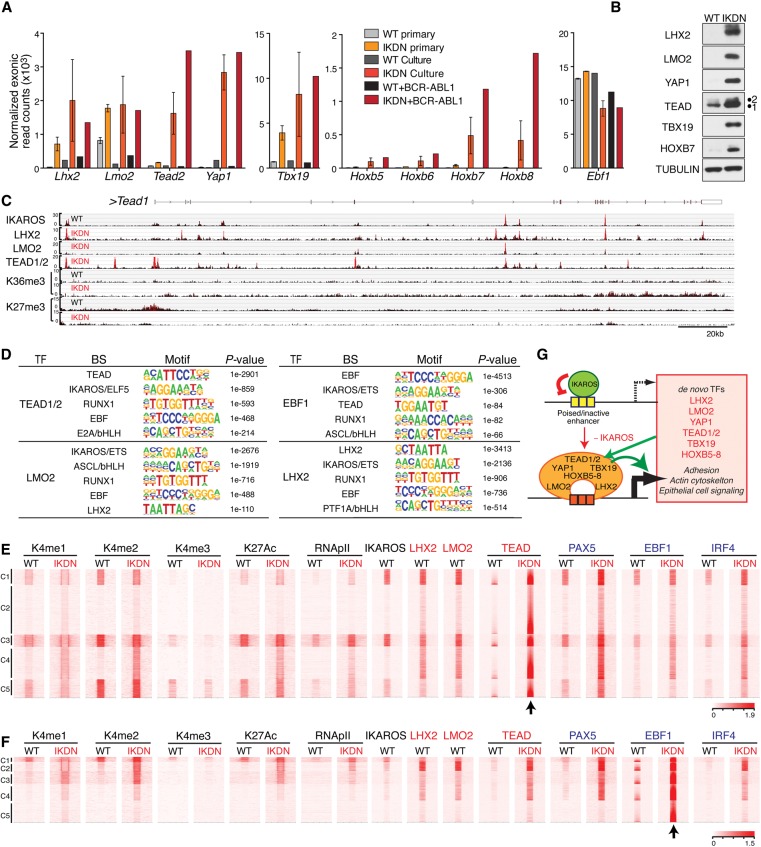
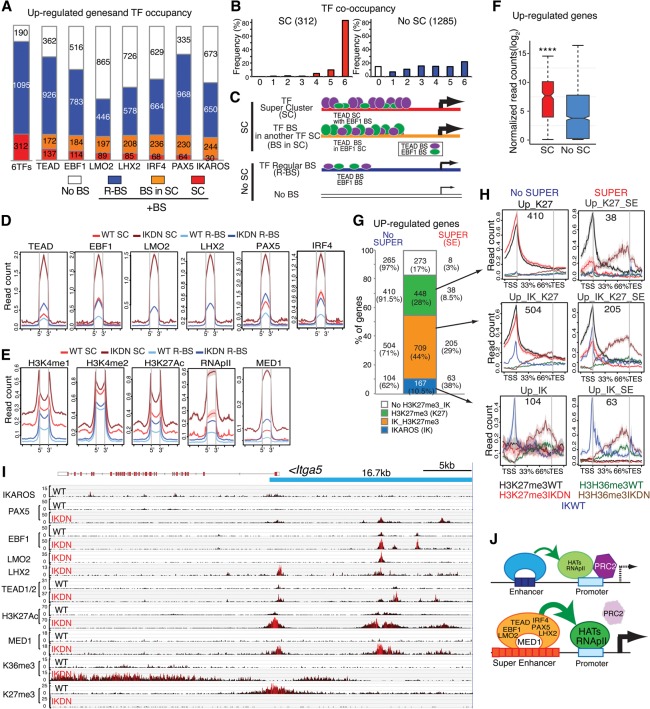
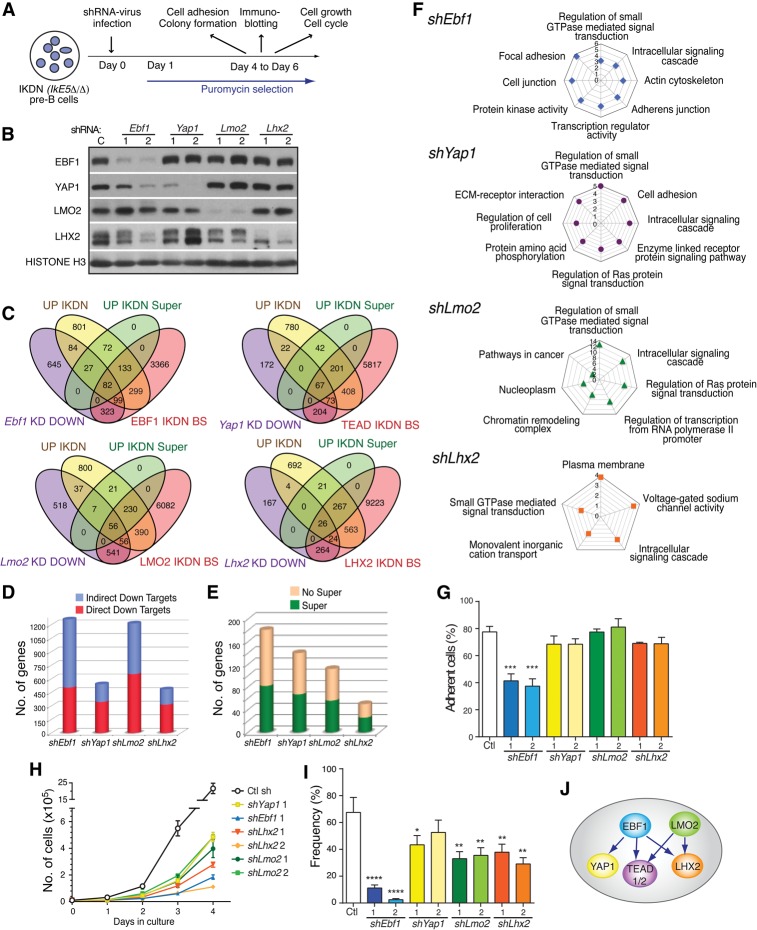
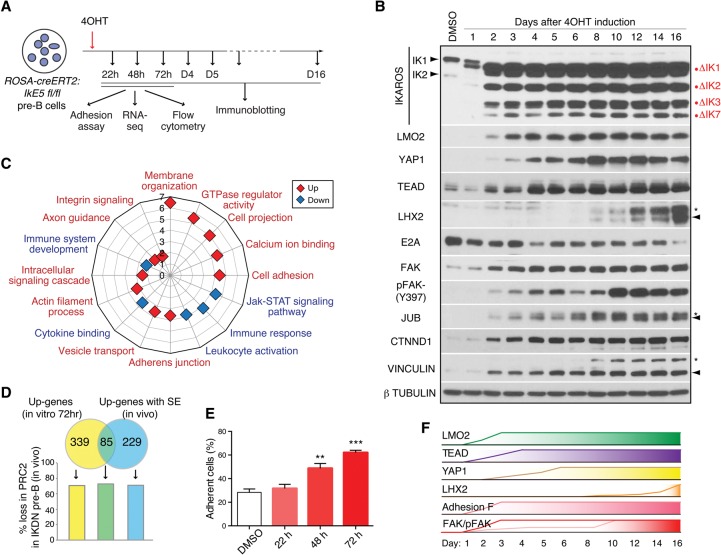
IKAROS is required for the differentiation of highly proliferative pre-B-cell precursors, and loss of IKAROS function indicates poor prognosis in precursor B-cell acute lymphoblastic leukemia (B-ALL). Here we show that IKAROS regulates this developmental stage by positive and negative regulation of superenhancers with distinct lineage affiliations. IKAROS defines superenhancers at pre-B-cell differentiation genes together with B-cell master regulators such as PAX5, EBF1, and IRF4 but is required for a highly permissive chromatin environment, a function that cannot be compensated for by the other transcription factors. IKAROS is also highly enriched at inactive enhancers of genes normally expressed in stem-epithelial cells. Upon IKAROS loss, expression of pre-B-cell differentiation genes is attenuated, while a group of extralineage transcription factors that are directly repressed by IKAROS and depend on EBF1 relocalization at their enhancers for expression is induced. LHX2, LMO2, and TEAD-YAP1, normally kept separate from native B-cell transcription regulators by IKAROS, now cooperate directly with them in a de novo superenhancer network with its own feed-forward transcriptional reinforcement. Induction of de novo superenhancers antagonizes Polycomb repression and superimposes aberrant stem-epithelial cell properties in a B-cell precursor. This dual mechanism of IKAROS regulation promotes differentiation while safeguarding against a hybrid stem-epithelial-B-cell phenotype that underlies high-risk B-ALL.

Keywords: LHX2; PRC2; TEAD; YAP1; self-renewal.


Figures

Figure 1.
Figure 1.
Transcriptional and epigenetic landscape of wild-type adherent large pre-B cells. (A) Outline of an experimental approach to delineate the transcriptional mechanisms that guide pre-B-cell differentiation through a highly proliferative stromal-adherent phase. The effects of homozygous deletion of Ikzf1 exon 5 (IkE5Δ/Δ), encoding the DNA-binding domain and generating an IKDN isoform, on cell adhesion (cell projections on BM stroma), self-renewal (circular arrows), differentiation block (red line), and leukemogenesis (B-ALL) are depicted. (B) Relative distribution of IKAROS enrichment peaks at the indicated genomic locations in wild-type stromal-adherent large pre-B cells. (C) Heat map generated by K-means clustering of reads from ChIPs of histone modifications and transcription factors centered on IKAROS enrichment peaks (±15 kb). Read distribution within IKAROS enrichment peaks and size were normalized to the expected fragment size using the default spline fit algorithm of NGS.plot. Five clusters were generated, four of which were designated by histone modification enrichment as enhancers (C1, C2, C4, and C5) and one of which was designated as a promoter (C3). (D) Average gene expression for IKAROS gene targets in enhancer clusters C1, C2, C4, and C5, shown as exonic read distribution over the gene body (read count per million mapped reads). RNA-seq studies were performed with two independently isolated wild-type large pre-B-cell samples. (E) Percentage distribution of 1597 up-regulated and 610 down-regulated genes in IKDN pre-B cells in clusters (as in C) defined by IKAROS binding, histone modifications, and transcription factor distributions. (F) Cumulative distribution function (CDF) plots depicting differential gene expression between IKDN and wild-type pre-B cells are shown for each gene cluster (red) defined in C relative to differential gene expression of all genes (black). P-values for differences in gene expression for each cluster relative to all genes were <0.0001, calculated using a two-sided Kolmogorov Smirnov test. (G) De novo transcription factor-binding motif analysis (HOMER) of IKAROS enrichment peaks in wild-type adherent large pre-B cells is shown for each cluster defined in C. The most significantly discovered motifs, frequency (percentage), and P-values are shown.
Figure 2.
Figure 2.
IKAROS-based enhancer superclusters (SCs) support the large-to-small pre-B-cell transition. (A) Gene ontology (GO) of functional pathways for genes with superenhancers down-regulated in IkE5Δ/Δ (IKDN) stromal-adherent large pre-B cells and associated with IKAROS-binding sites in wild-type pre-B cells is shown. P-values (−log10 transformed) for pathway discovery are indicated. (B) Histogram depicting the frequency (in wild-type large pre-B cells) of occupancy by the indicated B-cell transcription factors of 610 genes down-regulated upon loss of IKAROS activity. Genes bound by a specific transcription factor are further subdivided by whether they are associated with regular binding sites (R-BS), binding sites in a SC configuration, or another factor's SC (BS in SC). The histogram at the left (5TFs) indicates the overall number of genes associated with any transcription factor SC (127), associated with a regular enhancer (R-BS; 309), or not associated with any transcription factor-binding sites (No BS; 174). (C) The frequency of occupancy of down-regulated genes with (SC) or without (no SC) SCs by the five transcription factors (from 0 to 5) is shown. (D) Schematic representation of idealized examples of IKAROS-binding sites (green ovals) in a SC configuration (SC), within a SC of another transcription factor (shown here as EBF1 in blue ovals; BS in SC), in a regular enhancer (R-BS), or in a gene with no binding sites (No BS) for these factors. The frequency of transcription factor occupancy is represented by the size of the ovals, whereas the relative density of binding sites is depicted by the number of ovals. The relative transcription level at these gene subsets is depicted by the thickness of an arrow at the transcription start site (TSS). (E) Comparative enrichment of transcription factors at binding sites associated with SCs ([red] SC; [yellow] BS in SC) or regular enhancers (R-BS) at down-regulated genes. Read densities (read count per million mapped reads) for IKAROS, EBF1, PAX5, E2A, and IRF4 are provided for wild-type pre-B cells. The start (5′) and end (3′) of transcription factor-binding sites are indicated. (F) Box plots depicting the distribution of the number of binding sites for the transcription factors in B at SCs, binding sites associated with SCs, and regular enhancer configurations. Box plot whiskers extend to 1.5 times the interquartile range. The average number of binding sites per gene subset is shown below each plot. P-values for differential distributions in the SC or BS in SC group relative to the R-BS group were obtained using an unpaired two-tailed t-test with variance determined by an F-test. Statistical significance compared with the R-BS subset are shown as P-values. (*******) P < 10−9; (******) P < 10−6; (*****) P < 10−5; (****) P < 10−4; (***) P < 10−3; (**) P < 10−2; (*) P < 0.05. (G) Comparative enrichment of permissive histone modifications (H3K27ac, H3K4me2, H3K4me1, RNApII, and MED1) at constituent SC-binding sites (SC) or regular binding sites (R-BS) as in D. (H) Expression in wild-type pre-B cells of down-regulated genes with or without SCs (SC or no SC) is shown in a box plot of log2 transformed normalized exonic read counts. Box plot whiskers extend to 1.5 times the interquartile range. A highly significant difference in expression between the two subsets in wild-type large pre-B cells is supported by a P-value of <10−4 (****) obtained by two-tailed unpaired t-test.
Figure 3.
Figure 3.
The permissive chromatin state of pre-B-cell superenhancers is dependent on IKAROS. (A) Genome browser tracks are shown for ChIP-seq of IKAROS, H3K4me3, H3K27ac, RNApIIS5, MED1, PAX5, EBF1, and IRF4 at the Sykb (top panel) and Blnk (bottom panel) genes in wild-type and IKDN pre-B cells. The associated IKAROS superenhancers are demarcated by blue lines (Sykb, 36 kb; Blnk, 60 kb). Black histograms depict sequencing read distribution, with red indicating a higher read depth. (B) Comparative analysis of read densities for permissive histone modifications (H3K27me2, H3K27ac, RNApII, and MED1) at transcription factor-binding sites that constitute superenhancers affiliated with down-regulated genes is shown in wild-type (black) and IKDN (red) pre-B cells. (C,D) Comparative analysis of B-cell transcription factor enrichment at superenhancer-binding sites as described in B. (C) Heat maps were generated by K-means clustering of reads from ChIPs for transcription factors centered at the constituent binding sites of superenhancers associated with 127 down-regulated genes described in Figure 2B. (D) Read densities of transcription factors at superenhancer-binding sites as in B and C (±15 kb). (E) Immunoblot analysis of B-cell transcription factors in wild-type and IKDN stromal-adherent large pre-B cells. The two major IKAROS isoforms (IK1 and IK2) expressed in wild-type pre-B cells are identified at the left. Mutant isoforms are identified at the right. (F) A model of regulation of pre-B-cell differentiation genes by IKAROS superenhancers. Transcriptionally permissive IKAROS-based superenhancers (orange bars) are associated with highly expressed genes promoting pre-B-cell differentiation (black arrow). Loss of IKAROS causes restriction in the chromatin configuration at superenhancers (light-blue bars), transcription is attenuated (broken arrow), and pre-B-cell differentiation is blocked. However, with the exception of AIOLOS and E2A, binding of PAX5, EBF1, IRF4, and MED1 at these regulatory sites was not affected.
Figure 4.
Figure 4.
Direct repression of an extralineage transcription factor network by IKAROS. (A) Induction of mRNA expression for Lhx2, Lmo2, Tead2, Yap1, Tbx19, and Hoxb5–8 in IKDN preleukemic and leukemic (+BCR-ABL1) pre-B cells. Normalized exonic raw reads are shown for the average of two wild-type and two IKDN ex vivo isolated large pre-B-cell populations (primary), one wild-type and two IKDN cultured stromal-adherent large pre-B-cell populations (Culture), one wild-type + BCR–ABL1 and one IKDN + BCR–ABL1 cultured large pre-B leukemia cell population. Ebf1 expression is shown as a control. (B) Immunoblot analysis of protein expression for the transcription factors from A. (C) Genome browser tracks are shown at the Tead1 locus for ChIP-seq of IKAROS, LHX2, LMO2, TEAD 1/2, H3K36me3 (K36me3), and H3K27me3 (K27me3) in wild-type and IKDN pre-B cells. (D) De novo motif discovery (HOMER) for peaks of TEAD (1/2), EBF1, LHX2, and LMO2 specifically enriched in IKDN stromal-adherent large pre-B cells. The most significant discovered motifs and log10 P-values are shown. (E,F) Heat maps were generated by K-means clustering of reads from ChIPs for histone modifications (H3K4me1, H3K4me2, H3K4me3, and H3K27ac) and transcription factors (RNApII, IKAROS, LHX2, LMO2, TEAD, PAX5, EBF1, and IRF4) centered (arrow) at de novo TEAD (E) or EBF1 (F) peaks (C1–C5). Extralineage and B-cell transcription factors are marked in red and blue, respectively. (G) Model of IKAROS repression at inactive/poised enhancers associated with master transcription regulators of stem and epithelial cell origin. Induction of these transcription factors triggered by loss of IKAROS initiates a feed-forward cross-regulatory loop that augments their own expression and that of other genes involved in epithelial cell functions.
Figure 5.
Figure 5.
Induction of de novo superenhancers and Polycomb eviction. (A) Histogram depicting the frequency (in IKDN large pre-B cells) of occupancy of 1597 up-regulated genes by the indicated extralineage and B-cell transcription factors. Genes bound by a specific transcription factor are further subdivided by whether they are associated with regular binding sites (R-BS) or binding sites in SCs (SC or BS in SC). (B) The frequency of transcription factor co-occupancy (from 0 to 6) in up-regulated genes with SCs or regular enhancer binding sites (R-BS) is shown. (C) Schematic representation of idealized examples of binding of TEAD (purple ovals) and EBF1 (green ovals) at up-regulated genes in a SC configuration (SC), within a SC of another transcription factor (BS in SC), or in a regular enhancer (R-BS) or at a gene with no binding sites (No BS). The frequency of transcription factor occupancy inferred from D is represented by the size of the ovals, while the relative density of binding sites obtained from Supplemental Figure 6D is depicted by the number of ovals. (D,E) Occupancy as determined by read density (read count per million mapped reads) for transcription factors (EBF1, PAX5, LMO2, LHX2, PAX5, and IRF4) (D) and histone modifications (H3K4me1, H3K4me2, H3K27ac) as well as RNApII and MED1 at transcription factor-binding sites in SCs or regular enhancers (R-BS) associated with up-regulated genes (E) is shown for wild-type ([red] SC; [light blue] R-BS) and IKDN ([brown] SC; [dark blue] R-BS) pre-B cells. (F) Expression in IKDN large pre-B cells of up-regulated genes with or without SCs (SC or No SC) is shown in a box plot of log2 transformed normalized exonic read counts. A highly significant difference in expression between the two subsets in IKDN large pre-B cells is supported by a P-value of <0.0001 (****) obtained by a two-tailed unpaired t-test. (G) Bar graph distribution of up-regulated genes (IKDN pre-B) subdivided into four groups according to their association with PRC2 activity (H3K27me3/K27) or IKAROS (IK) binding. Further subdivision of these subsets according to superenhancer association is provided by numbers and frequencies at the left (no SUPER) or right (SUPER/SE) side of the bar graph. (H) PRC2 (H3K27me3), transcriptional activity (H3K36me3), and IKAROS association are shown over the body of up-regulated gene subsets with (right column) or without (left column) superenhancers in wild-type and IKDN pre-B cells. (I) A 16.7-kb superenhancer contributed by EBF1, TEAD, and LMO2 at the 5′ prime end of the Itga5 gene is shown on the genome browser. ChIP-seq enrichment tracks are shown for IKAROS, PAX5, EBF1, LMO2, LHX2, TEAD (1/2), H3K27ac, MED1, H3K36me3, and H3K27me3. (J) Model of gene derepression by de novo enhancers and superenhancers in IKDN pre-B cells. Recruitment of permissive chromatin modifiers by the extralineage and B-cell transcription factors at enhancers and subsequent promoter interactions may support eviction of the PRC2-repressive complex. Cooperative interactions among transcription and chromatin regulators at superenhancers may augment this process, leading to rapid PRC2 eviction and gene activation.
Figure 6.
Figure 6.
Differential regulation of cell adhesion, growth, and self-renewal by a de novo network of transcription factors. (A) Schematic depiction of studies on transcription factor knockdown in IKDN pre-B cells. IKDN pre-B cells were transduced with lentivirus expressing two independent shRNAs each for Ebf1, Yap1, Lhx2, and Lmo2 and were placed under puromycin selection 1 d later. Following 4–6 d of selection, IKDN pre-B cells were tested for protein and mRNA expression changes as well as changes in adhesion, cell growth, cell cycle, and colony formation in a limiting dilution assay. (B) Immunoblot analysis of IKDN pre-B cells treated with factor-specific shRNA vectors or controls. (C) Venn diagrams depicting the overlap between genes down-regulated (DOWN) by factor-specific knockdowns (KD), genes associated with de novo sites for these factors in IKDN pre-B cells (IKDN BS), all genes up-regulated upon loss of IKAROS in pre-B cells (Up IKDN), and the subset associated with superenhancers (UP IKDN Super). (D) Bar graphs representing the subdivision of down-regulated direct target genes by factor-specific knockdowns into indirect and direct targets deduced from C. (E) Bar graph depicting the subdivision of genes directly dependent on EBF1, YAP1, LHX2, and LMO2 for expression and IKAROS for repression by whether they associate with superenhancers (Super) in IKDN pre-B cells or not (No Super) as deduced from C. (F) GO of functional pathways enriched for down-regulated genes by factor-specific knockdowns. The P-values (−log10 transformation) for pathway discovery are indicated. (G) Effect of transcription factor inactivation on integrin-mediated cell adhesion of IKDN pre-B cells. The standard error of mean for cell adhesion is shown for each factor and the significant P-value for Ebf1 sh2. (***) P = 0.0007. (H) The effect of transcription factor inactivation on growth of IKDN pre-B cells. Growth was measured from 1 to 4 d after replating of puromycin-selected cells on BM stroma. Standard deviations and P-values are provided for Ebf1 sh2 (P = 0.0042), Lhx2 sh1 (P = 0.0053) and sh2 (P = 0.004), Lmo2 sh1 (P = 0.0009) and sh2 (P = 0.0083), and Yap1 sh1 (P = 0.0054). (I) The effect of inactivation of transcription factors on the self-renewing properties of IKDN pre-B cells was measured by a limiting dilution colony-forming assay. P-values are provided for Ebf1 sh1 (P = 6.6 × 10⁻¹⁵), sh2 ([****] P = 9.85 × 10⁻³⁵), Lhx2 sh1 ([**] P = 0.00753) and sh2 ([**] P = 0.0001), Lmo2 sh1 ([**] P = 0.001) and sh2 ([**] P = 0.0033), and Yap1 sh1 ([*] P = 0.042) and sh2 (P = 0.273). (J) A model of Yap1, TEAD1/2, and Lhx2 regulation by EBF1 and LMO2 supported by protein and gene expression studies is depicted.
Figure 7.
Figure 7.
Active repression of an “epithelial-like” cell fate in wild-type pre-B cells. (A) Schematic representation of in vitro IKAROS inactivation in IkE5fl/fl;Rosa26-ERT2-Cre stromal-adherent large pre-B cells by 4-OHT treatment. The effects on cell adhesion, RNA expression, and immune phenotype were measured following 22–72 h of treatment. Protein expression was determined from 1–16 d of treatment. (B) Immunoblot analysis is shown for IKAROS, FAK, FAKY397, LHX2, TEAD1/2, YAP1, LMO2, AJUBA, CTNND1, VINCULLIN, E2A, and TUBULIN (control) either in untreated IkE5fl/fl;Rosa26-ERT2-Cre pre-B cells or after 4-OHT treatment for 1–16 d. (C) GO analysis of functional pathways enriched by up-regulated (red) and down-regulated (blue) genes in IkE5fl/fl;Rosa26-ERT2-Cre pre-B cells after 72 h of 4-OHT treatment. The P-values (−log10 transformation) for pathway discovery are indicated. (D) Venn diagram depicting the overlap between significantly up-regulated genes after in vitro IKAROS deletion in wild-type pre-B cells (as in C) and up-regulated genes with transcription factor superenhancers (SE) in IKDN pre-B cells generated in vivo. The frequency of loss in PRC2 activity in IKDN pre-B (generated in vivo) is correlated with the three up-regulated gene subsets (as defined by Venn). (E) The effect of in vitro IKAROS inactivation on pre-B-cell integrin-mediated cell adhesion. Integrin ligand adhesion was measured in untreated cells (DMSO) and cells treated for 20–70 h with 4-OHT. The standard error of mean for cell adhesion and P-values for change in cell adhesion at 48 h ([**] P = 0.0034) and 70 h ([***] P = 0.0002) relative to DMSO control are shown. (F) A schematic diagram of the rapid changes in key transcription factors, adhesion, and signaling molecules that occur shortly after in vitro IKAROS deletion in large pre-B cells.

References

    1. Adam RC, Yang H, Rockowitz S, Larsen SB, Nikolova M, Oristian DS, Polak L, Kadaja M, Asare A, Zheng D, et al. 2015. Pioneer factors govern super-enhancer dynamics in stem cell plasticity and lineage choice. Nature 521: 366–370. - PMC - PubMed
    1. Bossen C, Murre CS, Chang AN, Mansson R, Rodewald HR, Murre C. 2015. The chromatin remodeler Brg1 activates enhancer repertoires to establish B cell identity and modulate cell growth. Nat Immunol 16: 775–784. - PMC - PubMed
    1. Bryder D, Sigvardsson M. 2010. Shaping up a lineage—lessons from B lymphopoesis. Curr Opin Immunol 22: 148–153. - PubMed
    1. Chambers J, Rabbitts TH. 2015. LMO2 at 25 years: a paradigm of chromosomal translocation proteins. Open Biol 5: 150062. - PMC - PubMed
    1. Cheng AM, Rowley B, Pao W, Hayday A, Bolen JB, Pawson T. 1995. Syk tyrosine kinase required for mouse viability and B-cell development. Nature 378: 303–306. - PubMed

Publication types

MeSH terms