Review
. 2017 Jan:56:84-106.
doi: 10.1016/j.preteyeres.2016.09.005. Epub 2016 Sep 21.

Caveolins and caveolae in ocular physiology and pathophysiology

Affiliations
Review

Caveolins and caveolae in ocular physiology and pathophysiology

Xiaowu Gu et al. Prog Retin Eye Res. 2017 Jan.

Abstract

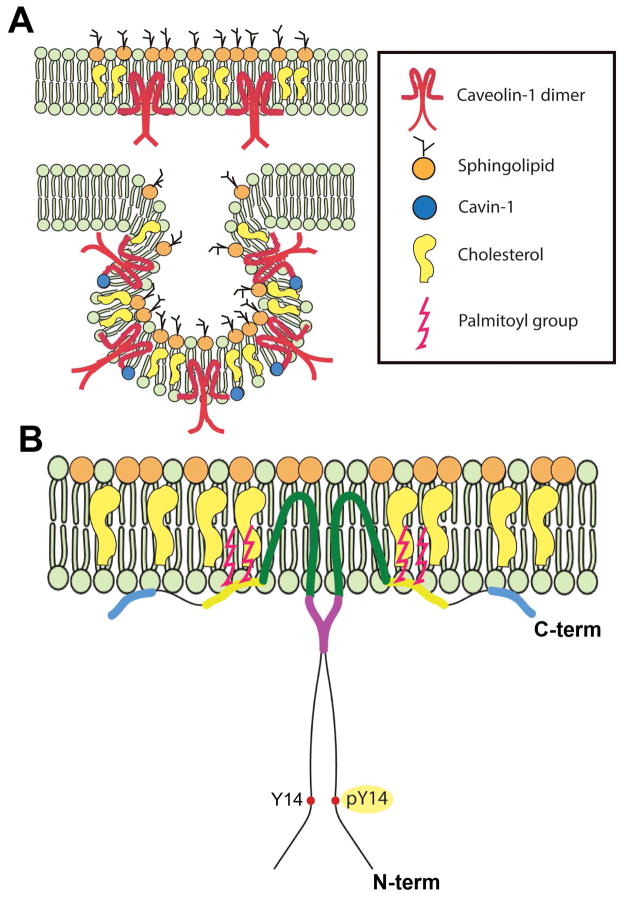
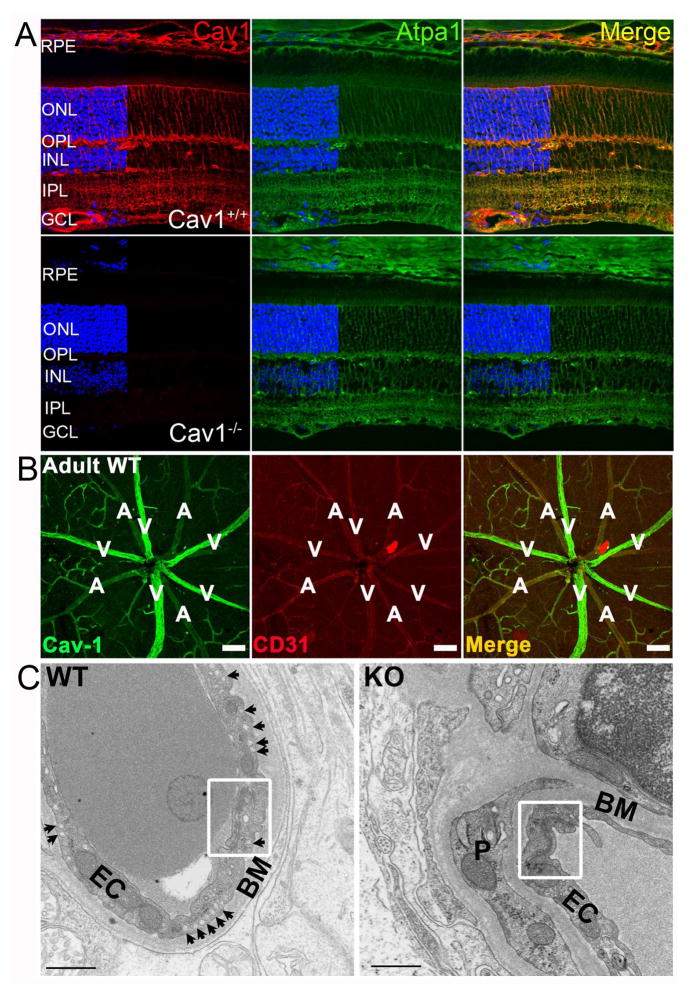
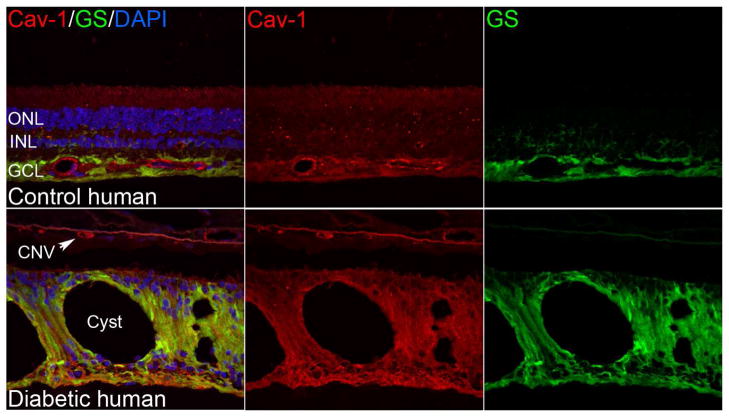
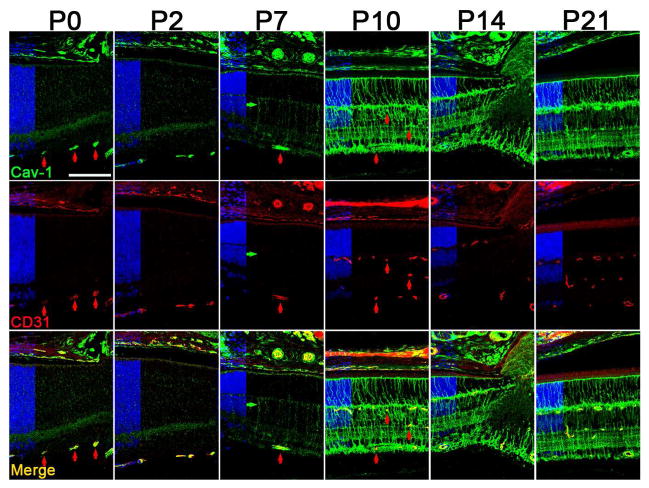
Caveolae are specialized, invaginated plasma membrane domains that are defined morphologically and by the expression of signature proteins called, caveolins. Caveolae and caveolins are abundant in a variety of cell types including vascular endothelium, glia, and fibroblasts where they play critical roles in transcellular transport, endocytosis, mechanotransduction, cell proliferation, membrane lipid homeostasis, and signal transduction. Given these critical cellular functions, it is surprising that ablation of the caveolae organelle does not result in lethality suggesting instead that caveolae and caveolins play modulatory roles in cellular homeostasis. Caveolar components are also expressed in ocular cell types including retinal vascular cells, Müller glia, retinal pigment epithelium (RPE), conventional aqueous humor outflow cells, the corneal epithelium and endothelium, and the lens epithelium. In the eye, studies of caveolae and other membrane microdomains (i.e., "lipid rafts") have lagged behind what is a substantial body of literature outside vision science. However, interest in caveolae and their molecular components has increased with accumulating evidence of important roles in vision-related functions such as blood-retinal barrier homeostasis, ocular inflammatory signaling, pathogen entry at the ocular surface, and aqueous humor drainage. The recent association of CAV1/2 gene loci with primary open angle glaucoma and intraocular pressure has further enhanced the need to better understand caveolar functions in the context of ocular physiology and disease. Herein, we provide the first comprehensive review of literature on caveolae, caveolins, and other membrane domains in the context of visual system function. This review highlights the importance of caveolae domains and their components in ocular physiology and pathophysiology and emphasizes the need to better understand these important modulators of cellular function.

Keywords: Blood-retinal barrier; Caveolae; Caveolin; Glaucoma; Lipid rafts; Neuroinflammation; Ocular hypertension; Vascular permeability.


Figures

Fig. 1
Fig. 1
Caveolae membrane domains and the signature Cav-1 protein. (A) Illustrations of a planar Cav-1-enriched membrane microdomains with “extracaveolar” caveolin-1 and a typical caveola. (B) Model of the insertion of a caveolin-1 homodimer with the CSD (purple) and the Tyr-14 which can be phosphorylated by several tyrosine kinases.
Fig. 2
Fig. 2
Localization of caveolin-1 and caveolae in the murine retina. (A) Retinal cross-sections from Cav-1+/+ (upper panel) and Cav-1−/− mice (lower panel) stained for Cav-1 (red) and the Na/K-ATPase. Cav-1 immunoreactivity is predominantly localized to Müller glia, retinal and choroidal vasculature, and to the RPE (modified from (Li et al., 2012)). (B) Vascular localization of Cav-1 (green) and CD31 (red) revealed in retinal whole mount. Cav-1 is detected throughout the retinal vasculature with enhanced immunoreactivity in large retinal veins. Scale bar = 100 μm; “A”, artery; “V”, vein. (C) Ultrastucture of Cav-1+/+ and Cav-1−/− retinal vessels. Note the numerous abluminal caveolae (arrows in the left panel) and the absence of caveolae in Cav-1−/− vessel. Well-developed tight junctions (white boxes) are visible in both genotypes. BM, basement membrane; EC, endothelial cell; P, pericyte. Scale bar = 500 nm. Panels B and C from (Gu et al., 2014a).
Fig. 3
Fig. 3
Localization of caveolin-1 and caveolae in control and diabetic human retinae. Like the murine retina, Cav-1 immunoreactivity is detectable in retinal vasculature and Müller glia (labeled with glutamine synthetase, “GS”, in green). In the cystic, diabetic retina in the lower panels Cav-1 immunoreactivity is enhanced in Müller glia and is also present in the choroidal neovascular (CNV) lesion. (Elliott laboratory, unpublished images).
Fig. 4
Fig. 4
Developmental expression of Cav-1 in the murine retina. Cav-1 (green) is expressed in developing vasculature (colabeled with CD31 in red) as early as P0. In the neuroretinal compartment, Cav-1 expression increases dramatically from P7–P10 in cells with Müller glial morphology. Reproduced from (Gu et al., 2014b).
Fig. 5
Fig. 5
Cav-1 mRNA expression is significantly reduced in isolated Müller glia at the peak of rod degeneration in rhodopsin knockout mice. The Müller gliotic gene, GFAP, shows the opposite pattern of expression. These results suggest that Cav-1 expression is associated with differentiated Müller glia. The gray bar shows expression in Müller glia at the peak of cone degeneration in the rhodopsin knockout model. These data were plotted from the raw data presented in (Roesch et al., 2012).
Fig. 6
Fig. 6
Electrophysiological studies from Cav-1−/− mice. ERG analysis (A–C) revealed significantly reduced photoreceptor a-wave and second order neuronal (b-wave) responses, in vivo. (D) Suction electrode recordings of rod light responses to graded series of flash intensities reveal normal photoresponses from isolated rods. (left panel) Mean current traces in wildtype rods (black traces) to flashes at intensities of 4, 17, 43, 160, 450, and 1122 photons μm−2. The average dark current in wildtype rods was 14.1 ± 0.6 pA (n = 45). (right panel) mean current traces from Cav-1−/− to the same flash intensities. The average dark current in Cav-1 null rods was 12.5 ± 1.1pA(n = 9), not significantly different from wildtype (p = 0.24, Student’s t-test). The flash sensitivity of the Cav-1−/− rods was 0.26 ± 0.03 pA/photon/μm2, not significantly different (p = 0.20) from wildtype rods (0.31 ± 0.02 pA/photon/μm2. These results indicate that retinal function in situ is defective but that the functional deficit is not intrinsic to rods. Reproduced from (Li et al., 2012).
Fig. 7
Fig. 7
RPE-specific deletion of Cav-1 impairs phagosome clearance by RPE cells, in vivo. (A) Schematic representation of Cre/lox mediated deletion of Cav-1 via RPE-specific Cre recombinase expression. (B) Representative gel of PCR products from genomic DNA from neural retina (NR) and RPE/choroid (R/C) from littermate RPE-Cre-expressing and RPE-Cre-negative mice showing Cre (top panel) and caveolin-1 floxed products. The 350 bp CAV1 deletion product (bottom panel) is detected only in RPE/choroid from Cre-carrying mice following doxycyline induction. (C–F) Representative images showing cross sections of RPE/choroid from RPECAV1−/− (C, E) and RPECAV1+/+ (D, F) labeled with caveolin-1 (green; C–F) and RPE-65 (red; E, F). Arrows indicate apical RPE surface showing absence or presence of caveolin-1 in RPECAV1−/− (C, E) and RPECAV1+/+ (D, F), respectively. Arrowhead indicates caveolin-1 signal in the choroid. (G) Representative western blot showing RPE ablation of caveolin-1 in RPE/choroid lysates from RPECAV1+/+ and RPECAV1−/− mice. RPE-65 and β-actin are loading controls. (H) Quantification of experimental conditions as indicated in (G). (I–J) Representative images showing cross sections of retina from RPECAV1+/+ and RPECAV1−/− mice as indicated sacrificed at 0.5 h (top panels) or 8 h (bottom panels) after light onset labeled with opsin N-terminus antibody B6-30 (green) and nuclei counterstain (blue). Arrows indicate POS phagosomes residing in the RPE. ONL, outer nuclear layer; OS, outer segment layer. Bar = 10 μm. (I) Quantification of phagosome content of 100 μm-stretches of RPE counted from images and samples as shown in A. Bars show mean ± s.e.m.; n = 4 mice per group with phagosomes counted in at least 6 images per mouse. Gray bars: RPECAV1+/+ mice, black bars: RPECAV1−/− mice. (K–M) RPE-specific deletion of Cav-1 reverses the diurnal rhythm in activity of phagolysosomal enzymes in the RPE in situ. (K) Representative images showing close-up views of RPE in retina cross sections from RPECAV1+/+ and RPECAV1−/− mice as indicated sacrificed between 0.5 and 8 h after light onset as indicated labeled with cathepsin D antibody (green) and nuclei counterstain (blue). Bar = 10 μm. (L) Quantification of total cathepsin D protein levels in RPE in situ from images and samples as shown in A. Bars show mean ± s.e.m.; n = 4 mice per group with cathepsin D signal quantified in 4 images per mouse. Gray bars: RPECAV1+/+ mice, black bars: RPECAV1−/− mice. M, Comparison of cathepsin D enzyme activity at 0.5 and 8 h after light onset in posterior eyecups enriched in the RPE and neural retina as indicated from RPECAV1+/+ (gray bars) and RPECAV1−/− mice (black bars). Bars show mean ± s.e.m., n = 4 mice per condition. Reproduced from (Sethna et al., 2016).
Fig. 8
Fig. 8
Loss of Cav-1 results in BRB hyperpermeability (A–E), venous enlargement and a transition of contractile phenotype (increased alpha-SMA and decreased NG2) in mural cells (F–N). Reproduced from (Gu et al., 2014a).
Fig. 9
Fig. 9
(A) Cav-1 deficiency suppresses LPS-induced pro-inflammatory cytokine production. (B) Although basal BRB permeability is higher in Cav-1−/− retinas (inset), inflammatory BRB breakdown induced by LPS is significantly reduced with Cav-1 deficiency. (C–D) Flow cytometry shows that immune cell infiltration in the retina in response to LPS is paradoxically increased in Cav-1−/− retinas. Reproduced from (Li et al., 2014)
Fig. 10
Fig. 10
Illustration of Cav-1/caveolae in the neurovascular unit of normal and inflamed retinal vasculature. Under normal conditions, caveolae show a predominant abluminal localization in vascular endothelium (green) and mural cells (orange). Cav-1 protein, but no caveolae are detectable in Müller glia (purple). During inflammatory conditions (e.g., diabetic retinopathy), caveolae increase in number and show bipolar localization in both endothelial and mural cells possibly promoting transcellular permeability. Cav-1 expression in Müller glia is dramatically increased.

References

    1. Abu-Amero KK, Kondkar AA, Mousa A, Osman EA, Al-Obeidan SA. Lack of association of SNP rs4236601 near CAV1 and CAV2 with POAG in a Saudi cohort. Mol Vis. 2012;18:1960–1965. - PMC - PubMed
    1. Aga M, Bradley JM, Wanchu R, Yang YF, Acott TS, Keller KE. Differential effects of caveolin-1 and -2 knockdown on aqueous outflow and altered extracellular matrix turnover in caveolin-silenced trabecular meshwork cells. Invest Ophthalmol Vis Sci. 2014;55:5497–5509. - PMC - PubMed
    1. Akira S, Takeda K, Kaisho T. Toll-like receptors: critical proteins linking innate and acquired immunity. Nat Immunol. 2001;2:675–680. - PubMed
    1. Albinsson S, Nordstrom I, Sward K, Hellstrand P. Differential dependence of stretch and shear stress signaling on caveolin-1 in the vascular wall. Am J Physiol Cell Physiol. 2008;294:C271–279. - PubMed
    1. Albinsson S, Shakirova Y, Rippe A, Baumgarten M, Rosengren BI, Rippe C, Hallmann R, Hellstrand P, Rippe B, Sward K. Arterial remodeling and plasma volume expansion in caveolin-1-deficient mice. Am J Physiol Regul Integr Comp Physiol. 2007;293:R1222–1231. - PubMed

Publication types