. 1989 Sep;65(3):578-90.
doi: 10.1161/01.res.65.3.578.

Fractal nature of regional myocardial blood flow heterogeneity

Affiliations

Fractal nature of regional myocardial blood flow heterogeneity

J B Bassingthwaighte et al. Circ Res. 1989 Sep.

Abstract

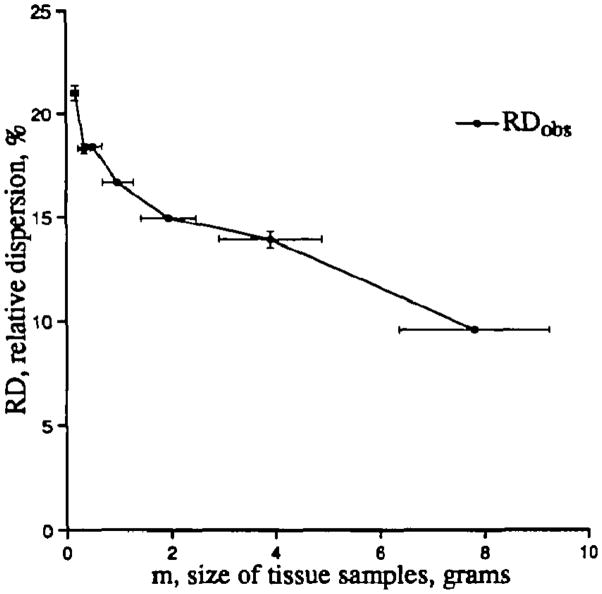
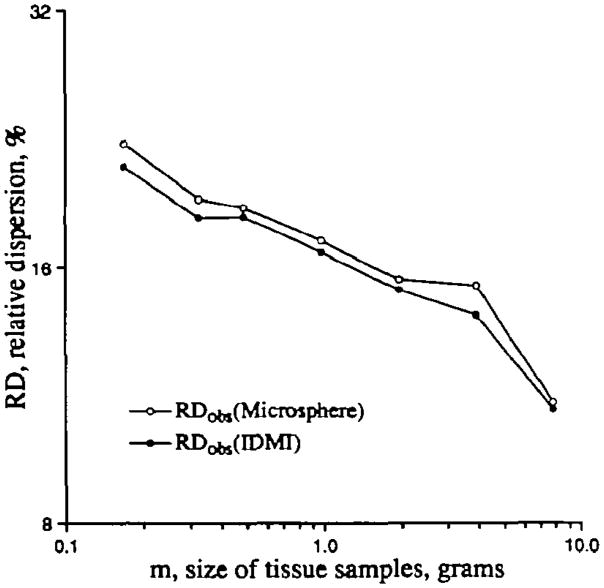
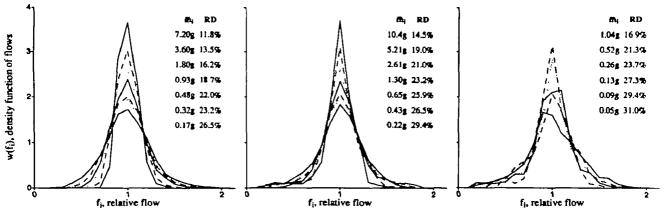
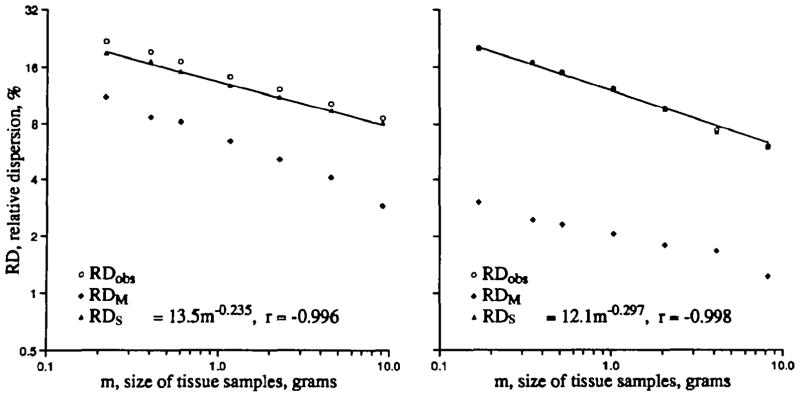
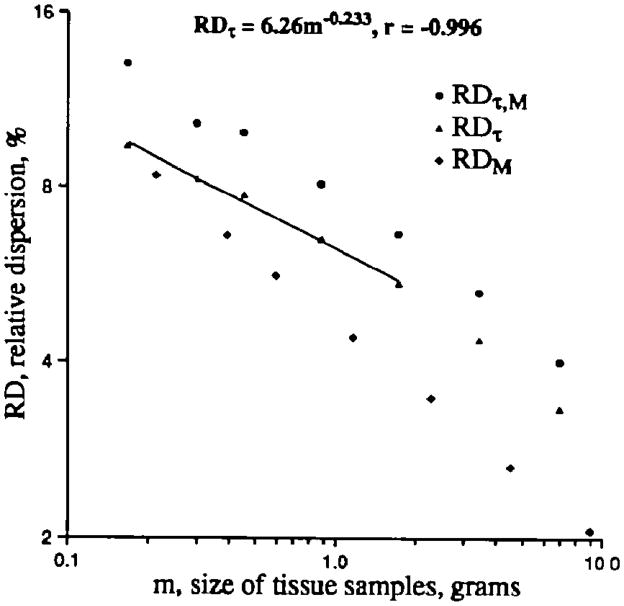
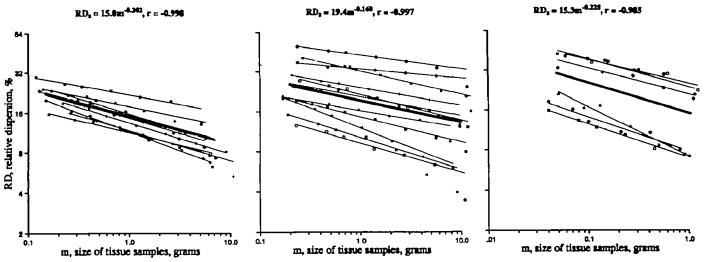
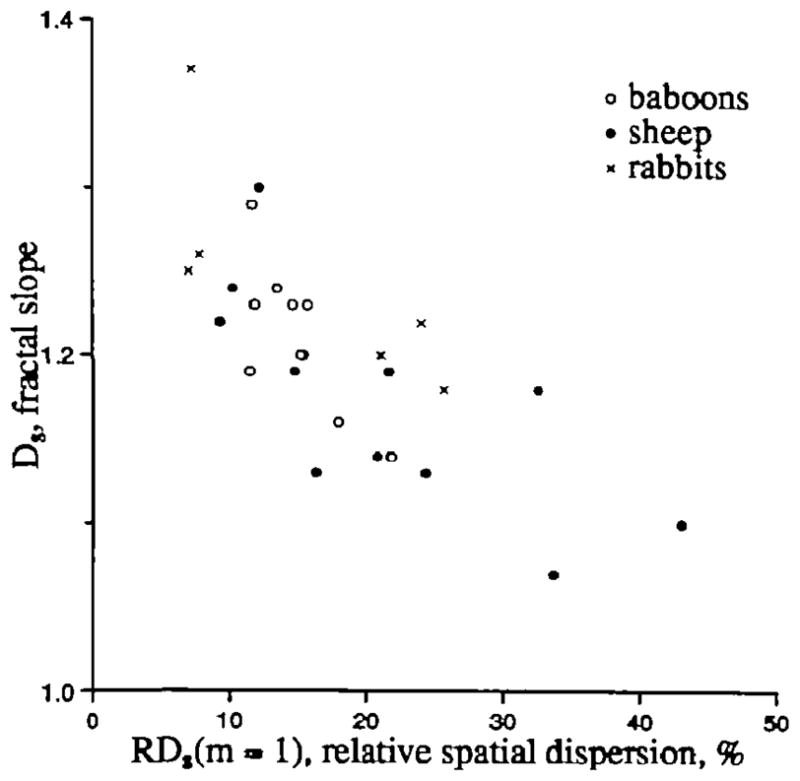
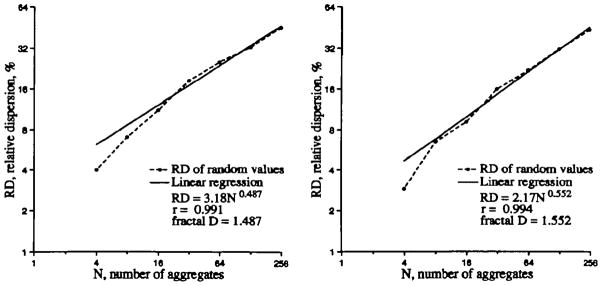
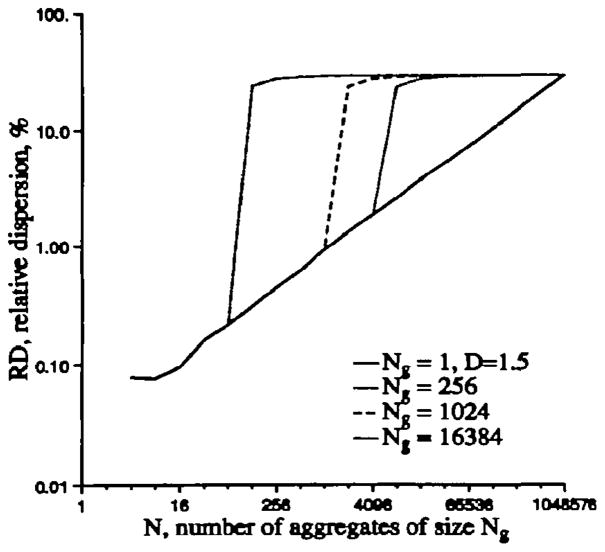
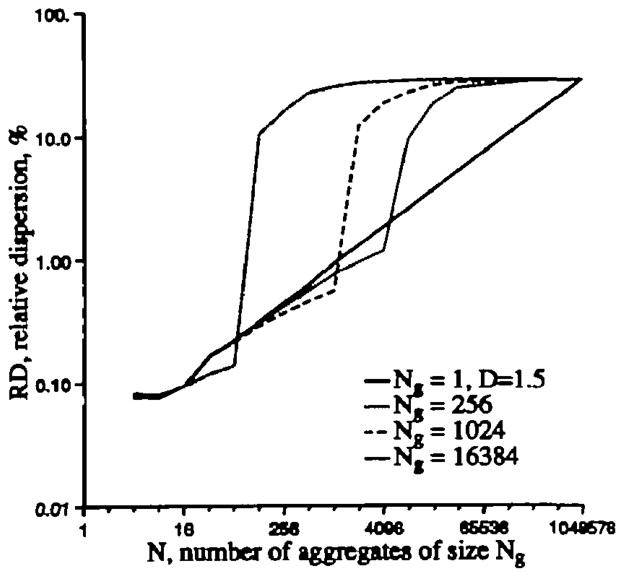
Spatial variation in regional flows within the heart, skeletal muscle, and in other organs, and temporal variations in local arteriolar velocities and flows is measurable even with low resolution techniques. A problem in the assessment of the importance of such variations has been that the observed variance increases with increasing spatial or temporal resolution in the measurements. This resolution-dependent variance is now shown to be described by the fractal dimension, D. For example, the relative dispersion (RD = SD/mean) of the spatial distribution of flows for a given spatial resolution, is given by: RD(m) = RD(mref).[m/mref]1-Ds where m is the mass of the pieces of tissue in grams, and the reference level of dispersion, RD(mref), is taken arbitrarily to be the RD found using pieces of mass mref, which is chosen to be 1 g. Thus, the variation in regional flow within an organ can be described with two parameters, RD(mref) and the slope of the logarithmic relationship defined by the spatial fractal dimension Ds. In the heart, this relation has been found to hold over a wide range of piece sizes, the fractal Ds being about 1.2 and the correlation coefficient 0.99. A Ds of 1.2 suggests moderately strong correlation between local flows; a Ds = 1.0 indicates uniform flow and a Ds = 1.5 indicates complete randomness.


Figures

Figure 1
Figure 1
The effect of sample size on the apparent dispersion of regional blood flow in the left ventricle of a sheep heart. Data were obtained using the “molecular microsphere” iododesmethylimipramine. The apparent relative dispersions (RD, the standard deviations divided by the mean at each level of division) are plotted against the average masses of the pieces for seven different sample sizes. Horizontal bars give the standard deviation of the piece masses, which are not uniform. Vertical bars give the standard deviations of the estimates of RD when estimates are obtained by forming aggregates of adjacent pieces in three to eight different ways.
Figure 2
Figure 2
Fractals are stochastic or deterministic recursions, giving rise to features of systems which are similar, relative to the scale of the recursion, at different scales.
Figure 3
Figure 3
Comparison of the observed relative dispersion (RDobs) to piece mass (m) for iododesmethylimipramine (IDMI) and for microspheres. Data are from the left ventricle of a sheep heart. Microspheres give a larger dispersion over the range of the data but the slopes of the two lines are similar.
Figure 4
Figure 4
Composite probability density functions for regional flows at differing average piece mass for three species. For each species, density functions are shown for several different piece masses. The average piece mass for each distribution is given in the details for each panel. The largest mass gives the narrowest distribution and the smallest gives the broadest. Left panel: Microsphere distributions in 10 baboons. Four to six microsphere measurements were made in each piece. Center panel: Iododesmethylimipramine distributions in 11 sheep. Right panel: Iododesmethylimipramine distributions in six rabbits.
Figure 5
Figure 5
Fractal regression for spatial flow variation in left ventricular myocardium of a baboon (left) and a sheep (right). Plotted are the relative dispersions of the observed density function (RDobs), the methodological dispersion (RDM), and the spatial dispersion (RDs) at each piece mass calculated using Equation 11 for sheep and Equation 12 for baboons. RDobs and RDs are nearly superimposed in the sheep. Fractal analysis of the spatial dispersion on pieces up to 4 g mass showed high correlations.
Figure 6
Figure 6
Temporal component (RDτ) of regional left ventricular myocardial flow variation, as a function of piece mass, from composite data in 10 baboons. Observed methodological dispersion (RDτ,M; ●) was measured by temporally separated injections in 10 baboons and is composed of variation due to moment-by-moment fluctuations in flow plus errors in the microsphere methodology. Microsphere method variation or dispersion (RDM; ◆) was measured by simultaneous injections of four or six differently labeled tracer microspheres in three baboons. Temporal dispersion (RDτ) calculated using Equation 13. Regression analysis of the temporal dispersion gave a fractal D of 1.233 (r=0.996) for RDτ over piece sizes ranging from 0.2 to 2 g.
Figure 7
Figure 7
Fractal regression lines for spatial dispersion (RDS) in baboons, sheep, and rabbits. For each species, the calculated relative dispersions due to spatial heterogeneity of regional blood flow are shown for each level of sampling. The regression lines for the individual animals are shown by the thin lines. In each panel, the thick line is the regression obtained for all of the data points of that group of animals. The slopes, intercepts, and correlation coefficients of the regression equations for the individual animals are given in Table 2. Left panel: Microsphere data from 10 baboons. The composite distribution has a fractal D of 1.202 (r=0.998). Middle panel: Iododesmethylimipramine (IDMI) data from 11 sheep. The line for the composite data has fractal D of 1.160 (r=0.997). Right panel: IDMI data from six rabbits. The composite has a fractal D of 1.225 (r=0.985).
Figure 8
Figure 8
Fractal dimension Ds for spatial variation versus RDs(m=l), the relative dispersion of left ventricular myocardial flows at a voxel size of 1 g.
Figure A.1
Figure A.1
Two examples of the fractal behavior of the two sets of 256 Gaussian random numbers with mean = 1.0 and SD=50% grouped together by 2s to form 128 aggregates, by 4s to form 64 aggregates, etc The theoretical fractal D is 1.5. Even with such poor statistics, especially for the large aggregates where the number of aggregates (N) is small (32, 16, and 8), the recursive grouping of nearest neighbors results in an observed log-log regression line with a fractal D close to the theoretical value of 1.5.
Figure A.2
Figure A.2
Relative dispersion as a function of number of nearest-neighbor aggregates for a randomly ordered and three partially rank-ordered arrays of 220 random numbers with mean 1.0 and SD=0.30. The “cuts” into the array to form the aggregates begin at the first number.
Figure A.3
Figure A.3
Relative dispersion as a function of number of nearest-neighbor aggregates for a randomly ordered and three partially rank-ordered, arrays of 220 random numbers with mean 1.0 and SD=0.30. The “cuts” into the array to form the aggregates begin at a random number.

References

    1. Yipintsoi T, Dobbs WA, Jr, Scanlon PD, Knopp TJ, Bassingthwaighte JB. Regional distribution of diffusible tracers and carbonized microspheres in the left ventricle of isolated dog hearts. Circ Res. 1973;33:573–587. - PMC - PubMed
    1. King RB, Bassingthwaighte JB, Hales JRS, Rowell LB. Stability of heterogeneity of myocardial blood flow in normal awake baboons. Circ Res. 1985;57:285–295. - PMC - PubMed
    1. Bassingthwaighte JB, Malone MA, Moffett TC, King RB, Little SE, Link JM, Krohn KA. Validity of microsphere depositions for regional myocardial flows. Am J Physiol. 1987;253 - PMC - PubMed
    2. Heart Circ Physiol. 22:H184–H193. - PubMed
    1. Yen RT, Fung YC. Effect of velocity distribution on red cell distribution in capillary blood vessels. Am J Physiol. 1978;235 - PubMed
    2. Heart Circ Physiol. 4:H251–H257. - PubMed
    1. Marcus ML, Kerber RE, Erhardt JC, Falsetti HL, Davis DM, Abboud FM. Spatial and temporal heterogeneity of left ventricular perfusion in awake dogs. Am Heart J. 1977;94:748–754. - PubMed

Publication types