. 2017 Jun;55(6):1001-1017.
doi: 10.1007/s11517-016-1561-2. Epub 2016 Sep 24.

A noninvasive swallowing measurement system using a combination of respiratory flow, swallowing sound, and laryngeal motion

Affiliations

A noninvasive swallowing measurement system using a combination of respiratory flow, swallowing sound, and laryngeal motion

Naomi Yagi et al. Med Biol Eng Comput. 2017 Jun.

Abstract

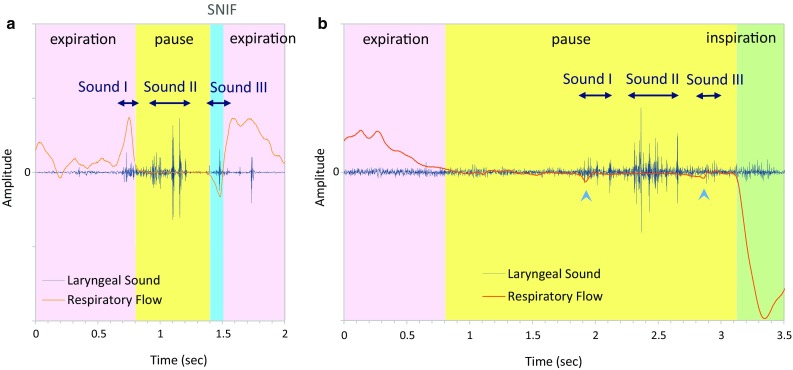
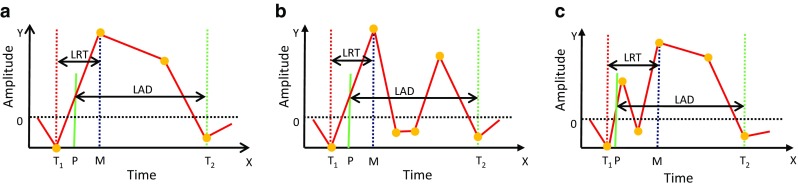
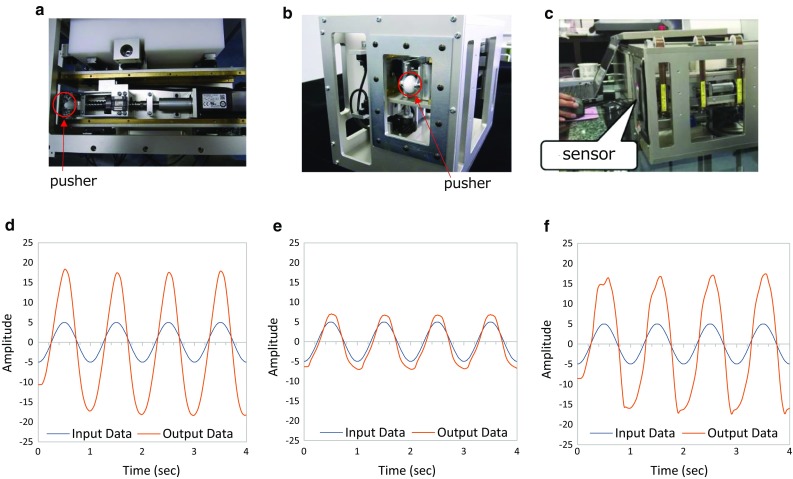
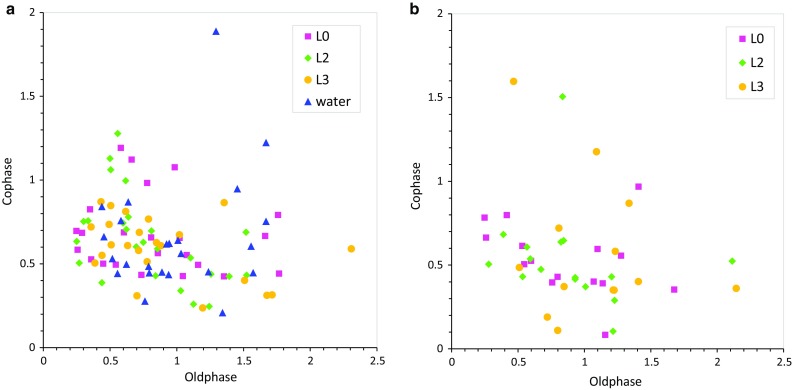
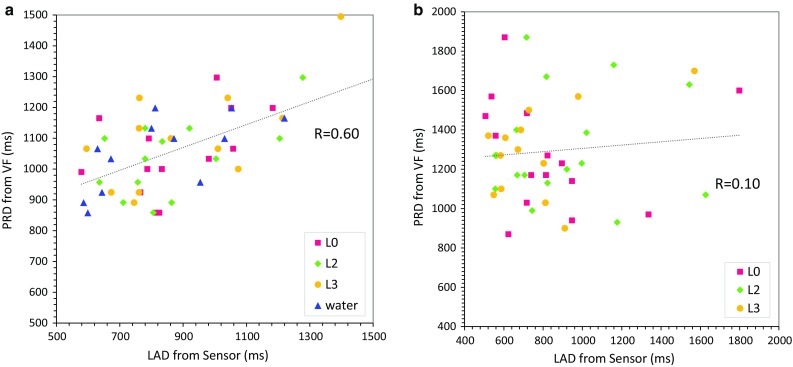
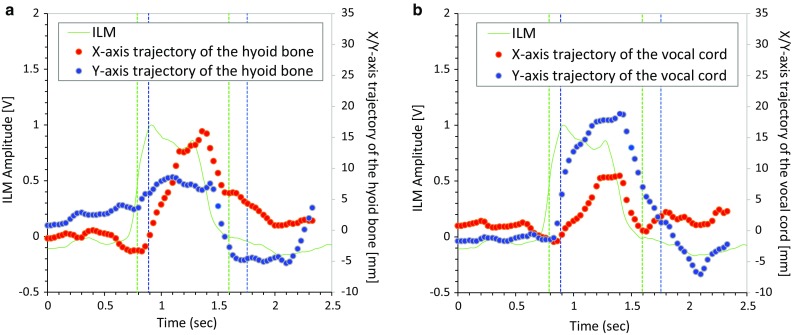
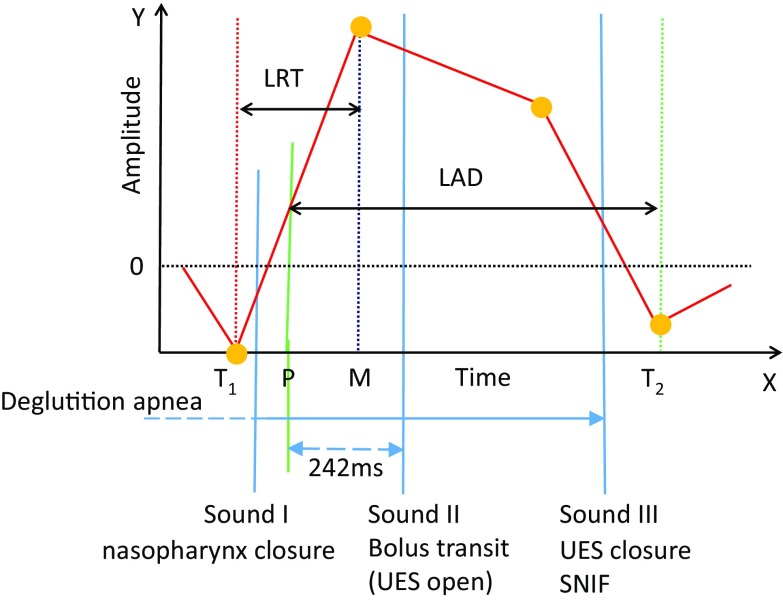
The assessment of swallowing function is important for the prevention of aspiration pneumonia. We developed a new swallowing monitoring system that uses respiratory flow, swallowing sound, and laryngeal motion. We applied this device to 11 healthy volunteers and 10 patients with dysphagia. Videofluoroscopy (VF) was conducted simultaneously with swallowing monitoring using our device. We measured laryngeal rising time (LRT), the time required for the larynx to elevate to the highest position, and laryngeal activation duration (LAD), the duration between the onset of rapid laryngeal elevation and the time when the larynx returned to the lowest position. In addition, we evaluated the coordination between swallowing and breathing. We found that LAD was correlated with a VF-derived parameter, pharyngeal response duration (PRD) in healthy subjects (LAD: 959 ± 259 ms vs. PRD: 1062 ± 149 ms, r = 0.60); however, this correlation was not found in the dysphagia patients. LRT was significantly prolonged in patients (healthy subjects: 320 ± 175 ms vs.

Patients: 465 ± 295 ms, P < 0.001, t test). Furthermore, frequency of swallowing immediately after inspiration was significantly increased in patients. Therefore, the new device may facilitate the assessment of some aspects of swallowing dysfunction.

Keywords: Coordination between swallowing and breathing; Deglutition apnea; Dysphagia; Swallowing.


Conflict of interest statement

This study has been conducted with funding support of Foodcare Co., Ltd. and J Craft Co., Ltd.

Figures

Fig. 1
Fig. 1
Sensor devices. a A nasal cannula-type flow sensor is positioned near the nostril. b A piezoelectric sensor is affixed to the surface of the thyroid cartilage using an adhesive tape
Fig. 2
Fig. 2
Representative swallow–respiratory coordination patterns are presented together with swallowing sounds (Sounds I, II, and III). Light pink zone indicates the expiratory phase, light yellow zone, the pause phase, and light green zone, the inspiratory phase. a Expiration–swallow–expiration pattern. Blue zone represents swallow non-inspiratory flow (SNIF). b Expiration–swallow–inspiration pattern. Note that small negative pressures (arrowheads) are recorded coincident with swallowing sound components
Fig. 3
Fig. 3
Laryngeal sound is decomposed into a the time–frequency domain and b sound pulses
Fig. 4
Fig. 4
Flow chart of the swallowing detection algorithm
Fig. 5
Fig. 5
a Raw sensor output. The program detects the time point P (red line) at which the sensor output reaches the peak during the laryngeal elevation and the zero-cross point is searched backward and forward to identify the start point (the trough T 1 in b) and end point (the maximum M in b) of laryngeal rising time (LRT). b Integrated sensor signal (gray). The green line P corresponds to the position of the highest peak in a, in which the laryngeal elevation speed becomes maximal. The duration between the trough T 1 (solid red line) and the peak M (dashed red line) is the duration of LRT. The duration between the time point P and the trough T 2 is the duration of laryngeal activation duration (LAD)
Fig. 6
Fig. 6
Representative ILM trajectory patterns during swallowing. a Standard monotonous laryngeal elevation activity, b laryngeal activity drops and passes the zero-cross level after reaching the maximal elevation, and c laryngeal activity drops and passes the zero-cross level before reaching the maximal elevation. The duration between the trough T 1 (red dotted line) and the peak M (blue dotted line) is the duration of laryngeal rising time (LRT). The duration between the time point P (at which the laryngeal elevation speed becomes maximal) and the trough T 2 is the duration of laryngeal activation duration (LAD)
Fig. 7
Fig. 7
Swallowing simulator that simulates the forward–backward and the anterior–posterior motion of the thyroid cartilage by two linear actuators. a Simulator top view, b simulator side view, c sensor was placed on the pusher, d forward–backward input data, e anterior–posterior input data, f combination input data
Fig. 8
Fig. 8
Phase–response curve (co-phase plot) showing how the respiratory rhythm is reset by swallowing events depending on the timing of swallowing. I–SW represents a case where a swallow occurred during inspiration, and SW–I represents a case where a swallow was followed by inspiration. a Healthy subjects, b patients. One outlier (old phase = 5.85, co-phase = 0.70, L0) is not plotted
Fig. 9
Fig. 9
Comparison between laryngeal activation duration (LAD and pharyngeal response duration (PRD). a Healthy subjects, b patients
Fig. 10
Fig. 10
Comparison of integrated laryngeal motion (ILM) signal and trajectories of the hyoid bone (a) and the vocal cord (b) tracked from videofluoroscopy (VF) images. In each panel, the blue dots are the X-axis trajectory, the red dots represent the Y-axis trajectory, and the green line is ILM by our monitor device. Start point and end points of laryngeal activation duration (LAD) and pharyngeal response duration (PRD) are shown in green and blue vertical lines, respectively
Fig. 11
Fig. 11
Timing histogram showing when integrated laryngeal motion (ILM) (the laryngeal position) returns to the trough relative to the deglutition apnea. a Healthy subjects, b patients
Fig. 12
Fig. 12
Positions of swallowing sound components and our speculation of their origins

References

    1. Aboofazeli M, Moussavi Z. Automated classification of swallowing and breadth sounds. Conf Proc IEEE Eng Med Biol Soc. 2004;5:3816–3819. - PubMed
    1. Bautista TG, Dutschmann M. Ponto-medullary nuclei involved in the generation of sequential pharyngeal swallowing and concomitant protective laryngeal adduction in situ. J Physiol. 2014;592:2605–2623. doi: 10.1113/jphysiol.2014.272468. - DOI - PMC - PubMed
    1. Brodsky MB, McFarland DH, Michel Y, Orr SB, Martin-Harris B. Significance of nonrespiratory airflow during swallowing. Dysphagia. 2012;27:178–184. doi: 10.1007/s00455-011-9350-4. - DOI - PMC - PubMed
    1. Cassiani RA, Santos CM, Baddini-Martinez J, Dantas RO. Oral and pharyngeal bolus transit in patients with chronic obstructive pulmonary disease. Int J Chronic Obstr. 2015;10:489–496. - PMC - PubMed
    1. Crary MA, Sura L, Carnaby G. Validation and demonstration of an isolated acoustic recording technique to estimate spontaneous swallow frequency. Dysphagia. 2013;28:86–94. doi: 10.1007/s00455-012-9416-y. - DOI - PubMed