. 2016 Sep 26:6:33707.
doi: 10.1038/srep33707.

Evaluating the performance of infectious disease forecasts: A comparison of climate-driven and seasonal dengue forecasts for Mexico

Affiliations

Evaluating the performance of infectious disease forecasts: A comparison of climate-driven and seasonal dengue forecasts for Mexico

Michael A Johansson et al. Sci Rep. .

Abstract

Dengue viruses, which infect millions of people per year worldwide, cause large epidemics that strain healthcare systems. Despite diverse efforts to develop forecasting tools including autoregressive time series, climate-driven statistical, and mechanistic biological models, little work has been done to understand the contribution of different components to improved prediction. We developed a framework to assess and compare dengue forecasts produced from different types of models and evaluated the performance of seasonal autoregressive models with and without climate variables for forecasting dengue incidence in Mexico. Climate data did not significantly improve the predictive power of seasonal autoregressive models. Short-term and seasonal autocorrelation were key to improving short-term and long-term forecasts, respectively. Seasonal autoregressive models captured a substantial amount of dengue variability, but better models are needed to improve dengue forecasting. This framework contributes to the sparse literature of infectious disease prediction model evaluation, using state-of-the-art validation techniques such as out-of-sample testing and comparison to an appropriate reference model.


Figures
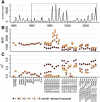
Figure 1
Figure 1. National-level forecast metrics.
National-level incidence is shown during the training period (1985–1989) and evaluation period (1990–2007). (A) For each of 39 models considered, the MAE (B) and R2 (C) values for prospective forecasts over the entire evaluation period are shown for each prediction horizon (dark red to yellow, corresponds to 1–6 months). For models including lagged weather covariates, forecasts were not possible at prediction horizons beyond the lag and are not shown. An equivalent plot for each state is shown in Figure S1.
Figure 2
Figure 2. Map of included states.
States with median monthly incidence greater than zero during the training and development periods (1985–2007) were selected for forecasting model development (labeled). This figure was produced using the statistical computing environment R, version 3.2.3 (http://www.R-project.org).
Figure 3
Figure 3. Forecasting metrics for all models in Mexico and 17 Mexican states.
MAE (A) and R2 (B) values are shown for each of 39 models at every prediction horizon (grey lines). The optimum local (red, dashed) and common (blue, solid) models are superimposed. Full detail for all models is shown in Fig. 1 for all of Mexico and Figure S1 for each state.
Figure 4
Figure 4. Prospective prediction evaluation over the 5-year validation period (2008–2012).
The local (red) and common (blue) 3-month ahead forecasts are compared to reported dengue incidence (black, dashed lines) (A). The relative MAE compares the local model (red) to the common model (blue) over the entire 5-year validation period for individual locations (B). Values less than one indicate decreased error, i.e. improved performance, of the local model relative to the common model. Across all locations the number of locations in which the local model is more accurate than the common model declines at increasing prediction horizons (C) (red = local, blue = common, grey = the local and common models are the same). The relative MAE over all locations for the local model increases at longer prediction horizons.
Figure 5
Figure 5. Prospective predictions with uncertainty.
Forecasts from the national (1,0,0)(3,1,0)12 model with 95% Confidence Intervals are compared to reported dengue incidence (black, dashed lines). The (1,0,0)(2,1,0)12 model and models for each state are shown in Figure S2.
Figure 6
Figure 6. Prediction horizons.
The relative MAEs compared to the constant model (grey line) are shown in transparent lines for all locations at all prediction horizons. Models including only weather covariates are shown in orange, models containing only short-term autocorrelation are shown in red, and models containing both short-term autocorrelation and seasonality (using weather variables or seasonal autocorrelation) are shown in blue. The average relative MAE across all locations is shown in solid lines for four key representative models.

References

    1. Brady O. J. et al. Refining the global spatial limits of dengue virus transmission by evidence-based consensus. PLoS Negl Trop Dis 6, e1760, 10.1371/journal.pntd.0001760 (2012). - DOI - PMC - PubMed
    1. Mexico Secretariat of Health. Anuarios de Morbilidad, http://www.epidemiologia.salud.gob.mx/anuario/html/anuarios.html (accessed on May 1st, 2013).
    1. Beatty M. E. et al. Best practices in dengue surveillance: a report from the Asia-Pacific and Americas Dengue Prevention Boards. PLoS Negl Trop Dis 4, e890, 10.1371/journal.pntd.0000890 (2010). - DOI - PMC - PubMed
    1. Racloz V., Ramsey R., Tong S. & Hu W. Surveillance of dengue fever virus: a review of epidemiological models and early warning systems. PLoS Negl Trop Dis 6, e1648, 10.1371/journal.pntd.0001648 (2012). - DOI - PMC - PubMed
    1. Johansson M. A., Hombach J. & Cummings D. A. Models of the impact of dengue vaccines: a review of current research and potential approaches. Vaccine 29, 5860–5868, S0264-410X(11)00906-6 [pii]. 10.1016/j.vaccine.2011.06.042 (2011). - DOI - PMC - PubMed

LinkOut - more resources