. 2016 Sep 26:7:12848.
doi: 10.1038/ncomms12848.

The RNA-binding protein vigilin regulates VLDL secretion through modulation of Apob mRNA translation

Affiliations

The RNA-binding protein vigilin regulates VLDL secretion through modulation of Apob mRNA translation

Mehrpouya B Mobin et al. Nat Commun. .

Abstract

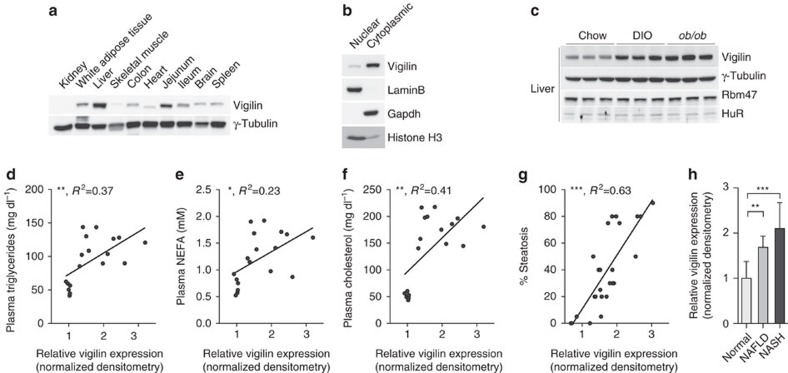
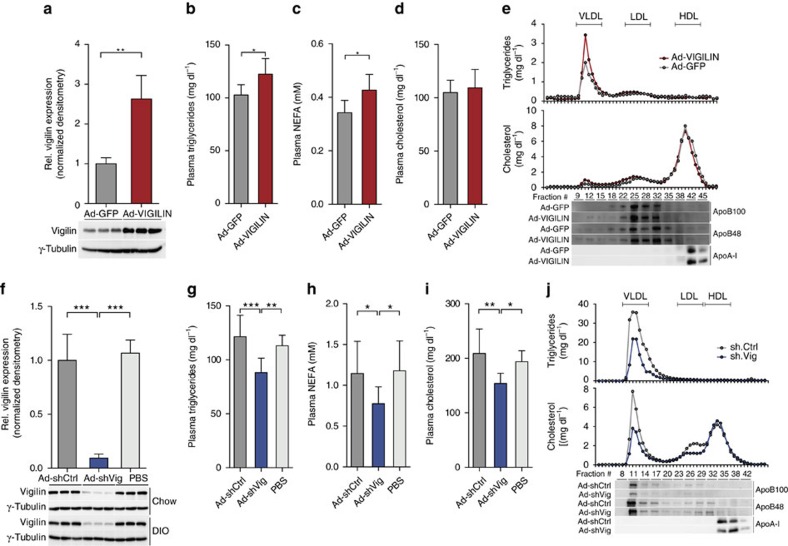
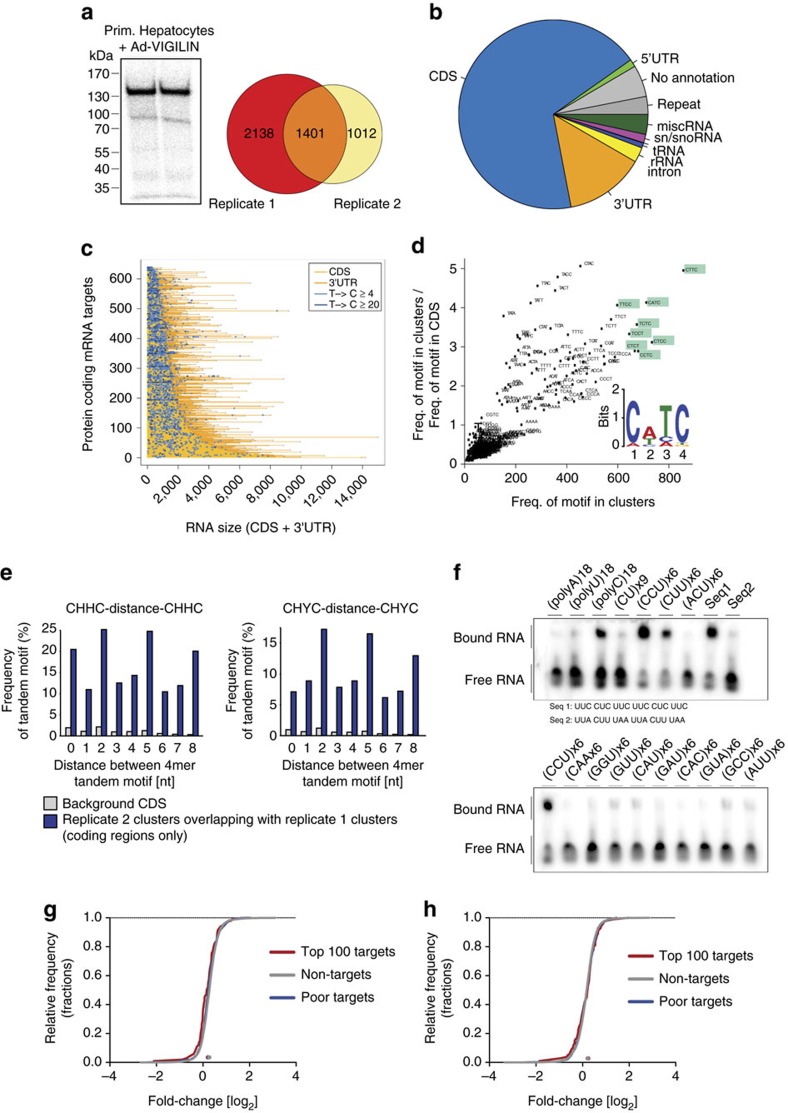
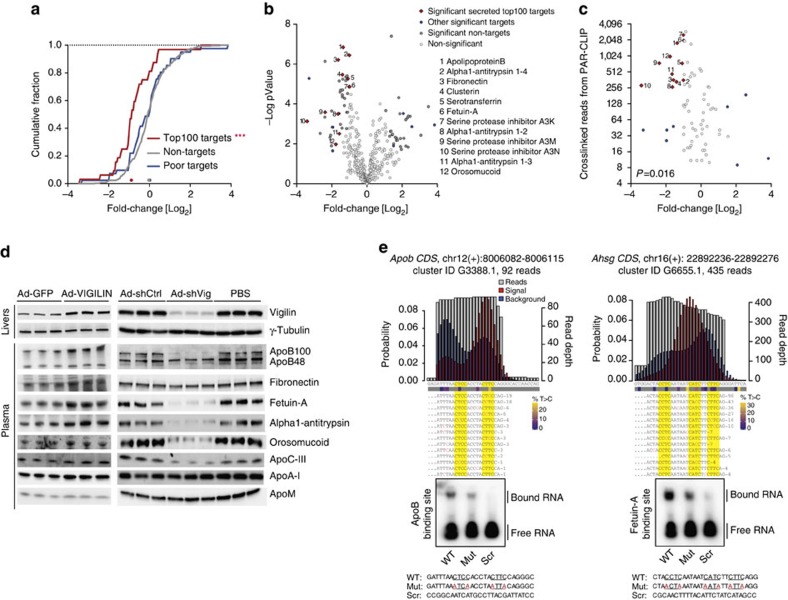
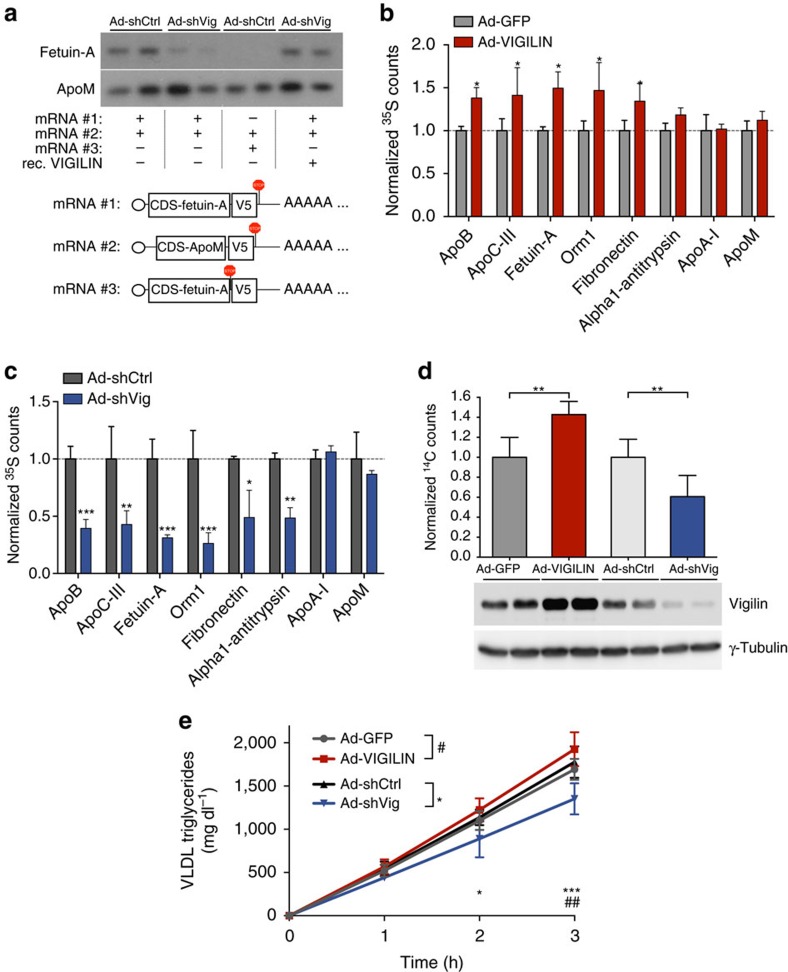
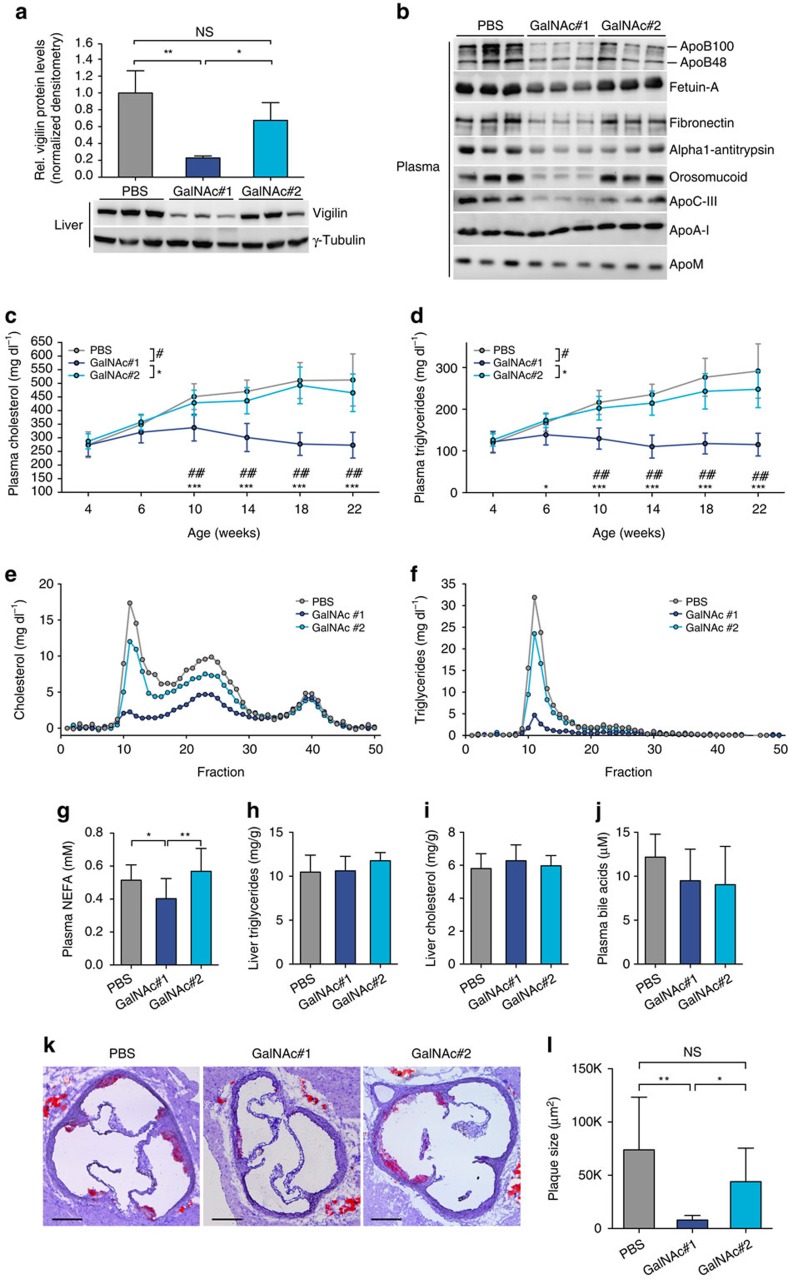
The liver is essential for the synthesis of plasma proteins and integration of lipid metabolism. While the role of transcriptional networks in these processes is increasingly understood, less is known about post-transcriptional control of gene expression by RNA-binding proteins (RBPs). Here, we show that the RBP vigilin is upregulated in livers of obese mice and in patients with fatty liver disease. By using in vivo, biochemical and genomic approaches, we demonstrate that vigilin controls very-low-density lipoprotein (VLDL) secretion through the modulation of apolipoproteinB/Apob mRNA translation. Crosslinking studies reveal that vigilin binds to CU-rich regions in the mRNA coding sequence of Apob and other proatherogenic secreted proteins, including apolipoproteinC-III/Apoc3 and fibronectin/Fn1. Consequently, hepatic vigilin knockdown decreases VLDL/low-density lipoprotein (LDL) levels and formation of atherosclerotic plaques in Ldlr-/- mice. These studies uncover a role for vigilin as a key regulator of hepatic Apob translation and demonstrate the therapeutic potential of inhibiting vigilin for cardiovascular diseases.


Conflict of interest statement

M.S. and T.T. are members of the Scientific Advisory Board and M.M. and K.C. are employees of Alnylam Pharmaceuticals. The other authors declare no competing financial interests.

Figures

Figure 1
Figure 1. Correlation of vigilin levels with liver steatosis and plasma lipid levels.
(a) Western blot analysis of vigilin in mouse tissues. (b) Nuclear and cytoplasmic fractions from primary mouse hepatocytes. (c) Immunoblot analysis of hepatic vigilin levels in 20-week-old chow-fed (Chow) or high-fat diet C57BL/6 (DIO) and in 23 week old ob/ob mice. Correlation between hepatic vigilin expression quantified by densitometry from c (n=6 per group) and (d) plasma triglyceride, (e) non-esterified fatty acid (NEFA) and (f) cholesterol levels. Correlation between (g) degree of hepatic steatosis and (h) clinical/histological diagnosis with hepatic vigilin expression quantified by immunoblotting and densitometry from human liver biopsies, including 5 healthy, 10 non-alcoholic fatty liver disease (NAFLD) and 10 non-alcoholic steatohepatitis (NASH) patients. Values in h are expressed as mean±s.d. *P≤0.05, **P≤0.01, ***P≤0.001; P values and R2 were determined by two-tailed Pearson's correlation test (in dg) or ANOVA with Holm-Sidak post hoc analysis (in h).
Figure 2
Figure 2. Hepatic modulation of vigilin regulates lipid metabolism.
(a) Relative expression of vigilin in livers of 8–10-week-old C57BL/6 mice injected with Ad-GFP or Ad-VIGILIN (n=5 per group). Values are relative densitometric readouts normalized to γ-tubulin. (b) Plasma triglyceride, (c) NEFA and (d) cholesterol levels of mice from a. (e) Plasma from mice injected with Ad-GFP or Ad-VIGILIN was fractionated into very-low-density lipoprotein (VLDL), low density lipoprotein (LDL) and high density lipoprotein (HDL) particles and quantified through measurements of triglyceride and cholesterol levels in each fraction and used for western blot analysis of VLDL/LDL (apoB48/100) as well as HDL (apoA-I) markers. (f) Relative expression of vigilin in livers of 10-week-old chow-fed and 20-week-old high-fed diet C57BL/6 mice (DIO) with Ad-shCtrl (n=6 for WT, n=8 for DIO), Ad-shVig (n=6 for WT, n=8 for DIO) or PBS (n=3 for WT, n=5 for DIO). Values are relative densitometric readouts normalized to γ-tubulin. (g) Plasma triglyceride, (h) NEFA and (i) cholesterol levels of DIO mice treated as in f. (j) Plasma from DIO mice injected with Ad-shCtrl or Ad-shVig was fractionated into VLDL/LDL/HDL particles and quantified as in e. All values are expressed as mean±s.d. *P≤0.05, **P≤0.01, ***P≤0.001; P values were determined by student's t-test (in ad) or ANOVA with Holm-Sidak post hoc analysis (in fi).
Figure 3
Figure 3. Vigilin binds to CU-rich sequences in the CDS.
(a) Autoradiograph of crosslinked, 32P-labelled, VIGILIN–RNA immunoprecipitate separated by SDS–PAGE after PAR-CLIP and overlap of binding sites for the two biological replicates. (b) Distribution of PAR-CLIP binding sites (overlap of replicates) identified by PARalyzer in various RNA-species; (c) distribution of T-to-C reads along the CDS and 3′UTRs of mRNA targets. Bright (≥4 reads) and dark blue (≥20 reads) dots indicate positions of T-to-C reads along the transcripts. (d) kmer-plot and sequence logo representation of the vigilin RRE derived from PAR-CLIP binding sites: CHHC and CHYC (H=A/C/U; Y=C/U). (e) Enrichment analysis of vigilin PAR-CLIP clusters for tandem arranged RREs, previously derived from d, which are separated by 0–8 nt-long spacers. Background sequences are shuffled mouse CDS sequences. (f) Electrophoretic Mobility Shift Assays (EMSAs) validated affinity of vigilin to CU-rich sequences: synthetic RNAs representing 18-nt di- or tri-nucleotide repeats were radiolabeled (10 nM), incubated with 2 μM His6-tagged recombinant human Vigilin and separated on 1% agarose gel. (g,h) Steady-state mRNA expression changes in livers of mice in which Vigilin was overexpressed using Ad-VIGILIN and compared with Ad-GFP (g) and livers of mice in which vigilin was silenced using Ad-shVig and compared to Ad-shCtrl (h) were determined by RNA-seq. Plotted is the empirical cumulative distribution function of vigilin PAR-CLIP targets (coloured lines) compared with expressed non-targets (FPKM≥2, black and grey lines). Separately shown are the top 100 PAR-CLIP targets (based on cumulative crosslinked reads, red line), poor targets (remaining targets, blue line) and non-targets (not crosslinked in both PAR-CLIP replicates, grey line). The median transcript abundance change is indicated by a dot on the x axis.
Figure 4
Figure 4. Vigilin controls levels of secretory proatherogenic proteins.
Secretome of primary hepatocytes isolated from 10-week-old mice injected with either Ad-shCtrl or Ad-shVig (n=8 per group; four biological replicates with each two technical replicates) was collected from the medium and quantified using label-free mass spectrometry (MS-LFQ). (a) Cumulative distribution function plot displaying fold-changes in secretion upon knockdown of vigilin in primary hepatocytes of top 100 PAR-CLIP targets (based on cumulative crosslinked reads, red line), poor targets (remaining targets, blue line) and non-targets (not crosslinked in both PAR-CLIP replicates, grey line). (b) Volcano plot of differentially secreted proteins upon vigilin knockdown in primary hepatocytes. x axis: Log2 fold-change of intensities, y axis: -Log10 P values. Significant hits among secreted top 100 PAR-CLIP targets (based on T-to-C counts) are indicated in red dots, other significant targets in blue, non-targets and non-significant hits in grey. Significance was determined using false discovery rate (FDR)-corrected (FDR=0.01), permutation-based multiple t-tests (250 ×) and curve bend s0=0.5. (c) Plot of differentially secreted PAR-CLIP targets (x axis) against T-to-C reads (y axis) indicates downregulation of more frequently bound targets. Significance was determined by Pearson's correlation test. (d) In vivo validation of MS-LFQ data through side-by-side immunoblot analysis of six targets from blood plasma of mice upon gain- (left panel: Ad-GFP and Ad-VIGILIN) and loss-of-function (Ad-shCtrl, Ad-shVig and PBS) from Fig. 2. (e) VIGILIN EMSAs representing binding sites on apoB and fetuin-A mRNAs identified by PAR-CLIP. Upper panel: alignment of vigilin PAR-CLIP sequence reads to gene loci of Apob and Ahsg (fetuin-A) mRNA CDS'. RREs are highlighted in yellow. The kernel density of T-to-C (T>C) transitions detected in PAR-CLIP reads is shown in red bars, the T-to-C conversion probability density of the cluster sequence is shown in blue bars. The read depth of the cluster is shown in grey. The percentage change of T-to-C transitions is indicated below the nucleotide sequence on a colour scale from blue to yellow. Lower panel: autoradiograph of EMSAs performed using binding site sequences identified by PAR-CLIP, mutated RREs (indicated in red) and scrambled sequences of these sites. The RNA sequences are indicated below.
Figure 5
Figure 5. Vigilin enhances translation of its mRNA targets and lipid secretion.
(a) Autoradiograph of in vitro translation assays using fresh liver extracts from Ad-shCtrl or Ad-shVig-injected mice (n=2 per group). Synthetic mRNAs (scheme indicated in lower panel) of fetuin-A and apoM (as control for non-target) were translated into V5-tagged and [35S]-methionine/cysteine radiolabelled protein, immunoprecipitated and separated by SDS–PAGE. Fetuin-A mRNA with premature stop-codon before C-terminal V5-tag (#3) was used as a negative control for immunoprecipitation. (b,c) 35S counts from metabolic labeling and immunoprecipitation of hepatic vigilin targets upon (b) overexpression (c) silencing of vigilin. Primary hepatocytes from mice injected with either Ad-VIGILIN (control: Ad-GFP) or Ad-shVig (control: Ad-shCtrl) were pulse-chased with [35S]-methionine/cysteine prior to immunoprecipitation of radiolabeled protein using target-specific antibodies and quantification via scintillation counting. Two biological and four technical replicates were used for each group. (d) 14C counts of radiolabeled palmitic acid incorporated into triglycerides and secreted into the medium by primary hepatocytes upon knockdown of vigilin. Primary hepatocytes were isolated from C57BL/6 mice injected with either Ad-GFP versus Ad-VIGILIN (for gain-of-function) or Ad-shCtrl versus Ad-shVig (for loss-of-function) and pulse-chased with 14C-labelled palmitic acid for incorporation into triglycerides. Lipids from the medium were extracted and quantified using 14C scintillation counting. Values are normalized relative counts in bd. (e) VLDL triglyceride secretion assay in 8-week-old mice upon overexpression (Ad-VIGILIN; n=6) or knockdown (Ad-shVig; n=6) of hepatic vigilin protein. Animals received an intravenous injection of 500 mg kg−1 tyloxapol to block lipases. Blood was collected at indicated time points and measured for plasma triglyceride accumulation. All values are expressed as mean±s.d. *P≤0.05, **P≤0.01, ***P≤0.001; P values were determined by student's t-test (in bd) or ANOVA with Tukey's post hoc analysis (in e).
Figure 6
Figure 6. Knockdown of hepatic vigilin reduces atherosclerotic plaque formation.
(a) Quantification of hepatic vigilin knockdown in male Ldlr−/− mice with weekly injections of two different GalNAc-conjugated siRNAs targeting vigilin (siVig-GalNAc#1: n=10, siVig-GalNAc#2: n=10) or PBS (n=9) for 18 weeks starting at 4 weeks of age. Values are shown relative to PBS-injected control mice. (b) Immunoblot analysis of vigilin targets from blood plasma. ApoM and apoA-I were used as loading controls. Time course of plasma (c) cholesterol and (d) triglyceride levels throughout treatment period. Fractionated blood plasma from treated mice indicating VLDL, LDL and HDL particles that were quantified through (e) cholesterol and (f) triglyceride levels in each fraction. Quantification of (g) plasma NEFA, (h) hepatic triglyceride and (i) cholesterol levels. (j) Quantification of plasma bile acid levels. (k,l) Characterization of atherosclerosis in mice from a. (k) Representative oil red O-stained aortic root sections and (l) quantification of the lesion areas. Scale bar, 200 μm. *P<0.05, **P<0.01 and #P<0.05, ##P<0.01, ###P<0.001 determined by ANOVA with Tukey's (in c and d) or Holm-Sidak (in a, gj) post hoc analysis. All data are shown as the mean±s.d.

Similar articles

Cited by

References

    1. McKnight G. L. et al. Cloning and expression of a cellular high density lipoprotein-binding protein that is up-regulated by cholesterol loading of cells. J. Biol. Chem. 267, 12131–12141 (1992). - PubMed
    1. Schmidt C. et al. Complete cDNA sequence of chicken vigilin, a novel protein with amplified and evolutionary conserved domains. Eur. J. Biochem. 206, 625–634 (1992). - PubMed
    1. Burd C. G. & Dreyfuss G. Conserved structures and diversity of functions of RNA-binding proteins. Science 265, 615–621 (1994). - PubMed
    1. Dejgaard K. & Leffers H. Characterisation of the nucleic-acid-binding activity of KH domains. Different properties of different domains. Eur. J. Biochem. 241, 425–431 (1996). - PubMed
    1. Dodson R. E. & Shapiro D. J. Vigilin, a ubiquitous protein with 14 K homology domains, is the estrogen-inducible vitellogenin mRNA 3'-untranslated region-binding protein. J. Biol. Chem. 272, 12249–12252 (1997). - PubMed