. 2016 Dec 1;19(6):768-783.
doi: 10.1016/j.stem.2016.08.013. Epub 2016 Sep 22.

A Transient Developmental Hematopoietic Stem Cell Gives Rise to Innate-like B and T Cells

Affiliations

A Transient Developmental Hematopoietic Stem Cell Gives Rise to Innate-like B and T Cells

Anna E Beaudin et al. Cell Stem Cell. .

Abstract

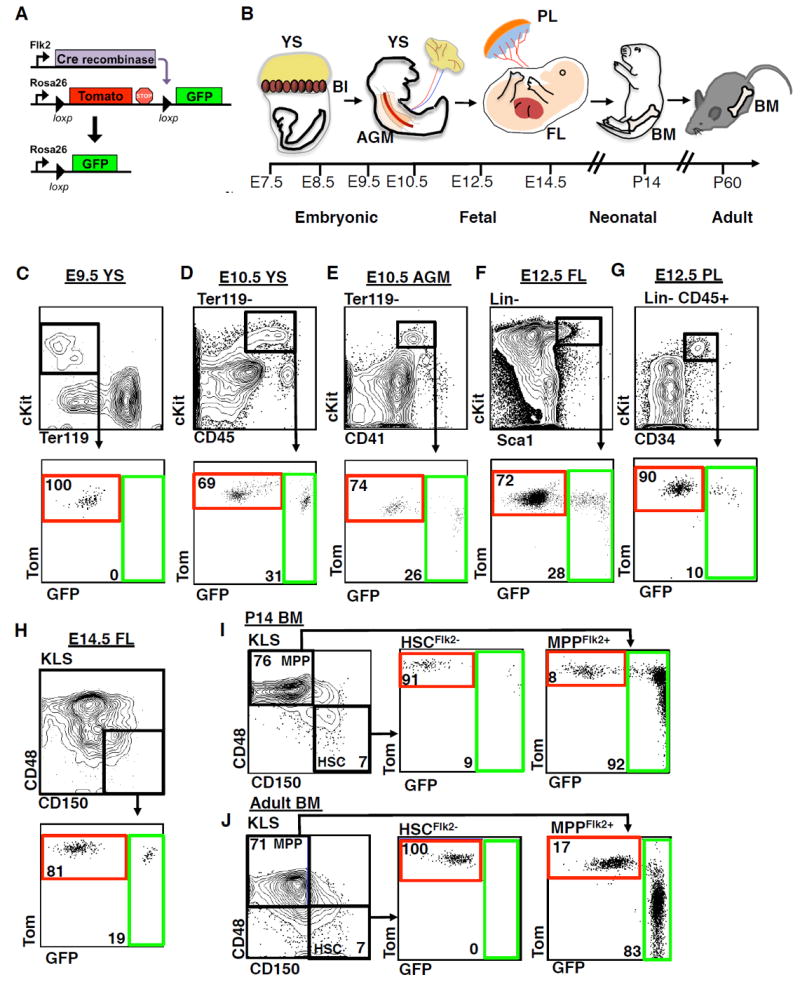
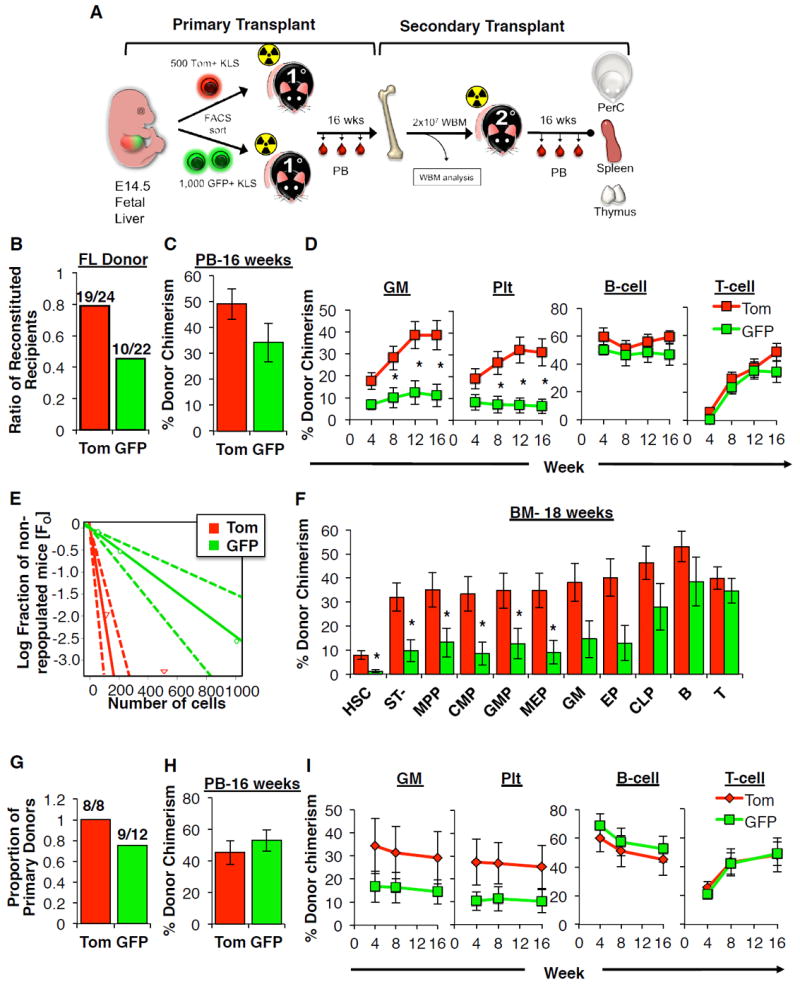
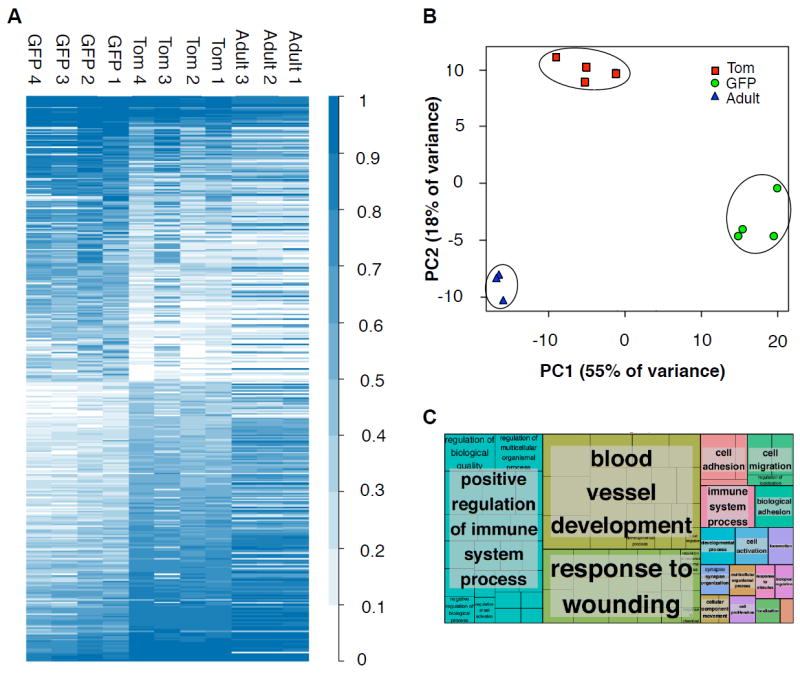
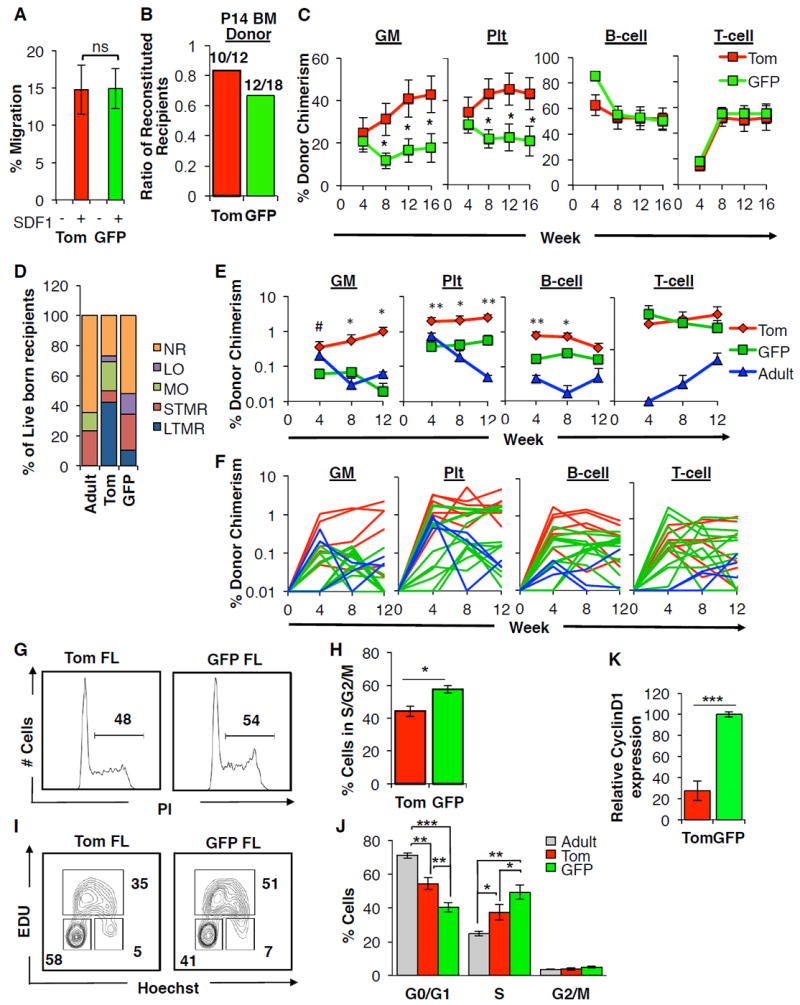
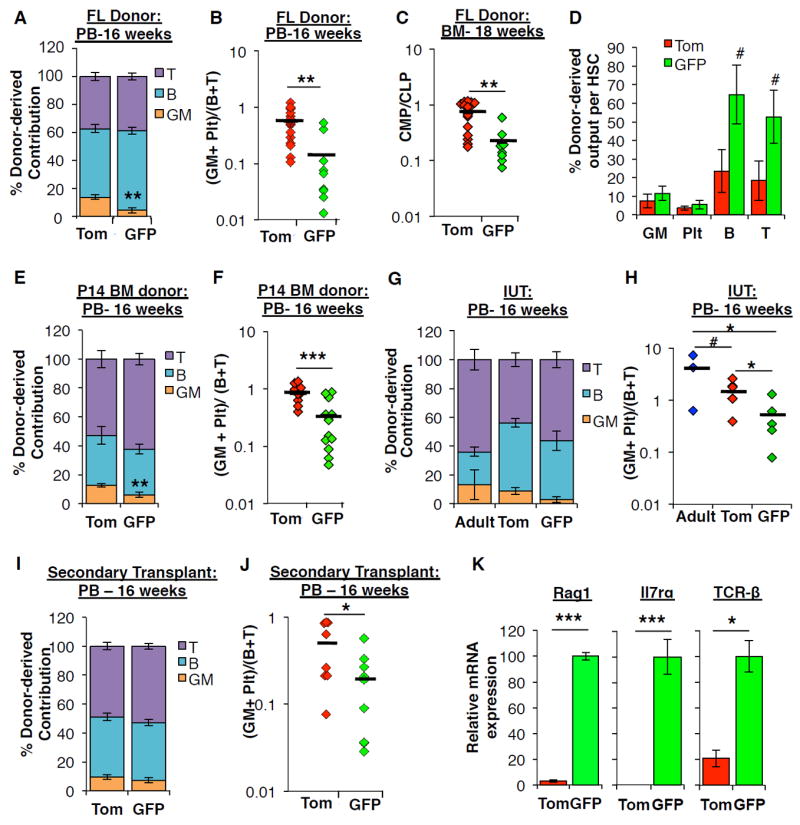
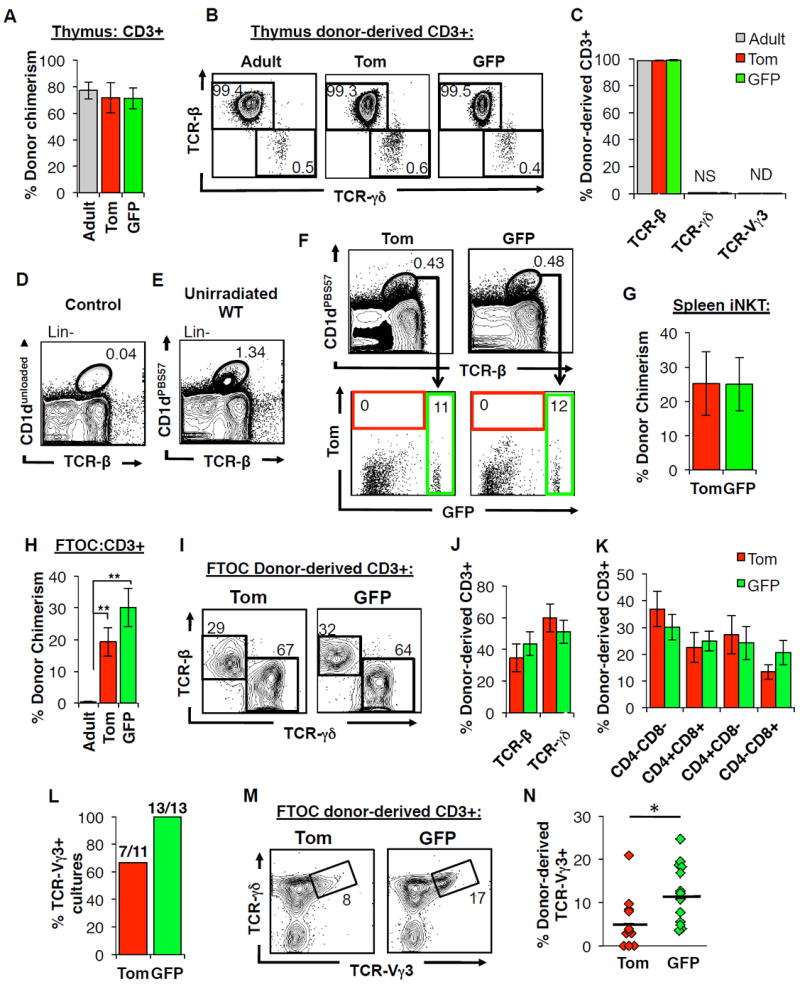
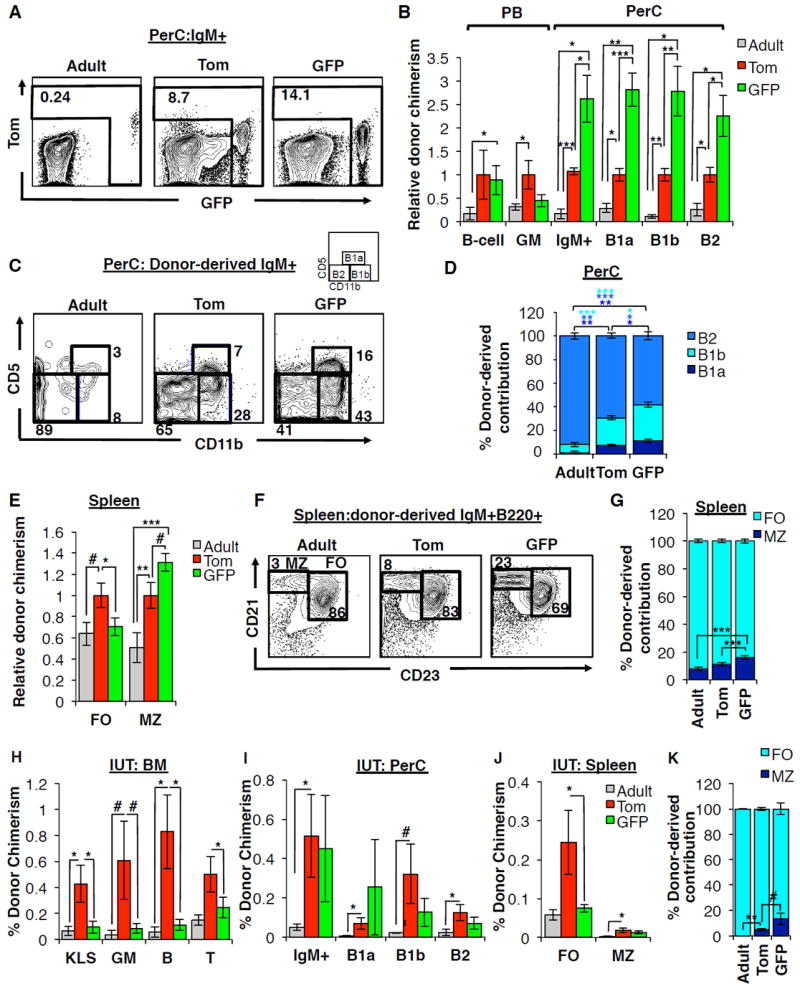
The generation of distinct hematopoietic cell types, including tissue-resident immune cells, distinguishes fetal from adult hematopoiesis. However, the mechanisms underlying differential cell production to generate a layered immune system during hematopoietic development are unclear. Using an irreversible lineage-tracing model, we identify a definitive hematopoietic stem cell (HSC) that supports long-term multilineage reconstitution upon transplantation into adult recipients but does not persist into adulthood in situ. These HSCs are fully multipotent, yet they display both higher lymphoid cell production and greater capacity to generate innate-like B and T lymphocytes as compared to coexisting fetal HSCs and adult HSCs. Thus, these developmentally restricted HSCs (drHSCs) define the origin and generation of early lymphoid cells that play essential roles in establishing self-recognition and tolerance, with important implications for understanding autoimmune disease, allergy, and rejection of transplanted organs.

Keywords: development; hematopoiesis; hematopoietic stem cell; immune cells; innate-like B and T lymphocytes; lineage potential; lineage tracing; self-renewal; tissue resident; transplantation.


Conflict of interest statement

Conflicts of interest: The authors have no conflicts to declare.

Figures

Figure 1
Figure 1. GFP+ cells coexist with Tom+ cells in fetal stem and progenitor compartments in FlkSwitch mice
A, Strategy for generation of the FlkSwitch lineage tracing mouse model. Flk2-driven Cre expression leads an irreversible switch from Tomato to GFP expression in Flk2-expressing cells and their progeny. B, Chronological depiction of developmental hematopoiesis. Primitive hematopoiesis initiates in the blood islands (BI) of the early embryonic yolk sac (YS). Definitive hematopoiesis occurs in the aorta-gonad-mesonephros region (AGM), the placenta (PL), and the fetal liver (FL) in the mid-gestation embryo. Late fetal hematopoiesis occurs primarily in the FL. The bone marrow (BM) becomes the main site of HSC residence at birth, where they persist throughout life. C-H, Phenotypic stem and progenitor populations from E10.5-14.5 contain both Tom+ and GFP+ cells. Plots depict flow cytometric analysis of reporter activity within the hematopoietic stem cell- and progenitor-enriched compartments of the YS at E9.5 (C); the YS (D) and AGM (E) at E10.5; the FL (F) and PL (G) at E12.5; and the FL at E14.5 (H) in FlkSwitch embryos. Top row depicts gating strategy for stem and progenitor cell compartments. Bottom row depicts reporter gene fluorescence profiles of cells within gated regions shown above. I and J, A fraction of neonatal HSCs express GFP, whereas all adult HSCs express Tom. Flow cytometric analysis of reporter activity in the P14 (I) and adult (J) BM. Plots (left) indicate the gating strategies used to define HSCs (c-kit+Lineage-Sca1+ Flk2-CD150+ CD48- BM cells) and multipotent progenitors (MPPs; KLS Flk2+CD150- CD48+ BM cells). See also Figure S1.
Figure 2
Figure 2. Both Tom+ and GFP+ fetal HSCs possess serial reconstitution potential
A, Schematic of the experimental approach for primary and secondary transplantation and analyses. Sublethally-irradiated primary recipients were transplanted with Tom+ (500 cells) or GFP+ (1000 cells) FL KLS cells isolated from FlkSwitch fetal mice. Donor-derived chimerism was monitored in the peripheral blood (PB) over 16 weeks. After 18 weeks WBM cells from individual primary donors were transplanted into lethally irradiated secondary recipients. Chimerism was determined in the blood, peritoneal cavity (PerC), spleen, and thymus after 16 weeks in secondary recipients. B, Proportion of primary recipients exhibiting long-term multilineage reconstitution (LTMR) following transplantation of Tom+ or GFP+ FL KLS cells. LTMR was defined as reconstitution > 0.1% in all four lineages over 16 weeks. See also Table S1. C, Total white blood cell (WBC) contribution to the PB 16 weeks post-transplantation in primary recipients exhibiting LTMR. N=10-19 recipient mice in 4 independent experiments. Data are mean±SEM. D, Peripheral blood (PB) contribution by Tom+ or GFP+ FL KLS cells to the granulocyte/monocyte (GM), platelet (Plt), B220+ B-cell and CD3+ T-cell lineages in the same mice from (C). Data are mean±SEM. *P<0.05. E, Limiting dilution analysis was performed by competitive transplantation of three doses of Tom+ (500, 100, or 25) or GFP+ (1000, 200, or 50) FL KLS cells into lethally-irradiated hosts. Data are shown as the log fraction of non-engrafted (non-repopulated) mice plotted on the y axis versus the transplanted cell dose on the x axis. ELDA software (http://bioinf.wehi.edu.au/software/elda/) was used to determine HSC frequency (color-coded in bold) and assess statistical significance. F, Donor chimerism of stem, progenitor and mature cells in the bone marrow (BM) 18 weeks post-transplantation in the mice from (D). Cell populations are defined in the online methods. G, Proportion of primary donors that gave rise to LTMR in at least one secondary recipient after secondary transplantation. See also Table S2. H, Total WBC donor chimerism in the PB in mice exhibiting LTMR over 16 weeks after secondary transplantation. N=21-22 recipients per cell type in 4 independent experiments. Data are mean±SEM. I, PB contribution of donor-derived cells to GM, Plt, B-cell, and T-cell lineages over 16 weeks post-transplantation in mice from (H). See also Figures S2, S3, S4, S5, and Tables S1 and S2.
Figure 3
Figure 3. RNA-seq analysis reveals distinct molecular profile of GFP+ fetal HSCs
A, Heat map analysis of 398 genes differentially expressed between Tom+ and GFP+ FL HSCs reveals a unique molecular signature of GFP+ HSCs. Values indicated in the color intensity scale indicate deciles of RKPM values. B, Principal component analysis (PCA)-based comparison of Tom+ and GFP+ fetal HSCs and adult HSCs based on the expression of 398 genes described in A reveals clustering of GFP+ and Tom+ fetal HSCs and adult HSCs. C, “Treemap” view of GO enrichment term analysis of the same genes described in (A). Each rectangle is a single cluster representative of enriched GO terms, and representatives are joined into “superclusters” of loosely related terms, visualized with different colors. Box size is proportionate to significance values. See also Table S3.
Figure 4
Figure 4. Cell-extrinsic and cell-intrinsic mechanisms limit the developmental window of the GFP+ HSC
A-C, GFP+ fetal HSCs are capable of migration and seeding of the neonate BM. A, The percentage of Tom+ or GFP+ CD150+ FL KLS cells that migrated towards an SDF1 gradient in vitro. Data are mean±SEM from 4 independent experiments performed in triplicate. ns, not significant. B, Proportion of mice exhibiting LTMR following transplantation of either 500 Tom+ or 2000 GFP+ neonate KLS cells. Cells were isolated from the P14 BM of FlkSwitch mice and transplanted into sublethally irradiated WT recipients. C, Peripheral blood (PB) contribution by Tom+ or GFP+ P14 BM KLS cells to the GM, Plt, B220+ B-cell and CD3+ T-cell lineages in mice exhibiting LTMR over 16 weeks post-transplantation. N=10-12 recipient mice in 3 independent experiments. Data are mean±SEM. *P<0.05. D-F, GFP+ fetal HSCs display limited long-term engraftment following in utero transplantation. D, The percentage of live-born recipients of Tom+ or GFP+ FL or adult KLS cells transplanted in utero into the FL of WT embryos at E14.5. Live-born recipients were classified on the basis of donor-derived chimerism within the GM, Plt, B220+ B-cell and CD3+ T-cell lineages over 12 weeks post-birth as non-reconstituted (NR), or demonstrating myeloid only (MO), lymphoid only (LO), or short-term or long-term multilineage reconstitution (STMR, LTMR). See also Table S4. E, Peripheral blood (PB) contribution by Tom+ or GFP+ FL or adult KLS cells to GM, Plt, B-cell, and T-cell lineages over 12 weeks post-birth following in utero transplantation in recipient mice exhibiting STMR or LTMR as described in (D). Data are mean±SEM. #P< 0.1; *P<0.05; **P<0.01 for statistical differences between Tom+ and GFP+ FL populations. F, PB chimerism in individual recipients of Tom+ or GFP+ FL or adult KLS cells to GM, Plt, B-cell, and T-cell lineages over 12 weeks following in utero transplantation in mice demonstrating STMR or LTMR as described in (D). This panel displays the reconstitution of individual mice that were shown as mean reconstitution in panel (E). G-K, GFP+ FL HSCs are less quiescent than Tom+ FL and adult HSCs. G-J, Analysis of cell cycle status of Tom+ and GFP+ FL and adult CD150+ KLS cells. (G-H) Representative flow cytometry plots (G) and accompanying quantification (H) of propidium iodide (PI) staining for DNA content. Brackets and values indicate the representative percentage of cells in S/G2/M. (I-J) Representative flow cytometry plots (I) and accompanying quantification (J) of cell cycle status as determined by measurement of in vivo EdU incorporation and Hoechst DNA staining. Values indicate representative frequencies of gated populations. N=8 in 3 independent experiments. Data are mean±SEM. *P< 0.05; **P< 0.01; ***P<0.001. K, Expression of Cyclin D1 is higher in GFP+ CD150+ KLS cells as compared to their Tom+counterparts by qRT-PCR. Data are mean±SEM. N=4 independent experiments performed in triplicate. ***P<0.001. See also Table S4.
Figure 5
Figure 5. Transient GFP+ HSCs are lymphoid-biased
A, Distribution of donor-derived contribution to WBC lineages (GMs, B220+ B-cells, CD3+ T-cells) in the peripheral blood (PB) 16 weeks post-transplantation in primary recipients of FL KLS cells from Figure 2D. ** P < 0.01. B, The ratio of myeloid (Plt+GM) to lymphoid (B+T) chimerism 16 weeks post-transplantation in the PB of individual primary recipients of Tom+ or GFP+ FL KLS cells from Figure 2D. ** P < 0.01. C, The ratio of myeloid progenitors (CMP) to lymphoid progenitors (CLP) in the BM of individual primary recipients of Tom+ or GFP+ FL KLS cells from Figure 2F. ** P < 0.01. D, Donor-derived contribution to each mature lineage calculated on a per HSC basis, based on HSC chimerism as determined in the BM of individual primary recipients of FL. # P < 0.1 E, Distribution of donor-derived contribution to WBC lineages in the PB 16 weeks post- transplantation in recipients of P14 BM KLS cells from Figure 4C. ** P < 0.01. F, The ratio of myeloid (Plt+GM) to lymphoid (B+T) chimerism 16 weeks post-transplantation in the PB of individual recipients of Tom+ or GFP+ P14 BM KLS cells from Figure 4C. *** P < 0.001. G, Distribution of donor-derived contribution to WBC lineages in the PB 16 weeks post- in utero transplantation (IUT) of Tom+ or GFP+ FL KLS or adult KLS cells in recipients from Figure 4E. H, The ratio of myeloid (Plt+GM) to lymphoid (B+T) chimerism in the PB of individual recipients transplanted in utero with Tom+ or GFP+ FL KLS or adult KLS cells from Figure 4E. # P < 0.1; * P < 0.05. I, Distribution of donor-derived contribution to WBC lineages in the PB 16 weeks post- transplantation in secondary recipients of FL KLS cells from Figure 2I. J, The ratio of myeloid (Plt+GM) to lymphoid (B+T) chimerism in the PB 16 weeks post-transplantation in individual secondary recipients of Tom+ or GFP+ FL KLS cells from Figure 2I. * P < 0.05. K, Relative levels of the indicated transcripts in Tom+ and GFP+ CD150+ KLS cells isolated from the E14.5 FlkSwitch FL as quantified by qRT-PCR. N= 2-4 independent experiments performed in triplicate. * P < 0.05; *** P < 0.001. See also Figure S2, S3, S4, and Table S3.
Figure 6
Figure 6. GFP+ fetal HSCs display superior ability to give rise to developmentally-restricted T-cells in a fetal thymic microenvironment
A-C, Neither fetal nor adult HSCs give rise to substantial numbers of TCRγδ-expressing T cells upon transplantation into adult recipients. A, Donor contribution to CD3+ thymocytes within the thymus of adult, secondary recipients of Tom+ and GFP+ fetal KLS cells or comparable transplants of adult KLS cells 18-weeks post-transplantation. N=10-12 representing three independent experiments. Data are mean±SEM. B-C, Representative FACS plots (B) and accompanying quantification (C) of donor-derived CD3+ thymocyte subsets for the mice described in (A). Numbers indicate representative frequencies of gated cell subsets. Data are mean±SEM. NS, not significant; ND, not detected. D-G, Tom+ and GFP+ FL HSC contribute equally to minimal reconstitution of iNKTs in irradiated adult recipients D-E, Representative FACS plots demonstrating the identification of splenic iNKT cells defined by double labeling of CD1d tetramer loaded with PBS57 (CD1dPBS57+) and antibody against TCR-β. D, Control sample labeled with an unloaded tetramer. E, Representative FACS plot indicate frequency of iNKT cells among Lin- splenocytes in an unirradiated WT mouse. F-G, Representative flow cytometry plots (F) and accompanying quantification (G) of donor-derived contribution to splenic iNKT cells in secondary recipients of Tom+ or GFP+ FL KLS cells. Data are shown in (G) are as mean±SEM. N=7 in 3 independent experiments. H-N, Fetal, but not adult, HSCs efficiently produce T cells in a fetal thymic microenvironment. H, Donor contribution to CD3+ thymocytes within fetal thymic organ cultures (FTOCs) seeded with Tom+ or GFP+ fractions of CD150+ FL KLS cells or adult CD150+ KLS cells. N=12-13 in 3 independent experiments. Data are mean±SEM. **P<0.01. I-J, Representative flow cytometry plots (I) and quantification (J) of donor-derived contribution to TCRβ- and TCRγδ–expressing subsets in FTOCs described from (H) are shown. Numbers indicate representative frequencies of gated populations. K, Quantification of donor-derived contribution to CD4+CD8+ (DP), CD4-CD8- (DN), CD4+, and CD8+ T-cell subsets in FTOCs described in (H). L-N, GFP+ FL HSCs give rise to significantly more TCR-Vγ3+ T-cells in FTOCs compared to Tom+ FL HSCs. Percentage of FTOC cultures described in (H) that contained TCR-Vγ3+ cells (L). Representative flow cytometry plots (M) and quantification (N) of donor-derived contribution to TCR-Vγ3+ cells in FTOCs described in (H). Data are shown as individual data points representing individual cultures. *P<0.05. See also Figure S6 and Table S5.
Figure 7
Figure 7. GFP+ fetal HSCs efficiently generate innate-like B-cells in vivo
A-D, GFP+ FL HSCs generate peritoneal cavity (PerC) B cells with greater efficiency than Tom+ FL HSCs or adult HSCs. A, Representative flow cytometry plots indicating donor-derived IgM+ cells within the peritoneal cavity in secondary recipients of adult HSCs, Tom+ FL HSCs, or GFP+ FL HSCs. Donor-derived cells from adult and Tom+ donors can be either Tom+ or GFP+; donor-derived cells from GFP+ donors are GFP+ B, Donor chimerism of PB B220+ B-cells and GM cells, and peritoneal cavity IgM+ cells, B-1a (IgM+ CD5+ Cd11b+), B-1b (IgM+ CD5- CD11b+) and B2 (IgM+ CD5- CD11b-) B-cells in secondary recipients of either Tom+ or GFP+ FL KLS cells, or adult HSCs (KLSF-). Results are displayed relative to recipients of Tom+ FL HSCs; Figure S7G displays the results as percent donor chimerism. C-D, Representative flow cytometry plots (C) and quantification (D) of donor-derived contribution to peritoneal cavity B-cell subsets in secondary recipients of adult HSCs, Tom+ FL HSCs, or GFP+ FL HSCs. E-G, GFP+ FL HSCs give rise to a higher proportion of marginal zone B cells in the spleen compared to Tom+ FL HSCs or adult HSCs. E, Donor chimerism of splenic marginal zone (MZ; CD21hi CD23-) and follicular zone (FO, CD21lo CD23+) B-cells among secondary recipients of Tom+ or GFP+ FL KLS cells or comparable recipients of adult KLS cells. Results are displayed relative to recipients of Tom+ FL HSCs; Figure S7H displays the results as percent donor chimerism. F-G, Representative flow cytometry plots (F) and quantification (G) of donor-derived contribution to splenic B-cell subsets from the same mice as in (E). N=5-17 per group in at least three independent experiments. #P<0.1; *P<0.05; **P<0.01; ***P<0.001. H-K, Contribution of Tom+ and GFP+ FL or adult HSCs to BM, PerC, and spleen cells upon in utero transplantation. H, BM donor chimerism in progenitor and mature cells among fetal recipients transplanted in utero with Tom+ or GFP+ FL KLS cells or adult KLS cells. Chimerism was analyzed 12-16 weeks post-transplantation in mice exhibiting LTMR and STMR. N=3-10 group. Data are mean±SEM. Additional details in Table S4. I, Donor chimerism of total PerC IgM+ cells, and PerC B-1a, B-1b and B2 B-cells among fetal recipients of Tom+ or GFP+ FL KLS cells or adult KLS cells 12-16 weeks post-in utero transplantation in the same mice as in (H). #P<0.10; *P<0.05. J, Donor chimerism of splenic MZ and FO B-cells among fetal recipients of Tom+ or GFP+ FL KLS cells or adult KLS cells 12-16 weeks post-in utero transplantation in the same mice as in (h). *P<0.05. K, Quantification of donor-derived contribution to splenic B-cell subsets among fetal recipients of Tom+ or GFP+ FL KLS cells 12-16 weeks post-in utero transplantation in the same mice as in (H). #P<0.10; *P<0.05. See also Figures S5 and S7.

Comment in

References

    1. Barber CL, Montecino-Rodriguez E, Dorshkind K. Reduced production of B-1-specified common lymphoid progenitors results in diminished potential of adult marrow to generate B-1 cells. Proceedings of the National Academy of Sciences of the United States of America. 2011;108(1):3700–13704. - PMC - PubMed
    1. Beaudin AE, Boyer SW, Forsberg EC. Flk2/Flt3 promotes both myeloid and lymphoid development by expanding non-self-renewing multipotent hematopoietic progenitor cells. Experimental hematology. 2014;42:218–229. e214. - PMC - PubMed
    1. Benlagha K, Kyin T, Beavis A, Teyton L, Bendelac A. A thymic precursor to the NK T cell lineage. Science. 2002;296:553–555. - PubMed
    1. Benz C, Copley MR, Kent DG, Wohrer S, Cortes A, Aghaeepour N, Ma E, Mader H, Rowe K, Day C, et al. Hematopoietic stem cell subtypes expand differentially during development and display distinct lymphopoietic programs. Cell stem cell. 2012;10:273–283. - PubMed
    1. Bowie MB, Kent DG, Dykstra B, McKnight KD, McCaffrey L, Hoodless PA, Eaves CJ. Identification of a new intrinsically timed developmental checkpoint that reprograms key hematopoietic stem cell properties. Proceedings of the National Academy of Sciences of the United States of America. 2007;104:5878–5882. - PMC - PubMed

Publication types

Substances