. 2016 Oct 6;99(4):791-801.
doi: 10.1016/j.ajhg.2016.08.012. Epub 2016 Sep 22.

Guidelines for Large-Scale Sequence-Based Complex Trait Association Studies: Lessons Learned from the NHLBI Exome Sequencing Project

Affiliations

Guidelines for Large-Scale Sequence-Based Complex Trait Association Studies: Lessons Learned from the NHLBI Exome Sequencing Project

Paul L Auer et al. Am J Hum Genet. .

Abstract

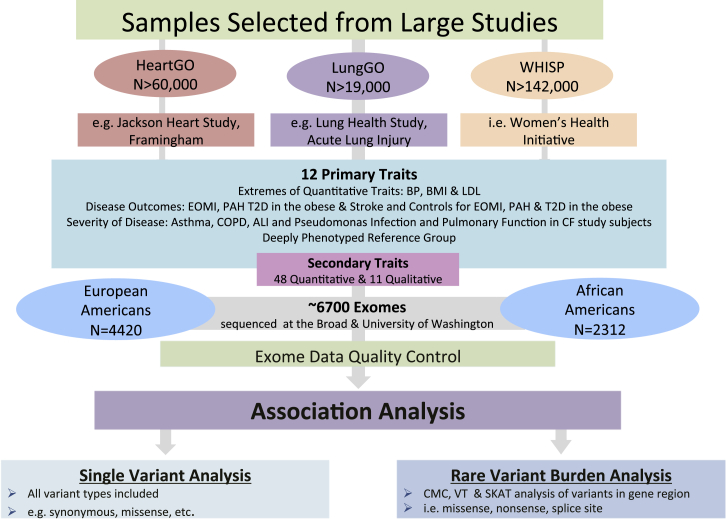
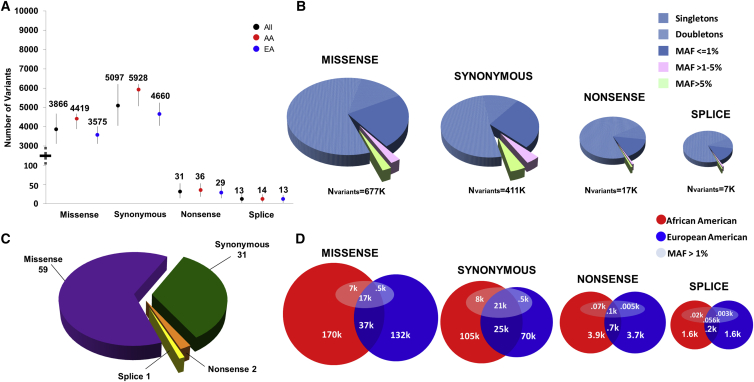
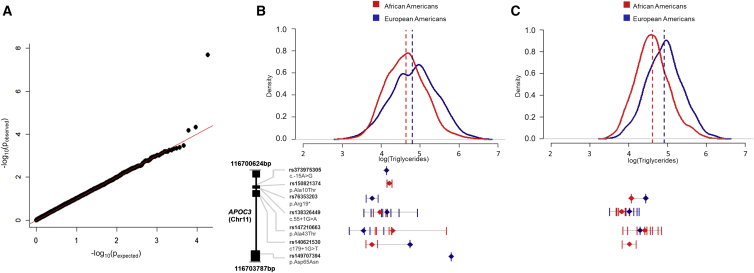
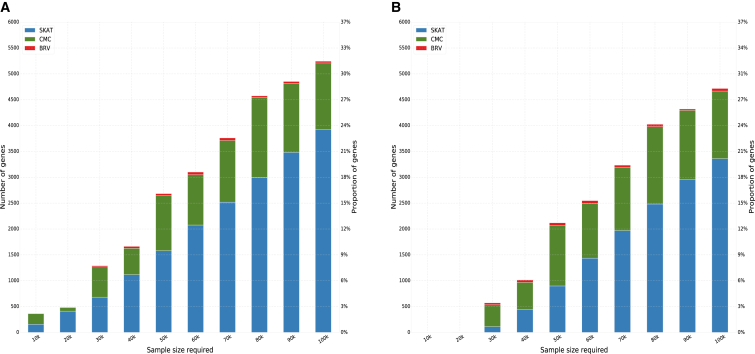
Massively parallel whole-genome sequencing (WGS) data have ushered in a new era in human genetics. These data are now being used to understand the role of rare variants in complex traits and to advance the goals of precision medicine. The technological and computing advances that have enabled us to generate WGS data on thousands of individuals have also outpaced our ability to perform analyses in scientifically and statistically rigorous and thoughtful ways. The past several years have witnessed the application of whole-exome sequencing (WES) to complex traits and diseases. From our analysis of NHLBI Exome Sequencing Project (ESP) data, not only have a number of important disease and complex trait association findings emerged, but our collective experience offers some valuable lessons for WGS initiatives. These include caveats associated with generating automated pipelines for quality control and analysis of rare variants; the importance of studying minority populations; sample size requirements and efficient study designs for identifying rare-variant associations; and the significance of incidental findings in population-based genetic research. With the ESP as an example, we offer guidance and a framework on how to conduct a large-scale association study in the era of WGS.


Figures

Figure 1
Figure 1
Schematic of the Work Flow for Sample Selection and Data Analysis in ESP Primary traits were selected from large, population-based studies with widely available data on secondary traits. Both European and African American samples were selected for sequencing. Association analyses were conducted using both genes and single variants as units of analysis.
Figure 2
Figure 2
Coding Variants Observed in the NHLBI-ESP (A) The average number of missense, synonymous, nonsense, and splice site variants per study subject for 2,307 African Americans and 4,392 European Americans and all study subjects (n = 6,699) for the intersect of all four targets. The vertical lines display the smallest and largest number of variants of each type observed per person. (B) The number of missense, synonymous, nonsense, and splice sites observed for NHLBI-ESP (n = 6,699) study subjects. Represented in each pie chart is the number of singletons, doubletons, and variant sites with an MAF of ≤1%, >1%–5%, and >5%. (C) The average number of unique missense, synonymous, nonsense, and splice site variants per individual. The variants are not only exclusive to the NHLB-ESP but also are not observed in either dbSNP or 1000 Genomes. (D) Comparison of the number of coding variant sites observed in AAs and EAs. The number of missense, synonymous, nonsense, and splice site variants that are unique to each population are observed in both populations and have a MAF of ≥1%. The numbers displayed are exclusive to one category. In order to fairly compare the number of variant sites in African Americans and European Americans, equal numbers of African Americans (n = 2,312) and European Americans (n = 2,312) were studied.
Figure 3
Figure 3
Triglyceride Rare Variant Association Analysis and Association of Rare Variants in APOC3 (A) QQ plot of the meta-analysis for African Americans and European Americans of rare variant burden analysis of triglyceride levels. Base 10 –log values of the observed p values are displayed versus their expected values. Rare variant association analysis was performed separately for African Americans (n = 1,654) and European Americans (n = 2,074) using the CMC analyzing those variant sites with a MAF ≤ 0.01. (B) Distribution of triglyceride levels for NHLBI-ESP study subjects and triglyceride levels for individuals with an APOC3 variant. The quantitative trait distribution of triglycerides after natural log transformation for African Americans and European Americans who are study subjects in the NHLBI-ESP. For the 27 individuals (8 African American and 19 European American) who are heterozygous for one of the 7 coding variants (3 splice, 1 stop-gain, and 3 missense), a tick represents their triglyceride levels after natural log transformation. For each variant site a diamond (red for African Americans and blue for European Americans) represents the average triglyceride levels for carriers of that variant. (C) Distribution of triglyceride levels for study subjects from the Women’s Health Initiative (WHI) and triglyceride levels for individuals with an APOC3 variant. The quantitative trait distribution of triglycerides after natural log transformation for African Americans (n = 1,820) and European Americans (n = 1,643) who are study subjects from the WHI. The DNA samples from the study subjects were genotyped on the exome chip. Of the seven variants that were observed in NHLBI-ESP, four were represented on the exome chip.
Figure 4
Figure 4
An Analysis of Statistical Power to Detect Associations across the Exome (A) Sample sizes necessary to detect associations for a binary trait across the exome. (B) Sample sizes for a quantitative trait. Results from the SKAT, CMC, and BRV rare-variant association tests are shown in blue, green, and red, respectively.

References

    1. Collins F.S., Varmus H. A new initiative on precision medicine. N. Engl. J. Med. 2015;372:793–795. - PMC - PubMed
    1. Li H., Durbin R. Fast and accurate short read alignment with Burrows-Wheeler transform. Bioinformatics. 2009;25:1754–1760. - PMC - PubMed
    1. Li H., Handsaker B., Wysoker A., Fennell T., Ruan J., Homer N., Marth G., Abecasis G., Durbin R., 1000 Genome Project Data Processing Subgroup The Sequence Alignment/Map format and SAMtools. Bioinformatics. 2009;25:2078–2079. - PMC - PubMed
    1. Jun G., Wing M.K., Abecasis G.R., Kang H.M. An efficient and scalable analysis framework for variant extraction and refinement from population-scale DNA sequence data. Genome Res. 2015;25:918–925. - PMC - PubMed
    1. Purcell S., Neale B., Todd-Brown K., Thomas L., Ferreira M.A., Bender D., Maller J., Sklar P., de Bakker P.I., Daly M.J., Sham P.C. PLINK: a tool set for whole-genome association and population-based linkage analyses. Am. J. Hum. Genet. 2007;81:559–575. - PMC - PubMed