. 2016 Oct 5;92(1):202-213.
doi: 10.1016/j.neuron.2016.08.037. Epub 2016 Sep 22.

Spatially Compact Neural Clusters in the Dorsal Striatum Encode Locomotion Relevant Information

Affiliations

Spatially Compact Neural Clusters in the Dorsal Striatum Encode Locomotion Relevant Information

Giovanni Barbera et al. Neuron. .

Abstract

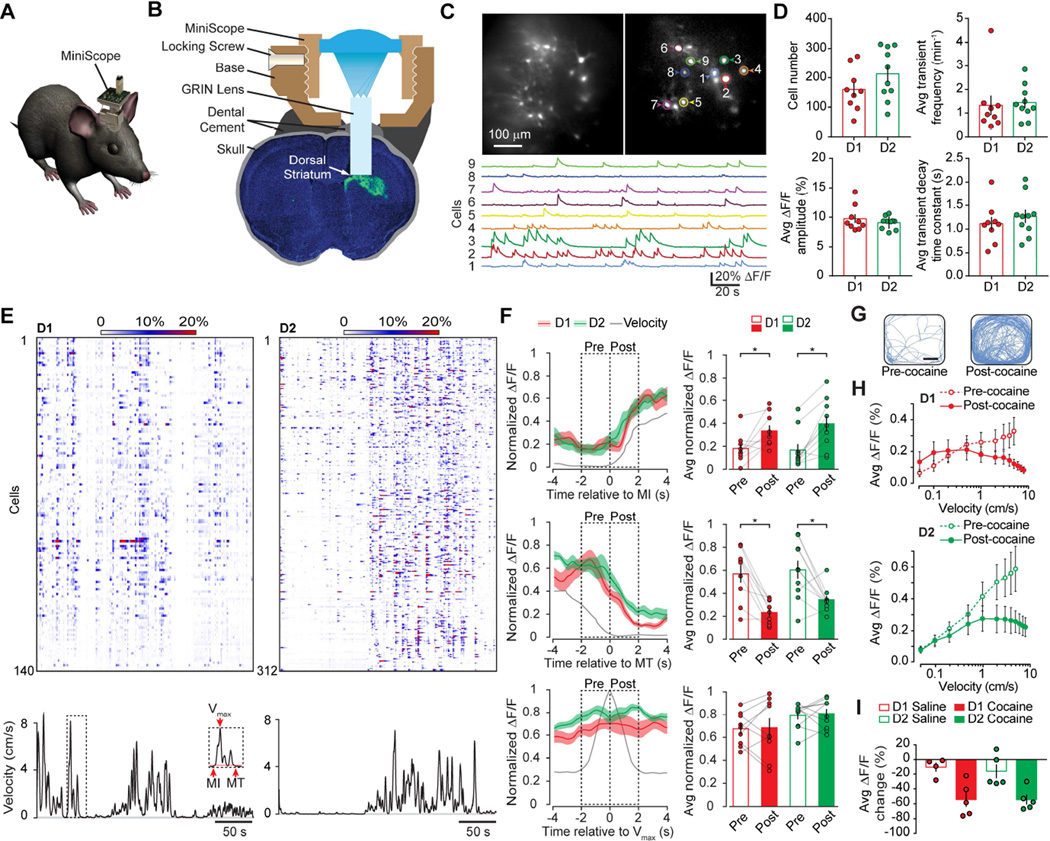
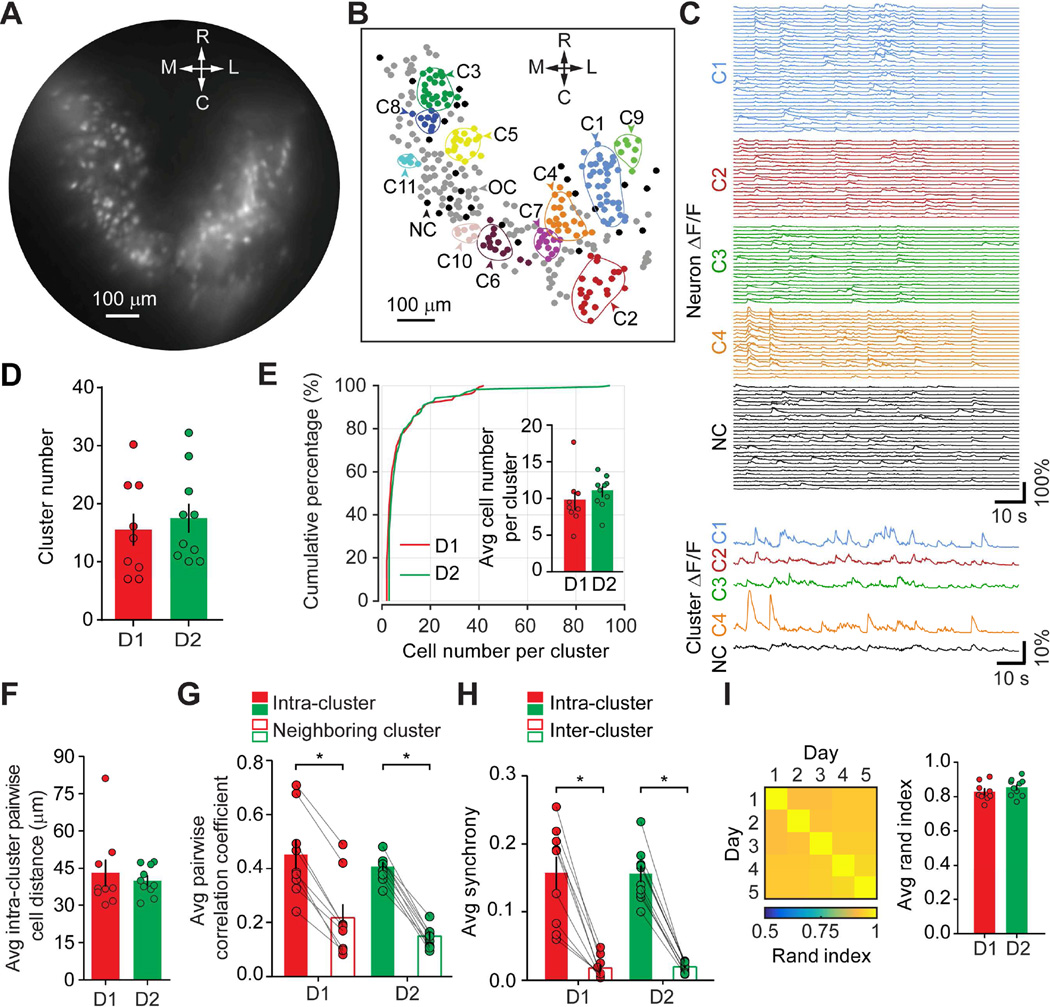
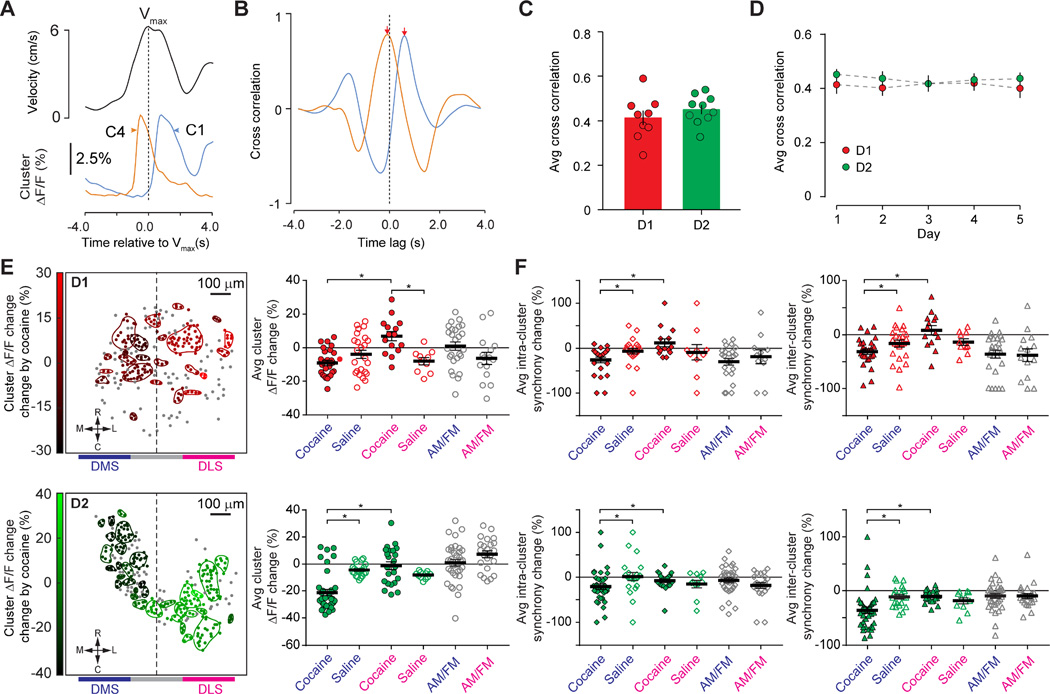
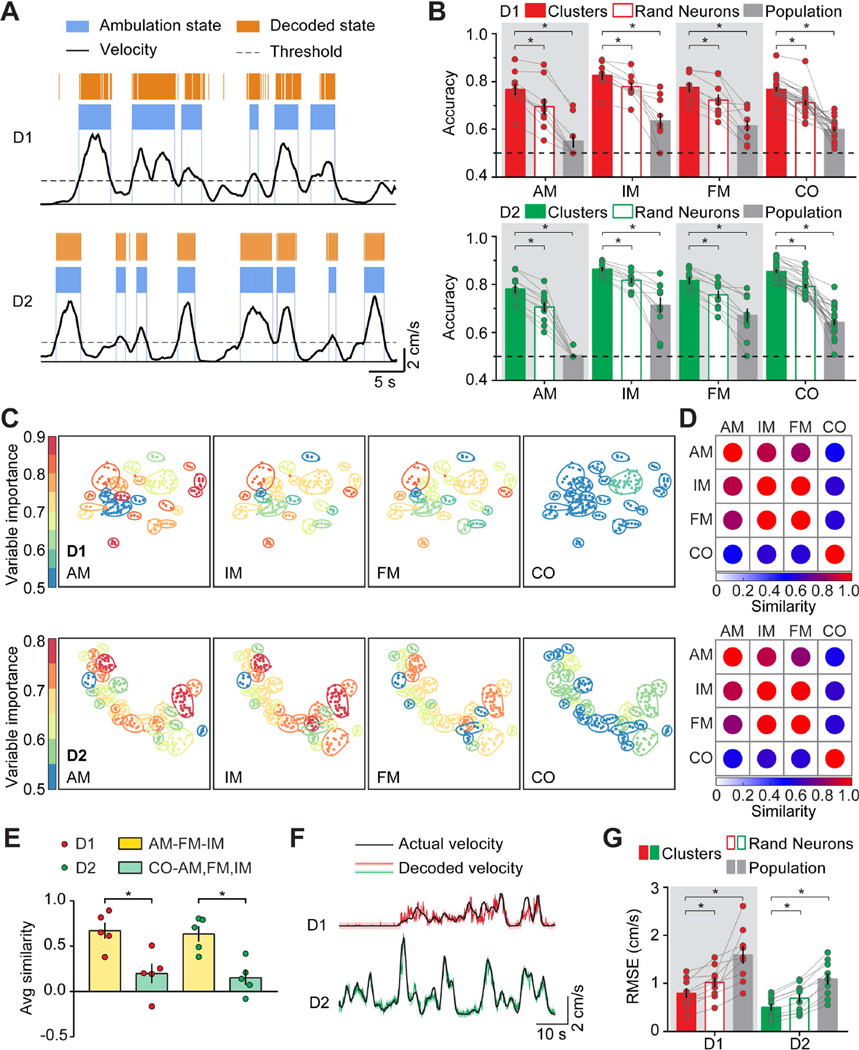
An influential striatal model postulates that neural activities in the striatal direct and indirect pathways promote and inhibit movement, respectively. Normal behavior requires coordinated activity in the direct pathway to facilitate intended locomotion and indirect pathway to inhibit unwanted locomotion. In this striatal model, neuronal population activity is assumed to encode locomotion relevant information. Here, we propose a novel encoding mechanism for the dorsal striatum. We identified spatially compact neural clusters in both the direct and indirect pathways. Detailed characterization revealed similar cluster organization between the direct and indirect pathways, and cluster activities from both pathways were correlated with mouse locomotion velocities. Using machine-learning algorithms, cluster activities could be used to decode locomotion relevant behavioral states and locomotion velocity. We propose that neural clusters in the dorsal striatum encode locomotion relevant information and that coordinated activities of direct and indirect pathway neural clusters are required for normal striatal controlled behavior. VIDEO ABSTRACT.


Conflict of interest statement

Author Information EC is a co-founder of TeraDeep Inc, Financial Conflicts of Interest are managed by Purdue University’s Conflict of Interest Committee. All other authors declare no competing financial interests.

Figures

Figure 1
Figure 1. Dorsal Striatal D1- and D2-MSN Population Activity Displayed Similar Relationship with Locomotion in Freely Moving Mice
A. Schematic demonstration of a miniScope carried by a mouse for in vivo imaging purpose. B. Schematic demonstration of mounting miniScope on mouse head. GRIN lens was implanted into the GCaMP6s AAV infected dorsal striatum (Green region) and anchored on the mouse skull using dental cement; miniScope base was mounted on the mouse skull using dental cement; miniScope body was secured to miniScope base through a locking screw. C. Representative fluorescent images of medium spiny neurons labeled with GCaMP6s at two different time points (Upper panels, scale bar: 100 µm). Regions of interest (ROIs) were drawn around 9 representative neurons. Traces at lower panel represented calcium transients from ROIs with matched colors. D. Quantifications of identified active neuron number (top left panel), calcium transient frequency (top right panel), calcium transient amplitude (bottom left panel), and decay time constant (bottom right panel) for D1- (Red) and D2- (Green) MSN. Each dot on the plot represented the averaged result from one mouse, and histogram bar represented the mean value for all D1- or D2- mice, with error bars representing sem. E. D1- and D2- MSN displayed similar activity during locomotion. Top panels: rasterplots of calcium transients from 140 neurons of a representative D1-Cre mouse (Left) and from 312 neurons of a representative D2-Cre mouse (Right). Bottom panels: black traces indicated locomotion velocity of the mouse. Inset panel indicated motion initiation (MI), motion termination (MT), and maximum velocity of locomotion (Vmax). Horizontal scale bar: 50 seconds. F. D1- (Red) and D2- (Green) MSN displayed similar population activity during MI, MT, and Vmax. Left panels indicated population activity of D1- and D2- MSN, red trace representing averaged population activity from 9 D1-Cre mice; green trace representing averaged population activity from 10 D2-Cre mice; shadowed area on the traces representing sem; black trace in each plot represented mouse locomotion velocity; vertical dotted lines indicated the exact moment for the onset of MI, MT and Vmax. Right histogram plots quantified MSN population activity two seconds before and after MI, MT, and Vmax. Each dot on the plot represented the averaged result from one mouse, connected with gray lines for the “pre” and “post” values of each mouse. Histogram bar represented the mean value for all D1- or D2- mice, with error bars representing sem. G. Representative mouse locomotion traces in an open field before and after cocaine injection, indicating that cocaine substantially enhanced mouse locomotor activity. H. Cocaine altered relationships between mouse locomotion velocity and D1- (Red) and D2- (Green) MSN population activity. Open circles and dashed lines indicated before cocaine injections, solid circles and solid lines indicated after cocaine injections. I. Quantification of D1- and D2- MSN population activity changes during ambulation before and after saline and cocaine injections. Each dot on the plot represented the averaged result from one mouse, and histogram bar represented the mean value for all D1- or D2- mice, with error bars representing sem. Asterisk (*) represents statistical significance.
Figure 2
Figure 2. Cluster Analysis Revealed Spatially Compact Neural Clusters Within Dorsal Striatal D1- and D2- MSNs
A. A representative standard deviation projection of 3000 GCaMP6 images of dorsal striatum from a representative D2-Cre mouse, scale bar 100 µm. B. Spatial distribution of clusters identified from all imaging sessions of a representative D2-Cre mouse. A total of 11 colored enclosed areas indicated 11 different neural clusters (C1 to C11), each containing more than 7 neurons (neurons within each cluster were labeled with the same color). Neurons in clusters containing less than 7 neurons were labeled in gray (OC), and un-clustered neurons were labeled in black (NC). Colored contour indicates the estimated boundary for each cluster. Scale bar 100 µm. Orientation of the map for both A and B: M, medial; L, Lateral; R, Rostral; C, Caudal. C. Individual neural calcium transient traces and mean cluster activity traces from four representative clusters (C1 to C4, colored); and individual calcium transient traces from un-clustered neurons (NC) and the averaged calcium trace from all the NC neurons (Black). D. Quantification of neural cluster numbers identified from each mouse dorsal striatum. Each dot on the plot represented the averaged result from one mouse, histogram bar represented the mean value for all D1- or D2- mice, with error bars representing sem (same for E through I histogram plots). E. Cumulative plot of cell numbers per cluster for both D1- and D2-MSN. Inset histogram bars were quantification of averaged cluster numbers. F. Quantification of the averaged cell distance within a cluster. G. Quantification of pair-wise neuron correlation coefficient within a cluster (Intra-cluster) or between neighboring clusters (Inter-cluster). H. Quantification of calcium activity synchrony within a cluster (Intra-cluster) or between clusters (Inter-cluster). In both G and H, gray lines connected the “Intra-” and “Inter-” cluster values from each mouse. I. Left panel was representative matrix of Rand index from a representative mouse showing clustering was consistent over five days. Each square in the matrix indicated the Rand index value calculated for the two days specified by the corresponding row and column. The range indicator below the matrix indicated the value of Rand index in the matrix. Right histogram bar plot quantified the average Rand index for D1- and D2- MSN clusters over five days. Asterisk (*) represents statistical significance.
Figure 3
Figure 3. Cluster Activity Dynamics Under Different Behavior States
A. Representative cluster activities during maximum velocity (Vmax) of locomotion. Upper panel: a representative mouse locomotion velocity peak; Lower panel: cluster activity of C1 and C4 (corresponding to clusters shown in Figure 2B). Vertical dash line indicated peak position of Vmax B. Cross correlation between cluster C1 and C4 activity with Vmax. Vertical dash line indicated zero time lag in the cross correlation. C. Quantification of cross-correlation between cluster activity and Vmax for D1- or D2- MSN from Day One. Each dot indicated the average result from one mouse on Day One, and histogram bars indicated the mean value for all D1- or D2- mice, with error bars representing sem. D. Reliability of cross-correlation over 5 days, X-axis represented days, Y-axis represented averaged cross correlation value for each day, each dot indicating the averaged value from all D1- or D2- mice on the corresponding day, and error bars representing sem. E. Left panels were representative maps for cluster activity change from a D1-Cre (top left panel) and D2-Cre mouse (bottom left panel). Orientation of the map: M, medial; L, Lateral; R, Rostral; C, Caudal. Colored contour indicated the estimated boundary for each cluster. Dots with the same color as the contour indicate the centroids of neurons in the cluster. Gray dots indicated un-clustered neurons. Range indicator on the left indicated activity change, with reduced activity towards black color, and increased activity towards brighter red (D1-MSN) or green (D2-MSN). Horizontal bar beneath panels indicated the approximate location of dorsomedial and dorsolateral striatum (DMS and DLS). Scale bar 100 µm. Right panels were quantifications of cluster activity change near DMS (Blue color) and DLS (Pink color). Y-axis represented activity change, with negative value representing activity suppression and positive value representing activity increase. Each dot indicated value from one cluster. Black horizontal line represented the average value from all clusters in either DMS or DLS, error bar represented sem. Cocaine: activity change following cocaine injection; Saline: activity change following saline injection; AM/FM: activity difference between ambulation and fine movement. F. Quantification of cluster synchrony change near DMS (Blue color) and DLS (Pink color). Left panels were intra-cluster synchrony change for D1-MSN (top) and D2-MSN (bottom), Right panels were inter-cluster synchrony change for D1-MSN (top) and D2-MSN (bottom). The definition for positive and negative values in Y-axis was the same as E. Each dot indicated value from one cluster. Black horizontal line represented the average value from all clusters in either DMS or DLS, error bar represented sem. Asterisk (*) represents statistical significance.
Figure 4
Figure 4. MSN Cluster Activities Perform Better in Behavior Decoding
A. Mouse ambulation decoding using neural cluster activity data from D1- (Top panel) and D2- (Bottom panel) MSN. Mouse locomotor activity traces were shown at the bottom (Black traces). Ambulation was defined as locomotion velocity higher than 2 cm/s. Blue segments indicated actual ambulation period of mouse; Orange segments indicated prediction of mouse ambulation based on neural cluster activity. Horizontal scale bar: 5 seconds, vertical scale bar: 2 cm/s. B. Histogram showing accuracy of behavior state decoding based on cluster activity (Red filled bars on top panel, D1-MSN; Green filled bars on bottom panel, D2-MSN), randomly selected neuron activities (Red unfilled bars on top panel, D1-MSN; Green unfilled bars on bottom panel, D2-MSN) and population activity (Gray bars on top, D1-MSN; Gray bars on bottom, D1-MSN). Each dot on the plot represented the averaged result from one mouse, and histogram bar represented the mean value for all D1- or D2-mice, with error bars representing sem. AM: ambulation; IM: immobility; FM: fine movement; CO: cocaine. Dotted line at 50% accuracy indicated binary prediction by pure chance. C. Neural cluster map from representative D1-Cre (top panels) and D2-Cre (bottom panels) mouse indicating variable importance value of cluster decoding in four different behavior state decoding. Color on each cluster indicated variable importance value for the cluster in specified behavior decoding experiment, as indicated by the range indicator at the left. D. Similarity matrix for representative D1-Cre (top panel) and D2-Cre (bottom panel) mouse showing similarity of cluster variable importance between any two behavior decoding experiments. Color for the dot in the matrix indicated similarity value, as indicated by the range indicator at the bottom of the matrix. E. Quantification of averaged similarity value between the three normal locomotion behavior states (ambulation, immobility, and fine movement) and the cocaine injection behavior state. Red dots indicated D1-Cre mice, and green dots indicated D2-Cre mice. Each dot on the plot represented the averaged result from one mouse, and histogram bar represented the mean value for all D1- or D2- mice, with error bars representing sem. Yellow histogram bars indicated similarity scores between three normal locomotion behavior states, and green histogram bars indicate similarity scores between normal locomotion states and cocaine injection state. F. Representative mouse locomotion velocity decoding using cluster activity. Black traces indicated the actual mouse locomotion velocity; Red and green traces indicated predicted locomotion velocity based on D1- and D2-MSN cluster activities respectively. Horizontal scale bar: 10 seconds; Vertical scale bar: 2cm/s. G. Quantification of the root-mean-square error (RMSE) between predicted velocity and actual velocity for decoding error based on cluster (Red filled bars, D1-MSN; Green filled bars, D2-MSN), randomly selected neuron activities (Red unfilled bars, D1-MSN; Green unfilled bars, D2-MSN) and population activity (Gray bar at the left, D1-MSN; Gray bar at the right, D2-MSN). Lower RMSE value indicated lower prediction error therefore better prediction. Each dot on the plot represented the averaged result from one mouse, histogram bar represented the mean value for all D1- or D2- mice, with error bars representing sem. Red dots represented D1-Cre mice and green dots represented D2-Cre mice. Asterisk (*) represents statistical significance.

Similar articles

Cited by

References

    1. Adler A, Katabi S, Finkes I, Israel Z, Prut Y, Bergman H. Temporal convergence of dynamic cell assemblies in the striato-pallidal network. The Journal of neuroscience : the official journal of the Society for Neuroscience. 2012;32:2473–2484. - PMC - PubMed
    1. Albin RL, Young AB, Penney JB. The functional anatomy of basal ganglia disorders. Trends in neurosciences. 1989;12:366–375. - PubMed
    1. Alexander GE, Crutcher MD. Functional architecture of basal ganglia circuits: neural substrates of parallel processing. Trends in neurosciences. 1990;13:266–271. - PubMed
    1. Bakhurin KI, Mac V, Golshani P, Masmanidis SC. Temporal correlations among functionally specialized striatal neural ensembles in reward-conditioned mice. Journal of neurophysiology. 2016;115:1521–1532. - PMC - PubMed
    1. Balleine BW, Delgado MR, Hikosaka O. The role of the dorsal striatum in reward and decision-making. The Journal of neuroscience : the official journal of the Society for Neuroscience. 2007;27:8161–8165. - PMC - PubMed