. 2016 Oct 5;92(1):214-226.
doi: 10.1016/j.neuron.2016.09.001. Epub 2016 Sep 22.

Convergence of Reinforcing and Anhedonic Cocaine Effects in the Ventral Pallidum

Affiliations

Convergence of Reinforcing and Anhedonic Cocaine Effects in the Ventral Pallidum

Meaghan Creed et al. Neuron. .

Abstract

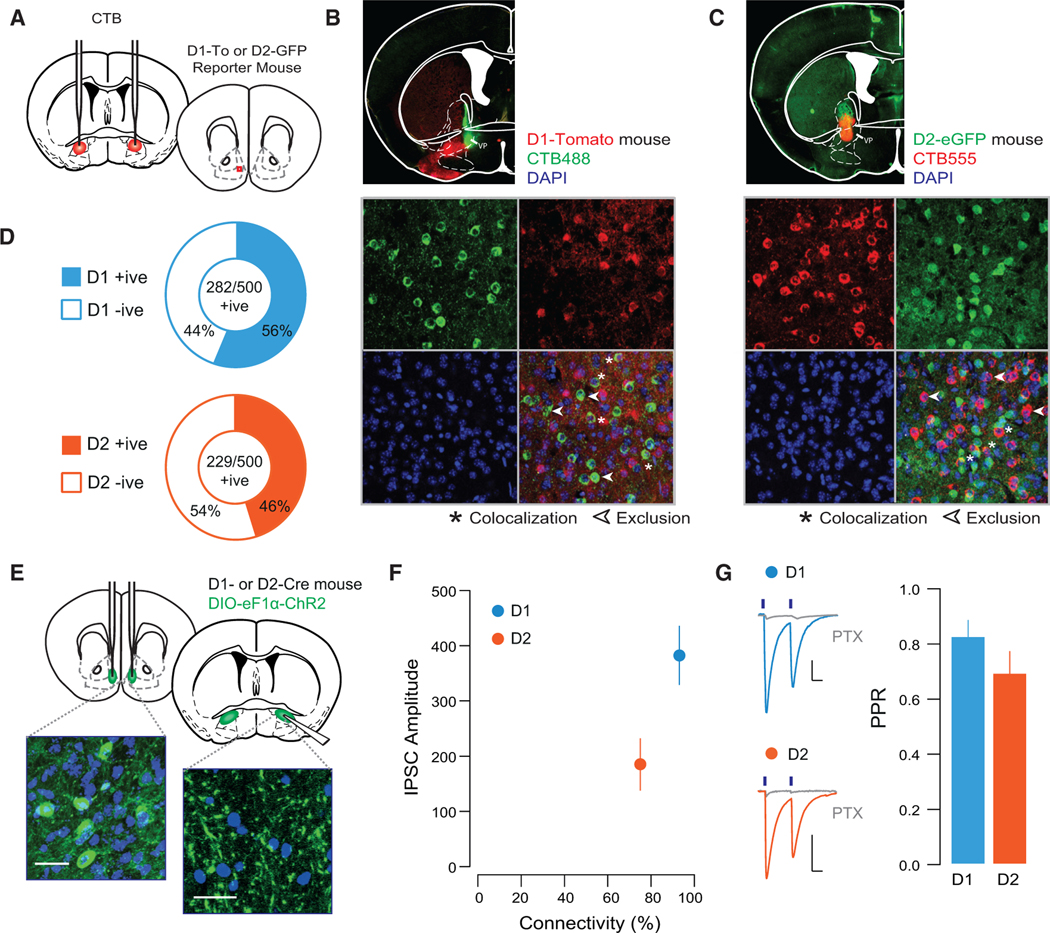
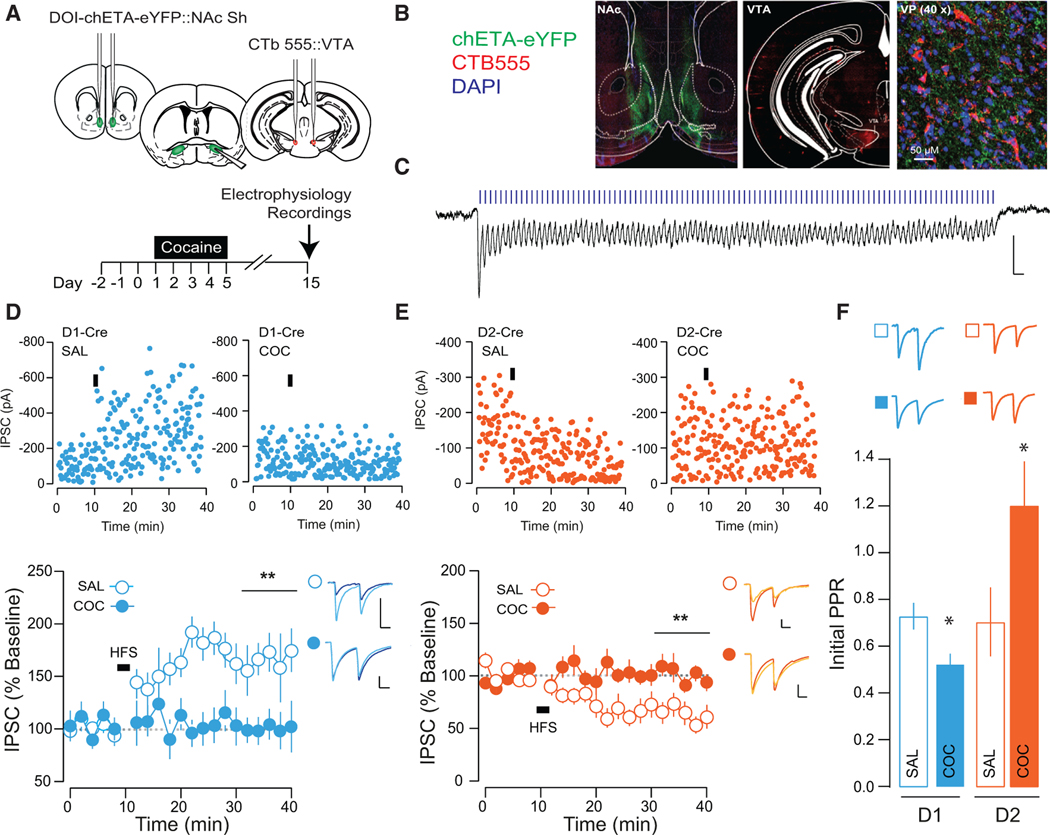
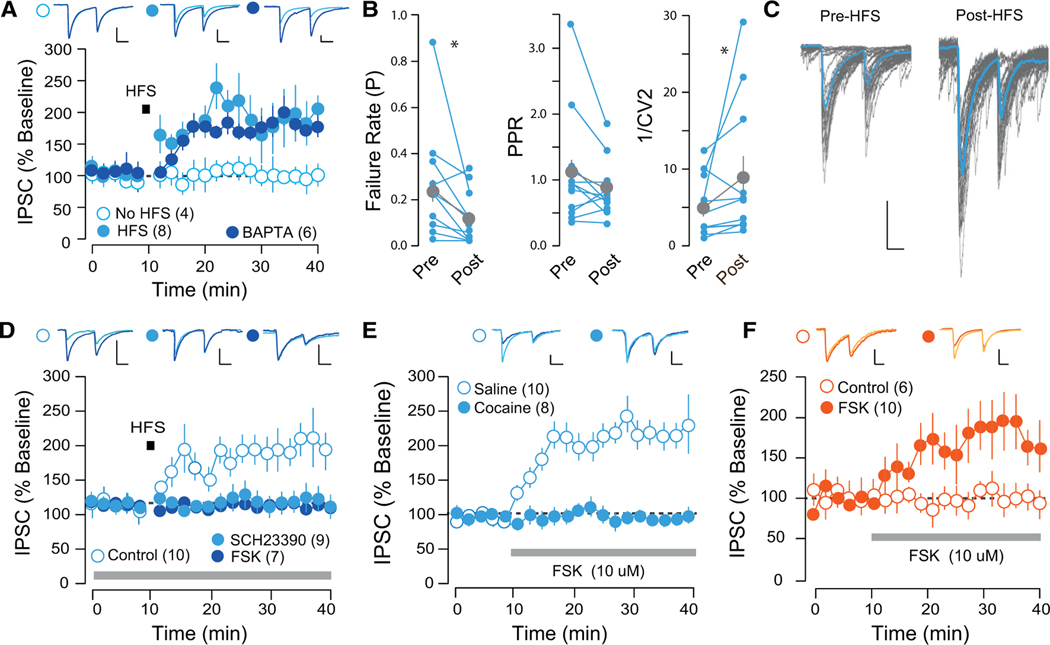
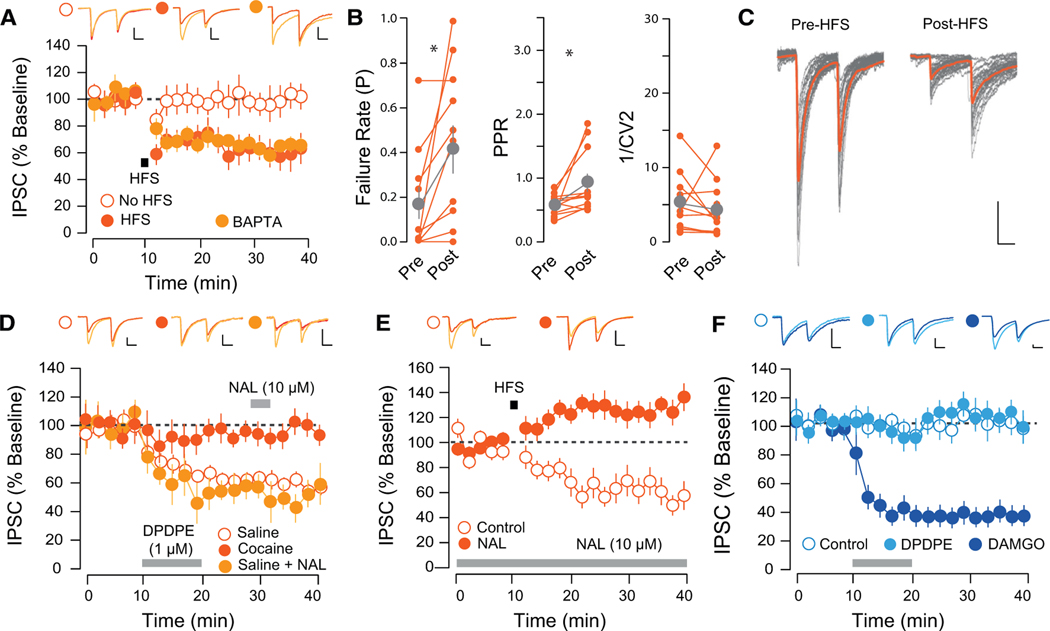
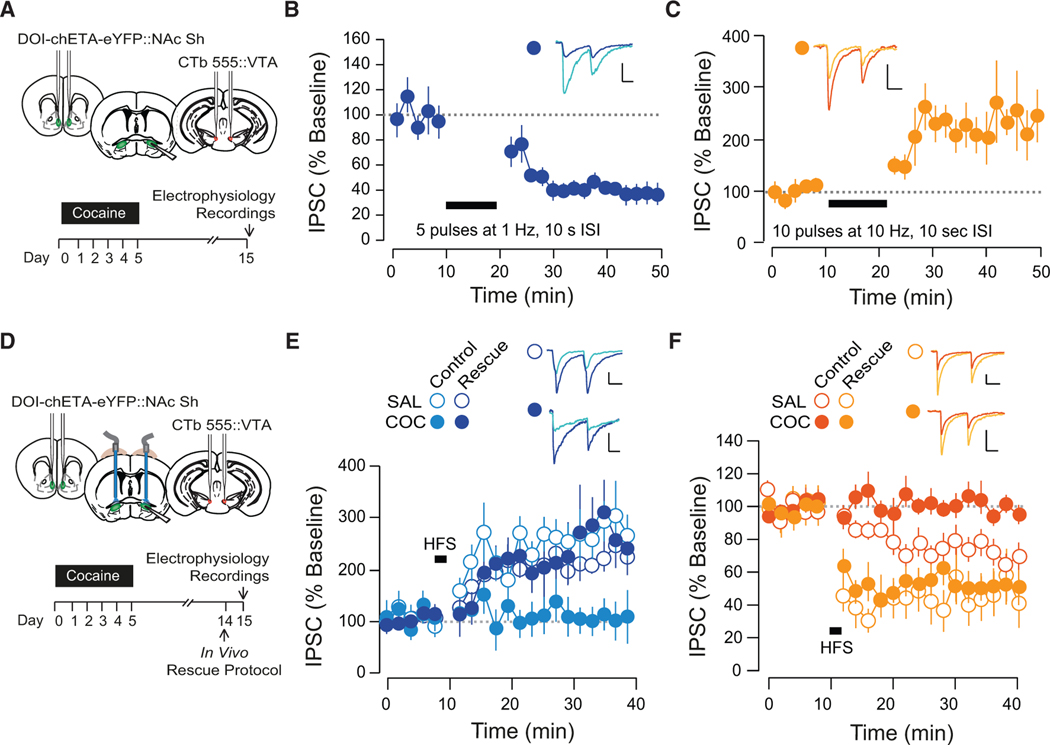
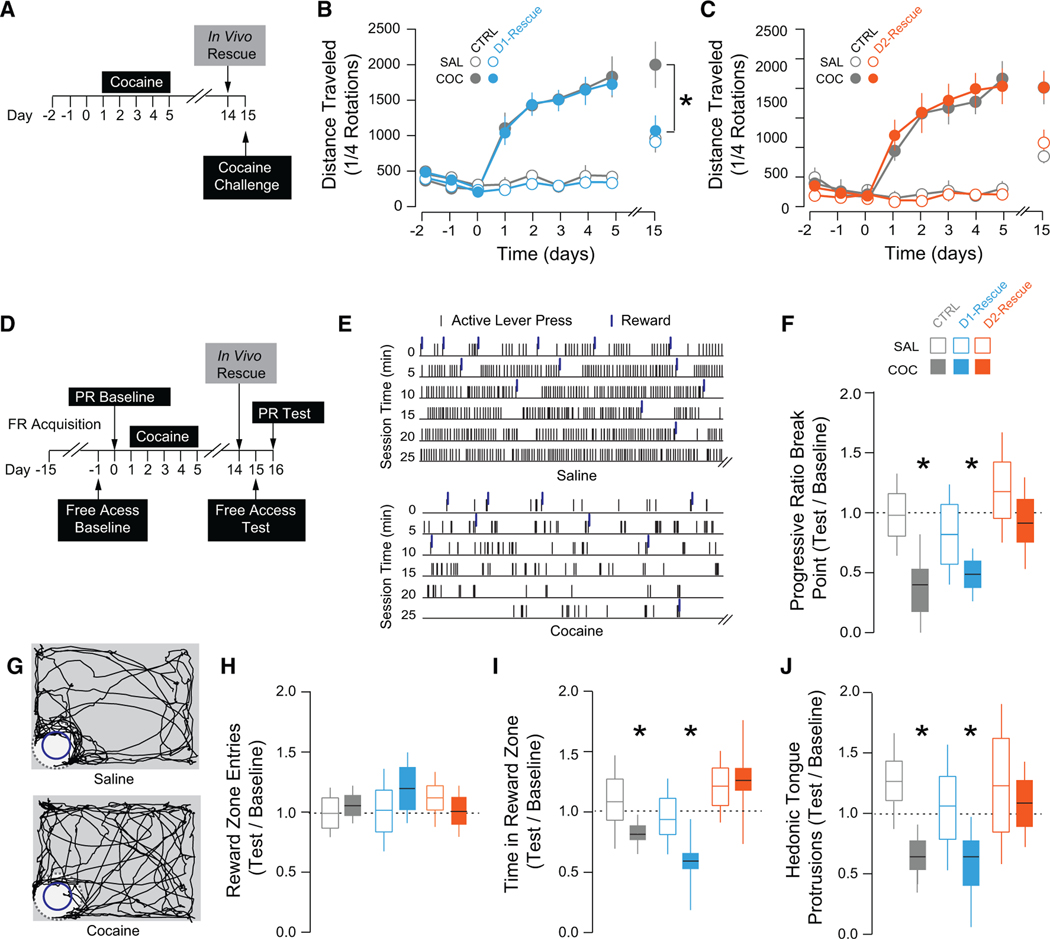
Addiction is a disorder of behavioral symptoms including enhanced incentive salience of drug-associated cues, but also a negative affective state. Cocaine-evoked synaptic plasticity in the reward system, particularly the nucleus accumbens (NAc), drives drug-adaptive behavior. However, how information is integrated downstream of the NAc remains unclear. Here, we identify the ventral pallidum (VP) as a site of convergence of medium spiny neurons expressing dopamine (DA) receptor type 1 (D1-MSNs) and type 2 (D2-MSNs) of the NAc. Repeated in vivo cocaine exposure potentiated output of D1-MSNs, but weakened output of D2-MSNs, occluding LTP and LTD at these synapses, respectively. Selectively restoring basal transmission at D1-MSN-to-VP synapses abolished locomotor sensitization, whereas restoring transmission at D2-MSN-to-VP synapses normalized motivational deficits. Our results support a model by which drug-evoked synaptic plasticity in the VP mediates opposing behavioral symptoms; targeting the VP may provide novel therapeutic strategies for addictive disorders.


Figures

Figure 1.
Figure 1.. D1- and D2-MSN Projection to the VP
(A) Schematic of experiment. (B) Representative injection site of CTB488 into the VP (top) and 40× confocal images of sections of the NAc shell of D1-TdTomato mice. (C) Injection site of CTB555 into the VP (top) and 40× confocal images of sections of the NAc shell of D2-eGFP mice (n = 250 cells from 2 mice of each genotype). (D) Quantification of CTB-positive cells based on their co-expression with reporter protein; in D1-TdTomato mice, 56% of CTB-positive cells (five sections/mouse from two mice) co-localized with TdTomato, while in D2-eGFP mice, 46% of CTB-positive cells co-localized with the D2-eGFP protein (five sections/mouse from two mice). (E) Schematic and 40× confocal images of injection site in the NAc shell floxed-channelrhodpsin, and terminal fields in the VP (scale bars, 50 μM). (F) Connectivity plot summarizing optogenetic circuit mapping. In the VP, 92.8% of neurons were innervated by D1-MSNs (83 cells from 4 mice; averageconnectivity strength, 382.5 ± 53.7 pA), whereas 75.0% received innervation from D2-MSNs (56 cells from 4 mice; average connectivity strength, 184.9 ± 47.2 pA). (G) Currents blocked by picrotoxin (PTX; 20 μM). There was no difference in the PPR between D1- and D2-VP synapses (D1, 0.75 ± 0.05; D2, 0.82 ± 0.09; t = 0.655, p = 0.514).
Figure 2.
Figure 2.. Cocaine Occludes Bidirectional Plasticity at NAc-to-VP Synapses
(A) Schematic of experiment. (B) Representative section of ChR2 infection site in the NAc (left), and CTB seeding in the VTA (middle). Section (40×) of the VP showing labeled fibers opposing CTB-positive VP cells (left). (C) IPSC recorded in VP cell during 100 Hz light stimulation. (D) In saline-treated D1-Cre mice, HFS induced an LTP at NAc-VP synapses. HFS failed to induce LTP in cocaine-treated mice (saline [SAL], 181.16% ± 30.19%, 4 cells from 2 mice; cocaine [COC], 100.35% ± 18.53%, 8 cells from 3 mice). Representative traces (baseline, light blue; post-LTP, dark blue), single-cell examples (top), and group data (bottom) are shown. (E) In saline-treated D2-Cre mice, HFS induced an LTD at NAc-VP synapses. HFS failed to induce LTD in cocaine-treated mice (SAL, 62.95% ± 11.61%, 10 cells from 3 mice; COC, 100.05% ± 5.95%, 10 cells from 3 mice). Representative examples of single-cell experiments (top) and group data (bottom) are shown. (F) PPR was not different between D1- and D2-MSN-to-VP synapses in saline-treated mice (D1-MSNs, 0.733 ± 0.057, 10 cells from 3 mice; D2-MSNs, 0.708 ± 0.148, 10 cells from 3 mice). Relative to saline-treated mice, PPR was decreased in D1-MSNs (D1-MSNs, 0.530 ± 0.043, 10 cells from 3 mice; t = 2.84, p = 0.011) and increased in D2-MSNs (D2-MSNs, 1.207% ± 0.188%, 10 cells from 3 mice; t = 2.09, p = 0.051) in cocaine-treated mice. *p < 0.05; all plots mean ± SEM. For representative traces, baseline (20 trials) and final 20 sweeps of recording are shown. All scale bars, 50 pA, 20 ms. Related to Figures S1–S3.
Figure 3.
Figure 3.. HFS-Induced LTP at D1-VP Synapses Is Presynaptic and PKA Dependent
(A) HFS-induced LTP at D1-VP synapses was insensitive to postsynaptic BAPTA (mock HFS, 100.98% ± 16.51%, 6 cells from 3 mice; HFS, 188.63% ± 32.94%,11 cells from 4 mice; HFS with BAPTA, 170.09% ± 18.09%, 5 cells from 2 mice). (B) HFS-induced LTP was associated with a decrease in the PPR, decrease in failure rate (FR), and no change in 1/CV2 (paired t test PPR, t = 2.27, p = 0.046; FR, t = 2.34, p = 0.042; 1/CV2, t = 0.863, p = 0.407, 11 cells from 4 mice). (C) Twenty individual traces pre- and post-HFS protocol. (D) HFS-induced LTP was prevented by incubation in SCH23390 of FSK (control [CTRL], 223.91% ± 16.09%, 4 cells from 2 mice; SCH23390, 92.69% ± 12.67%,9 cells from 3 mice; FSK, 114.3% ± 30.13%, 7 cells from 3 mice). (E) Application of FSK induced an LTP at D1-VP synapses, which was occluded in cocaine-treated mice (SAL, 220.7% ± 21.72%, 10 cells from 3 mice; COC, 97.46% ± 9.06%, 6 cells from 2 mice). (F) Application of FSK induced an LTP at D2-VP synapses (CTRL, 92.51% ± 9.11%, 4 cells from 3 mice; FSK, 175.5% ± 33.62%, 4 cells from 3 mice). *p < 0.05; all plots mean ± SEM. For representative traces, first and last 20 trials of recording in light and dark blue, respectively. Scale bars, 20 pA, 20 ms.
Figure 4.
Figure 4.. HFS-Induced LTD at D2-VP Synapses Is Presynaptic and DOR Mediated
(A) HFS-induced LTD at D2-VP synapses was insensitive to postsynaptic BAPTA (CTRL, 103.54% ± 17.57%, 5 cells from 2 mice; HFS, 61.43% ± 9.92%, 10 cells from 4 mice; HFS with BAPTA, 60.62% ± 6.42%, 6 slices from 3 mice). (B) HFS-LTD was associated with an increase in the PPR and failure rate and a decrease in C1/V12 (paired t test PPR, t = 2.45, p = 0.035; FR, t = 2.79, p = 0.019; 1/CV2, t = 1.079, p = 0.306, 11 cells from 6 mice). (C) Twenty individual IPSC traces pre- and post-HFS protocol. (D) DPDPE induced an LTD in saline-, but not cocaine-treated, mice (SAL, 59.33% ± 7.12%, 10 cells from 3 mice; COC, 97.994% ± 8.14%, 8 cells from 3 mice). Naltrindole (NAL) applied after DPDPE-LTD did not reverse the plasticity (52.92% ± 8.5%, 5 cells from 2 mice). (E) Incubation in NAL prevented the HFS-induced LTD (CTRL, 61.43% ± 9.92%, 10 cells from 4 mice; NAL, 130.4% ± 8.84%, 9 cells from 5 mice). (F) DPDPE did not affect transmission at D1-VP synapses (CTRL, 111.85% ± 18.49%, 3 cells from 3 mice; DPDE, 106.99% ± 6.49%, 11 cells from 4 mice); DAMGO (1 μM) induced a depression of IPSCs (61.33% ± 6.08%, 6 cells from 3 mice). *p < 0.05, all plots mean ± SEM. For representative traces, first and last 20 trials of recording in light and dark orange, respectively. Scale bars, 20 pA, 20 ms. Related to Figure S4.
Figure 5.
Figure 5.. Validation of Stimulation Protocols to Normalize Transmission at D1- or D2-MSN-to-VP Synapses
(A) Schematic of experiments. (B) In cocaine-treated mice, trains of five pulses at 1 Hz, ITI of 10 s applied for 10 min induced an LTD at D1-MSN-to-VP synapses (49.41% ± 5.93%, 5 cells from 2 mice). (C) In cocaine-treated mice, trains of ten pulses at 10 Hz, ITI of 10 s applied for 10 min, induced an LTP at D2-MSN-to-VP synapses (217.48% ± 51.38%, 6 cells from 3 mice). (D) Schematic of experiments. (E) In cocaine-treated mice that had undergone in vivo stimulation (protocol as in B), HFS induced an LTP at D1-MSN-to-VP synapses (175.5% ± 33.62%, 4 cells from 3 mice). Control data from Figure 2D are plotted for comparison. (F) In cocaine-treated mice that had undergone in vivo stimulation (protocol as in C), HFS induced an LTP at D1-MSN-to-VP synapses (48.89% ± 14.29%, 9 cells from 2 mice). Control data from Figure 2E are plotted here for comparison. *p < 0.05; all plots mean ± SEM. For representative traces, first and last 20 trials of recording are shown. Scale bars, 20 pA, 20 ms.
Figure 6.
Figure 6.. Selectively Normalizing Transmission at D1- or D2-MSN-to-VP Synapses Differentially Affects Drug-Adaptive Behavior
(A–C) Locomotor sensitization experiments. (A) Schematic of experiment. (B) In vivo rescue of D1 transmission abolished the sensitized response to cocaine (COC CTRL, 1,578.0 ± 248.8, n = 7; COC with D1 rescue, 1,026.1 ± 133.08,n = 12; t = 2.087, p = 0.05), but had no effect on acute response to cocaine (SAL CTRL, 878.83 ± 227.41, n = 6; SAL with D1 rescue, 860.3 ± 134.6, n = 8; t = 0.07, p = 0.94). (C) Rescue of D2-MSN VP transmission had no effect on cocaine response (COC CTRL, 1,735.86 ± 281.74, n = 7; COC with D2 rescue, 1,513.58 ± 161.20, n = 12; t = 0.21, p = 0.83; SAL CTRL, 1,042.17 ± 151.81, n = 6; SAL with D2 rescue, 1,151.25 ± 66.55, n = 8; t = 0.70, p = 0.50). (D) Schematic of sucrose-related experiments. (E and F) Operant task (E) raster plots of first 30 min of PR test in saline- (top) and cocaine-treated mouse (bottom). (F) Cocaine-treated mice had lower break points during the test relative to baseline (SAL CTRL, 1.10 ± 0.17, n = 9, t = 0.594, p = 0.56; COC CTRL, 0.597 ± 0.18, n = 14, t = 2.24, p = 0.034) and performance was impaired in cocaine-treated mice following D1 rescue (0.49 ± 0.06, n = 8, t = 8.67, p < 0.001), while D2 rescue normalized the break point (1.05 ± 0.18, n = 9, t = 0.26, p = 0.801). (G–J) Free access task (G) track plots of a saline- (top) and cocaine-treated mouse (bottom) during the free access task. (H) There was no effect of cocaine or intervention on reward zone entries. (I) Cocaine-treated mice spent less time in the reward zone during the test relative to baseline (SAL CTRL, 1.00 ± 0.097, n = 9, t = 0.01, p = 0.99; COC CTRL, 0.79 ± 0.06, n = 14, t = 3.47, p = 0.002) and performance was impaired following D1 rescue (SAL, 0.72 ± 0.11, n = 6, t = 2.47, p = 0.032; COC, 0.65 ± 0.13, n = 8, t = 2.69, p = 0.0176), while D2 rescue normalized the break point in cocaine-treated mice (1.07 ± 0.18, n = 9, t = 0.38, p = 0.71). (J) Hedonic tongue protrusions were reduced relative to baseline in cocaine-treated mice (0.582 ± 0.091, n = 14, t = 4.59, p < 0.001) and mice that had D1 rescue protocol (0.627 ± 0.15, n = 8, t = 2.85, p = 0.013); mice with the D2 rescue protocol were not impaired relative to baseline (0.92 ± 0.22, n = 9, t = 0.36, p = 0.727). *p < 0.05, **p < 0.01, ***p < 0.001 by t test comparing locomotor response to cocaine challenge (B and C) or normalized response to null hypothesis (F and H–J). All plots are mean ± SEM. Related to Figures S5–S8 and Table S1.

References

    1. Alexander GE, Crutcher MD, and DeLong MR (1990). Basal ganglia-thalamocortical circuits: parallel substrates for motor, oculomotor, “prefrontal” and “limbic” functions. Prog. Brain Res 85, 119–146. - PubMed
    1. Barnea-Ygael N, Gal R, and Zangen A. (2016). Chronic cocaine administration induces long-term impairment in the drive to obtain natural reinforcers in high- but not low-demanding tasks. Addict. Biol 21, 294–303. - PubMed
    1. Barr AM, and Phillips AG (1999). Withdrawal following repeated exposure to d-amphetamine decreases responding for a sucrose solution as measured by a progressive ratio schedule of reinforcement. Psychopharmacology (Berl.) 141, 99–106. - PubMed
    1. Berridge KC (2000). Measuring hedonic impact in animals and infants: microstructure of affective taste reactivity patterns. Neurosci. Biobehav. Rev 24, 173–198. - PubMed
    1. Bertran-Gonzalez J, Bosch C, Maroteaux M, Matamales M, Hervé D, Valjent E, and Girault JA (2008). Opposing patterns of signaling activation in dopamine D1 and D2 receptor-expressing striatal neurons in response to cocaine and haloperidol. J. Neurosci 28, 5671–5685. - PMC - PubMed

MeSH terms