. 2016 Oct 5;92(1):240-251.
doi: 10.1016/j.neuron.2016.09.003. Epub 2016 Sep 22.

Gamma-Rhythmic Gain Modulation

Affiliations

Gamma-Rhythmic Gain Modulation

Jianguang Ni et al. Neuron. .

Abstract

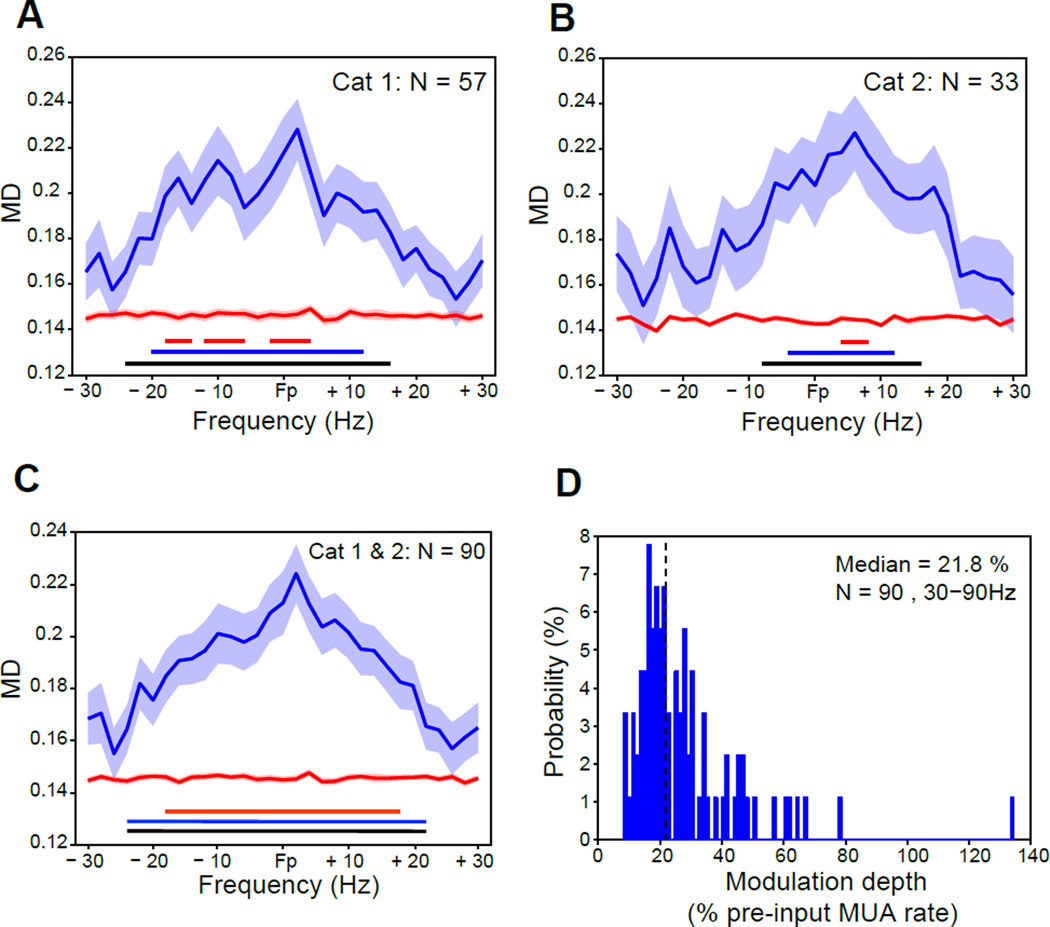
Cognition requires the dynamic modulation of effective connectivity, i.e., the modulation of the postsynaptic neuronal response to a given input. If postsynaptic neurons are rhythmically active, this might entail rhythmic gain modulation, such that inputs synchronized to phases of high gain benefit from enhanced effective connectivity. We show that visually induced gamma-band activity in awake macaque area V4 rhythmically modulates responses to unpredictable stimulus events. This modulation exceeded a simple additive superposition of a constant response onto ongoing gamma-rhythmic firing, demonstrating the modulation of multiplicative gain. Gamma phases leading to strongest neuronal responses also led to shortest behavioral reaction times, suggesting functional relevance of the effect. Furthermore, we find that constant optogenetic stimulation of anesthetized cat area 21a produces gamma-band activity entailing a similar gain modulation. As the gamma rhythm in area 21a did not spread backward to area 17, this suggests that postsynaptic gamma is sufficient for gain modulation.

Keywords: Channelrhodopsin; attention; communication-through-coherence (CTC); effective connectivity; gain; gamma; oscillation; rhythm; synchronization; visual cortex.


Figures

Figure 1
Figure 1. Visually induced MUA Responses, LFP Power and Event-related Potentials in Awake Macaque V4
(A and B) MUA firing rate, smoothed with a Gaussian kernel (SD = 12.5 ms, truncated at ±2 SD). (C and D) Percentage LFP power change relative to the pre-stimulus baseline period from 0.5 to 0.25 s before stimulus onset. (E and F) Event-related potentials (ERPs), i.e. time-domain averages of the LFP across trials. (A, C, E) Temporal modulation around stimulus onset. (B, D, F) Temporal modulation around stimulus color change. (A–F) All panels show grand averages over all 94 recording sites in both monkeys. (A, B, E, F) Shaded regions around the lines indicate ±1 SEM across recording sites. See also Figure S1.
Figure 2
Figure 2. Example Analysis of Response Modulation by Pre-input Phase in Awake Macaque V4
(A) The top panel shows the ERP that was evoked in an example recording site by stimulus changes. The bottom panel shows the corresponding inter-trial coherence (ITC) at 10 Hz, together with the significance threshold, indicating the first change-evoked response at 42 ms after stimulus change. (B) Each gray spoke represents the pre-input LFP phase for the gamma band (50 Hz) in one trial (see Experimental Procedures for details of phase estimation). Trials were grouped into six phase bins. For each phase bin, the 75 trials with phases closest to the phase-bin center were chosen for further processing. (C) Blue line: MUA response as a function of pre-input gamma phase. After phase binning, both, the gamma phases and the corresponding MUA responses were averaged over the trials assigned to the respective phase bin. Red line: Same as blue line, but showing the additive MUA response component. (D) Colored dots: Multiplicative MUA response component, obtained by subtracting the additive MUA response component from the (total) MUA response. The smooth blue curve represents a cosine fit. The cosine modulation depth (MD) is quantified as indicated.
Figure 3
Figure 3. Gain Modulation is Prominent for the Gamma Rhythm in Awake Macaque V4
(A) Blue curve: Modulation depth of the multiplicative MUA response component as a function of the frequency, for which the pre-input phase was determined. Average over all 71 sites of monkey P after z-transformation per site (see Experimental Procedures). Red curve: Bias estimate. Shaded regions indicate ±1 SEM. Horizontal lines at bottom of plot indicate significance level after correction for multiple comparisons across frequencies: Black lines for p<0.05; blue lines for p<0.01; red lines for p<0.001. (B) Same format as (A), averaged over all 23 sites of monkey R. (C) Same format as (A), averaged over all 94 sites of both monkeys combined. (D) Histogram of modulation depths of the multiplicative MUA response component, expressed as percentage of pre-input MUA rate. Blue histogram on top shows values obtained with binning according to pre-input phase in the gamma-frequency range found significant in (C), i.e. 40–66 Hz; red histogram on bottom shows values obtained with binning according to pre-input phase in the alpha-beta-frequency range found significant in (C), i.e. 10–14 Hz. Dashed vertical lines indicate median values.
Figure 4
Figure 4. In Awake Macaque V4, Gamma Phase Modulates Reaction Time, and Similar Gamma Phases Lead to Short Behavioral Reaction Times and Strong Neuronal Responses
(A) Blue: Modulation depth of behavioral reaction times (RTs) by pre-input phase (after z-transformation of RTs per session, by subtraction of mean and division by standard deviation across trials in a session). Red: Bias estimate. Shaded regions indicate ±1 SEM. The black horizontal bar on the bottom indicates significant modulation in the gamma band from 48 to 52 Hz (p<0.05, non-parametric permutation test, corrected for multiple comparisons across frequencies). (B) Distribution of the modulation depths of RTs by pre-input 48–52 Hz phase. (C) The cosine of the difference (Δ) between phases leading to shortest RTs and phases leading to strongest neuronal responses. Cosine values close to one indicate that phases leading to short RTs are close to phases leading to strong neuronal responses. For the frequency range of 48–52 Hz (red dots), phase differences are significantly non-uniform (P=0.03), with an average phase difference of merely 15.3 deg. (A–C) All plots combine the data of both monkeys (N=29 sessions).
Figure 5
Figure 5. Viral Injection and Expression; Optogenetically and Visually Induced Modulation of MUA, LFP Power and Event-related Potentials in Anesthetized Cat Area 21a
(A) In an initial surgery, the viral vector AAV9-CamKIIα-hChR2(H134R)-eYFP was injected into cat area 21a. After four to six weeks of expression, 473 nm Laser light was applied through a fiber placed above area 21a, visual stimuli were shown and electrophysiological recordings performed from area 21a. (B) Example histological section, showing the distribution of eYFP-labeled neurons in area 21a through fluorescence microscopy. (C) Responses of one example recording site during optogenetic and visual stimulation as indicated by the horizontal lines above the top panel. Laser stimulation commenced first, followed one second later by visual stimulation. Top panel: MUA firing rate. Middle panel: LFP power. Bottom panel: Event-related potential. The shaded regions around the lines in the top and bottom panels indicate ±1 SEM; they are hardly visible behind the actual lines. See also Figure S2.
Figure 6
Figure 6. Optogenetic Stimulation of Area 21a Induces Gamma in Area 21a and Not in Area 17, in the Anesthetized Cat
(A) Spike-LFP locking in area 21a (blue) and area 17 (red) during optogenetic stimulation of area 21a in the absence of visual stimulation. Each line shows the average over all respective recording sites of cat 1 (Area 21a: N=57; area 17: N=11). Shaded regions indicate ±1 SEM. (B) Same as (A), but showing the averages over all respective recording sites of cat 2 (Area 21a: N=33; area 17: N=38).
Figure 7
Figure 7. Gain Modulation by Optogenetically Induced Gamma in the Anesthetized Cat
(A) Blue curve: Modulation depth of the multiplicative MUA response component as a function of the frequency, for which the pre-input phase was determined. Average over all 57 recording sites in area 21a of cat 1 after z-transformation per site (see Experimental Procedures). Per recording site, the spectral analysis was aligned to the gamma peak frequency (Fp) induced at that site by optogenetic stimulation (see Figure S3). The x-axis shows frequencies relative to Fp. Red curve: Bias estimate. Shaded regions indicate ±1 SEM. Horizontal lines at bottom of plot indicate significance level after correction for multiple comparisons across frequencies: Black lines for p<0.05; blue lines for p<0.01; red lines for p<0.001. (B) Same format as (A), averaged over all 33 area 21a sites of cat 2. (C) Same format as (A), averaged over all 90 area 21a sites of both cats combined. (D) Histogram of modulation depths of the multiplicative MUA response component, expressed as percentage of pre-input MUA rate. Dashed vertical line shows median. See also Figure S3.

References

    1. Atallah BV, Scanziani M. Instantaneous modulation of gamma oscillation frequency by balancing excitation with inhibition. Neuron. 2009;62:566–577. - PMC - PubMed
    1. Azouz R, Gray CM. Adaptive coincidence detection and dynamic gain control in visual cortical neurons in vivo. Neuron. 2003;37:513–523. - PubMed
    1. Bastos AM, Vezoli J, Bosman CA, Schoffelen JM, Oostenveld R, Dowdall JR, De Weerd P, Kennedy H, Fries P. Visual areas exert feedforward and feedback influences through distinct frequency channels. Neuron. 2015a;85:390–401. - PubMed
    1. Bastos AM, Vezoli J, Fries P. Communication through coherence with interareal delays. Current opinion in neurobiology. 2015b;31:173–180. - PubMed
    1. Berens P. CircStat: A MATLAB Toolbox for Circular Statistics. J Stat Softw. 2009;31:1–21.