

Parametric analysis of colony morphology of non-labelled live human pluripotent stem cells for cell quality control
- PMID: 27667091
- PMCID: PMC5036041
- DOI: 10.1038/srep34009
Parametric analysis of colony morphology of non-labelled live human pluripotent stem cells for cell quality control
Abstract
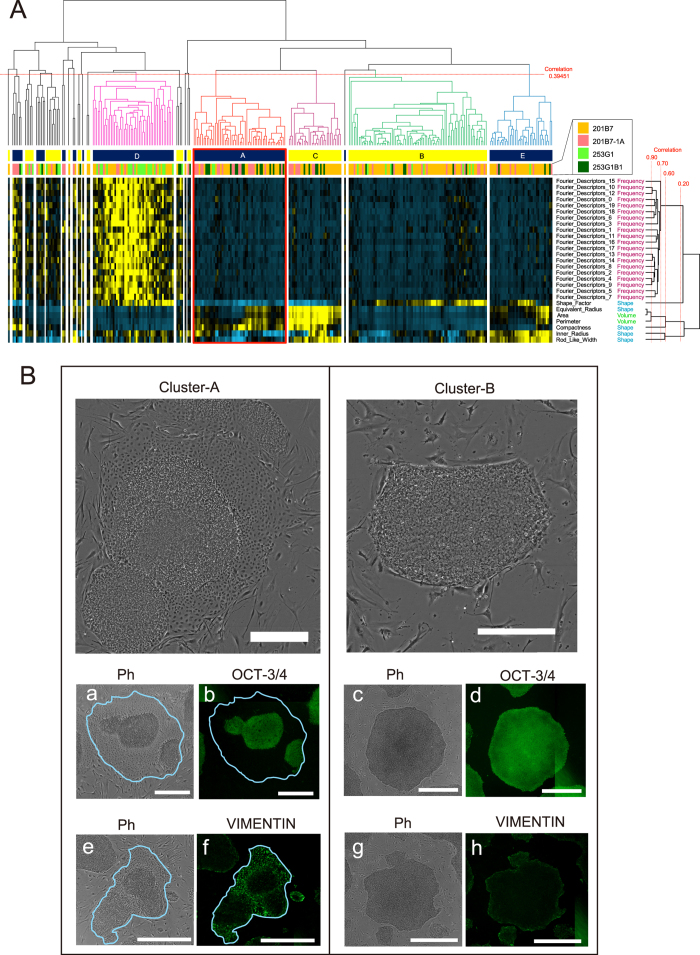
Given the difficulties inherent in maintaining human pluripotent stem cells (hPSCs) in a healthy state, hPSCs should be routinely characterized using several established standard criteria during expansion for research or therapeutic purposes. hPSC colony morphology is typically considered an important criterion, but it is not evaluated quantitatively. Thus, we designed an unbiased method to evaluate hPSC colony morphology. This method involves a combination of automated non-labelled live-cell imaging and the implementation of morphological colony analysis algorithms with multiple parameters. To validate the utility of the quantitative evaluation method, a parent cell line exhibiting typical embryonic stem cell (ESC)-like morphology and an aberrant hPSC subclone demonstrating unusual colony morphology were used as models. According to statistical colony classification based on morphological parameters, colonies containing readily discernible areas of differentiation constituted a major classification cluster and were distinguishable from typical ESC-like colonies; similar results were obtained via classification based on global gene expression profiles. Thus, the morphological features of hPSC colonies are closely associated with cellular characteristics. Our quantitative evaluation method provides a biological definition of 'hPSC colony morphology', permits the non-invasive monitoring of hPSC conditions and is particularly useful for detecting variations in hPSC heterogeneity.
Conflict of interest statement
H.K., T.U. and Y.K. are employed by Nikon Corporation. BioStation CT and related software used in the present study are marketed products of Nikon Corporation. R.K. is one of the primary investigators on 7 patents (pending) related to basic algorithm technologies for cellular image processing. The other authors report no conflicts of interest.
Figures

Similar articles
-
Development of a Monitoring Method for Nonlabeled Human Pluripotent Stem Cell Growth by Time-Lapse Image Analysis.Stem Cells Transl Med. 2015 Jul;4(7):720-30. doi: 10.5966/sctm.2014-0242. Epub 2015 May 13. Stem Cells Transl Med. 2015. PMID: 25972146 Free PMC article.
-
Exploring the effects of cell seeding density on the differentiation of human pluripotent stem cells to brain microvascular endothelial cells.Fluids Barriers CNS. 2015 May 21;12:13. doi: 10.1186/s12987-015-0007-9. Fluids Barriers CNS. 2015. PMID: 25994964 Free PMC article.
-
A Universal and Robust Integrated Platform for the Scalable Production of Human Cardiomyocytes From Pluripotent Stem Cells.Stem Cells Transl Med. 2015 Dec;4(12):1482-94. doi: 10.5966/sctm.2014-0275. Epub 2015 Oct 28. Stem Cells Transl Med. 2015. PMID: 26511653 Free PMC article.
-
The safety of human pluripotent stem cells in clinical treatment.Ann Med. 2015;47(5):370-80. doi: 10.3109/07853890.2015.1051579. Epub 2015 Jul 6. Ann Med. 2015. PMID: 26140342 Review.
-
Lessons from the heart: mirroring electrophysiological characteristics during cardiac development to in vitro differentiation of stem cell derived cardiomyocytes.J Mol Cell Cardiol. 2014 Feb;67:12-25. doi: 10.1016/j.yjmcc.2013.12.011. Epub 2013 Dec 23. J Mol Cell Cardiol. 2014. PMID: 24370890 Review.
Cited by
-
Cells/colony motion of oral keratinocytes determined by non-invasive and quantitative measurement using optical flow predicts epithelial regenerative capacity.Sci Rep. 2021 May 17;11(1):10403. doi: 10.1038/s41598-021-89073-y. Sci Rep. 2021. PMID: 34001929 Free PMC article.
-
Morphological Signal Processing for Phenotype Recognition of Human Pluripotent Stem Cells Using Machine Learning Methods.Biomedicines. 2023 Nov 9;11(11):3005. doi: 10.3390/biomedicines11113005. Biomedicines. 2023. PMID: 38002005 Free PMC article.
-
Effect of mechanical vibration stress in cell culture on human induced pluripotent stem cells.Regen Ther. 2019 Jun 6;12:27-35. doi: 10.1016/j.reth.2019.05.002. eCollection 2019 Dec 15. Regen Ther. 2019. PMID: 31890764 Free PMC article.
-
An efficient simplified method for the generation of corneal epithelial cells from human pluripotent stem cells.Hum Cell. 2022 Jul;35(4):1016-1029. doi: 10.1007/s13577-022-00713-5. Epub 2022 May 12. Hum Cell. 2022. PMID: 35553384
-
Atorvastatin Inhibits the HIF1α-PPAR Axis, Which Is Essential for Maintaining the Function of Human Induced Pluripotent Stem Cells.Mol Ther. 2018 Jul 5;26(7):1715-1734. doi: 10.1016/j.ymthe.2018.06.005. Epub 2018 Jun 19. Mol Ther. 2018. PMID: 29929789 Free PMC article.
References
-
- Thomson J. A. et al. Embryonic stem cell lines derived from human blastocysts. Science 282, 1145–1147 (1998). - PubMed
LinkOut - more resources
Full Text Sources
Other Literature Sources
