. 2016 Sep 28;3(3):252-263.e8.
doi: 10.1016/j.cels.2016.08.007. Epub 2016 Sep 22.

Vimentin Intermediate Filaments Template Microtubule Networks to Enhance Persistence in Cell Polarity and Directed Migration

Affiliations

Vimentin Intermediate Filaments Template Microtubule Networks to Enhance Persistence in Cell Polarity and Directed Migration

Zhuo Gan et al. Cell Syst. .

Erratum in

Abstract

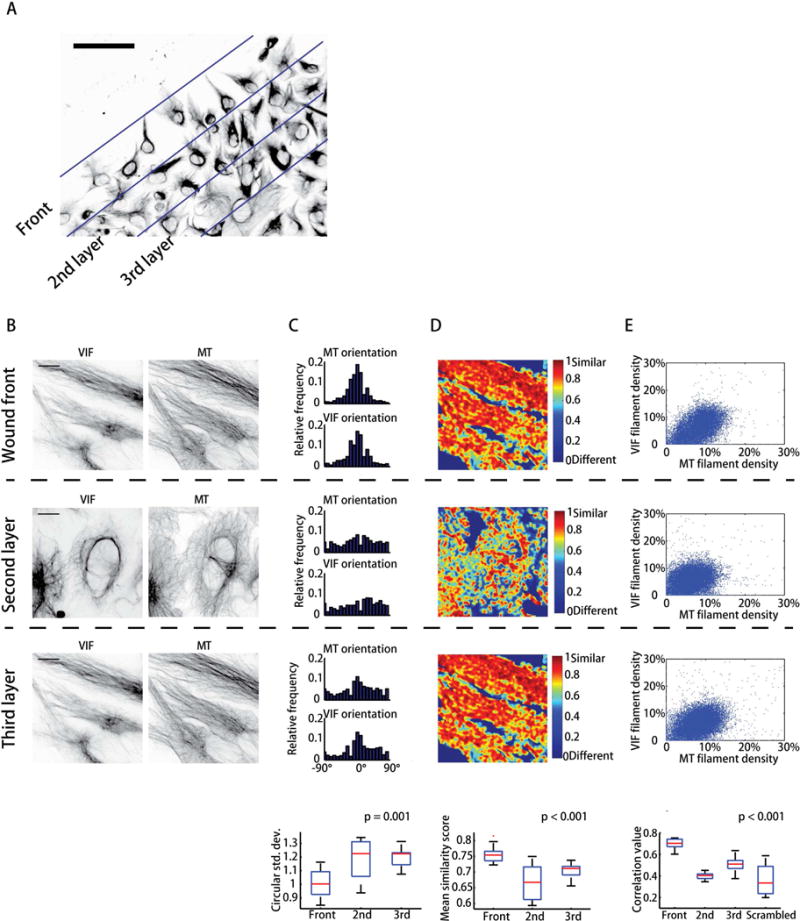
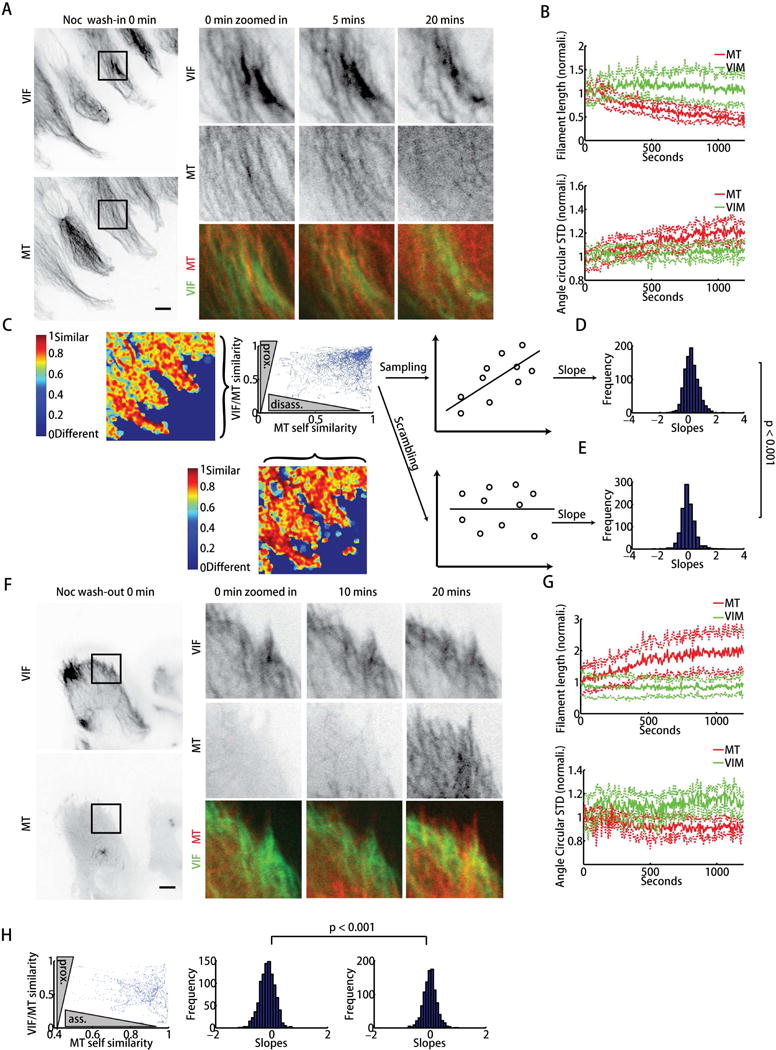
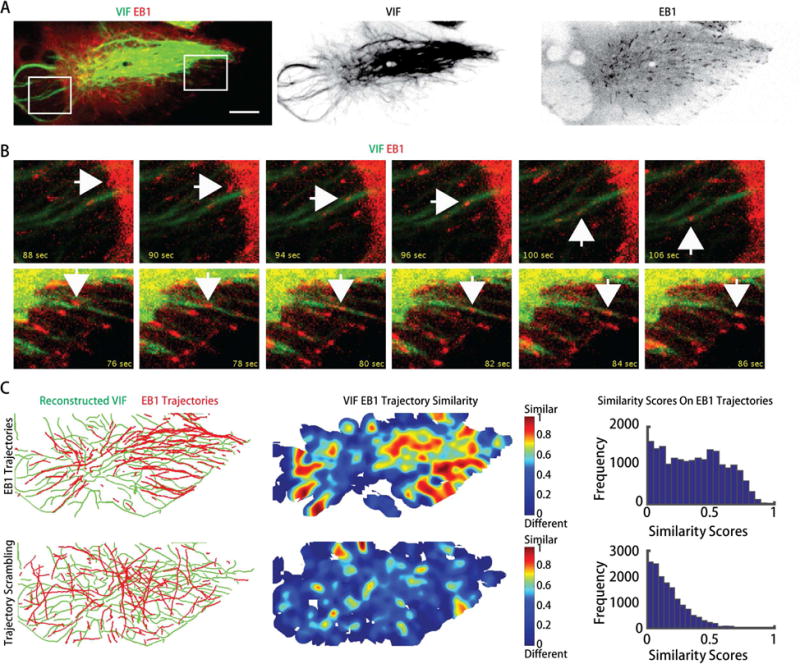
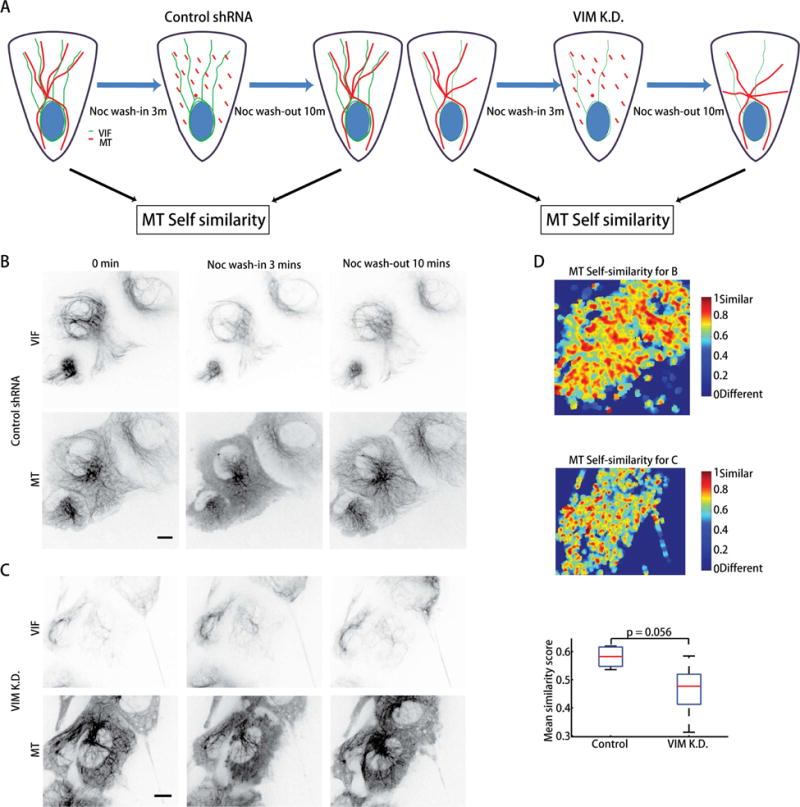
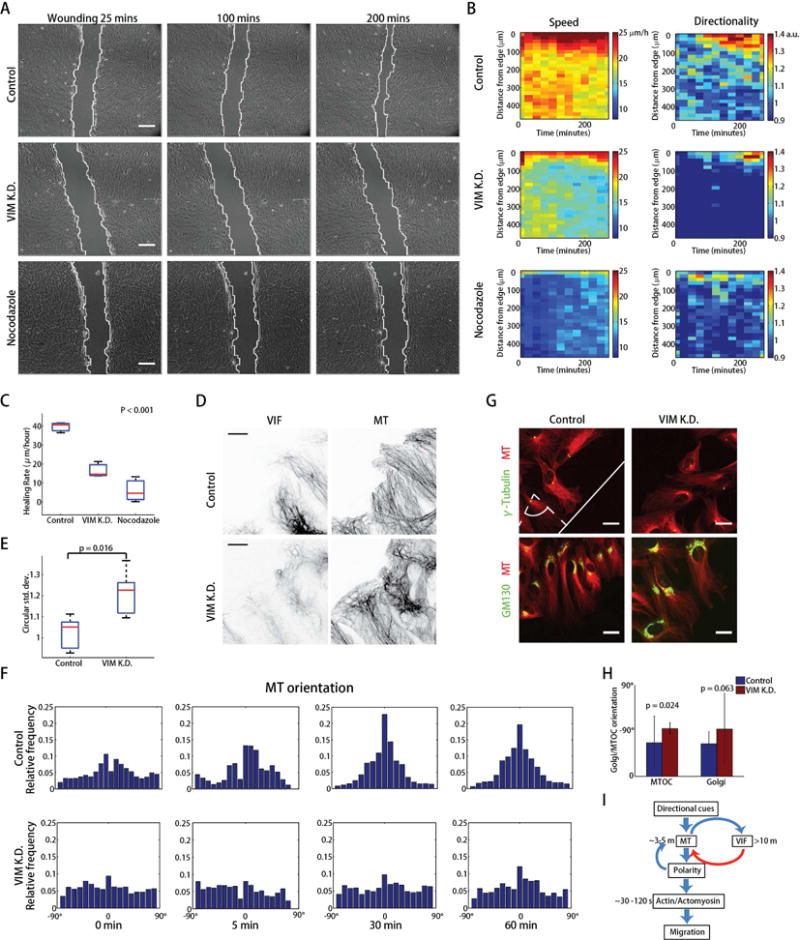
Increased expression of vimentin intermediate filaments (VIFs) enhances directed cell migration, but the mechanism behind VIFs' effect on motility is not understood. VIFs interact with microtubules, whose organization contributes to polarity maintenance in migrating cells. Here, we characterize the dynamic coordination of VIF and microtubule networks in wounded monolayers of retinal pigment epithelial cells. By genome editing, we fluorescently labeled endogenous vimentin and α-tubulin, and we developed computational image analysis to delineate architecture and interactions of the two networks. Our results show that VIFs assemble an ultrastructural copy of the previously polarized microtubule network. Because the VIF network is long-lived compared to the microtubule network, VIFs template future microtubule growth along previous microtubule tracks, thus providing a feedback mechanism that maintains cell polarity. VIF knockdown prevents cells from polarizing and migrating properly during wound healing. We suggest that VIFs' templating function establishes a memory in microtubule organization that enhances persistence in cell polarization in general and migration in particular.


Figures

Figure 1
Figure 1
Quantitative live cell imaging and analysis of vimentin (VIF) and microtubule interactions. (A) Left, schematic of cytoskeleton organization in a polarized, migrating cell. Propulsion of the cell front is driven by polymerization of a dense network of actin filament. Net traction of the cell body is enabled by a front-rear gradient in adhesion and contraction of cortex and actomyosin bundles aligned with the axis of migration. The vectorial asymmetry of the actomyosin and adhesion machineries depends on spatiotemporal orchestration of many signaling cues, which are organized to a large extent by a dynamic microtubule network, partly in response to extracellular guidance cues. Right, hierarchy of events leading to cell polarization and directed migration. The VIF network, which constitutes the third cytoskeleton component in mesenchymal cell migration, assembles along microtubules. Hence, VIF establish a structure copy of the microtubule network with 4–5 fold slower turnover (>10 minutes for VIF, 3–5 minutes for microtubules). (B) Genome-edited RPE cells expressing mEmerald-vimentin and mTagRFPt-α-tubulin under the control of the endogenous promotor during wound healing response. Scale bar: 50 μm. (C) Zoom of the VIF and MT networks in a cell at the wound edge. Scale bar: 10 μm. (D–J) Image analysis pipeline for cytoskeleton network reconstruction: (D) Raw image of mTagRFPt-α-tubulin. Scale bar: 10 μm; (E) Output of steerable filtering applied to D; (F) Non-maximum suppression of filter response in E; (G) Raw image overlaid by non-maximum suppression output color-coded by the local filament orientation (the orientation vertical to the wound sets the zero degree direction); (H) Zoomed view of boxed area in G. Black arrows indicate gaps between segments that belong to the same filament; (I) Reconstructed filaments after graph matching to bridge gaps (white arrows); (J) Reconstructed VIF (green) and microtubule filaments (red).
Figure 2
Figure 2
VIF and MT networks are co-aligned in cells at the wound edge. (A) Definition of bands in wounded1 cell monolayer with increasing distances from the wound edge. (B) VIF and MT raw images in different layers. (C) Distributions of local orientation in three bands. Bottom of column: ANOVA of circular standard deviation of orientation distribution (n = 30 cells). (D) Score map of VIF/microtubule network similarity. Bottom of column: ANOVA of mean of network similarity score (n = 30 cells). (E) Scatter plot of VIF vs. MT filament densities. Bottom of column: ANOVA for filament density correlation values (n = 30 cells).
Figure 3
Figure 3
VIF stabilizes MTs and guides MT re-growth. (A) Confluent RPE cell monolayers were scratched, incubated with nocodazole and imaged. Top, bottom, representative images of mEmerald-vimentin and mTagRFPt-α-tubulin at different time points as indicated (Movie S3). t = 0 indicates time point of nocodazole addition to the medium. Scale bar: 10 μm. (B) Time courses of mean normalized filament lengths and circular standard deviations of orientation from n = 7 live experiments; solid lines: mean of total (normalized) filament lengths and circular standard deviations; dotted lines represent the 95% confidence interval about mean. (C) Scatter plot of VIF/MT network similarity (higher similarity means higher proximity and alignment of the two networks) 4 minutes after nocodazole addition vs. MT self-similarity (lower self-similarity means more disassembly) between 4–5 minutes after nocodazole addition. (D) 10 data points were randomly sampled in C to determine the correlation (slope of fit line) between the two similarity score sets. Distribution of slopes calculated from 1000 sampling repeats. (E) 10 data points were randomly sampled in C and scrambled to determine the distribution of random slopes. The distributions in E and F were compared by the Kolmogorov -Smirnov test (p < 0.001). (F) Confluent RPE monolayers were scratched and incubated with nocodazole for 20 minutes and then washed out. Top, bottom, representative images of mEmerald-vimentin and mTagRFPt-α-tubulin at different time points after nocodazole wash-out as indicated (Movie S5). t = 0 indicates time point of nocodazole wash-out. Scale bar: 10 μm. (G) Time courses of the mean normalized filament lengths and circular standard deviations of orientation distribution from n = 7 live experiments; solid lines: mean of total (normalized) filament lengths and circular standard deviations; dotted lines represent 95% confidence interval about mean. (H) Scatter plot of VIF/MT network similarity 5 minutes after nocodazole wash-out vs MT self-similarity (lower self-similarity means more assembly) between 4–5 minutes after nocodazole wash-out. The distribution of slopes obtained from 1000 line fits to independent samplings of 10 data points and the slope distribution of 1000 scrambled samples. The two distributions were compared by the Kolmogorov -Smirnov test (p < 0.001).
Figure 4
Figure 4
Microtubule plus ends grow along VIF. (A) mEmerald-vimentin genome-edited RPE cells were transfected with mTagRFP-EB1. Confluent monolayers were scratched and imaged (Movie S7). Scale bar: 10 μm. (B) representative images of the boxed regions in (A) at different time points as indicated (Movies S8, S9). White arrows indicate that EB1 trajectories align with VIF. (C) Top, the VIF and EB1 trajectories were reconstructed (left panel). Similarity between the VIF networks and EB1 trajectories were calculated (middle panel). Bottom, EB1 trajectories were scrambled (left panel). Similarity between the VIF networks and scrambled EB1 trajectories were calculated (the middle panel). The similarity scores along scrambled EB1 trajectories (bottom, right panel) are much lower than scores along unscrambled EB1 trajectories (top, right panel, n = 4 cells).
Figure 5
Figure 5
VIF network templates microtubule network. (A) Experimental procedure to establish a causal link between VIF expression and guidance of microtubule growth. (B, C) hTERT-RPE-1 mEmerald-vimentin/mTagRFPt-α-tubulin cells at the wound edge without (B) and with (C) knockdown of vimentin were incubated with nocodazole for 3 minutes and then washed out while being imaged. Top, bottom, representative images of mEmerald-vimentin and mTagRFPt-α-tubulin at different time points, as indicated (Movies S10, S11). Scale bar: 10 μm. (D) Top, microtubule self-similarity map before nocodazole incubation (0 mins) and 10 mins after nocodazole wash-out for control RPE cells. Middle, microtubule self-similarity map before nocodazole incubation (0 mins) and 10 mins after nocodazole wash-out for RPE cells with vimentin knockdown. Bottom, boxplot for the mean microtubule self-similarity scores of control and vimentin-knockdown cells (n = 5 experiments). Comparison of score distributions by Wilcoxon rank sum test.
Figure 6
Figure 6
VIF stabilize microtubule network organization and enhance cell polarity in directed cell migration. (A) Wound healing response over 200 mins in control, vimentin-knockdown and nocodazole treated RPE cells as indicated (Movie S12). Scale bar: 200 μm. (B) Kymographs (distance from cell edge vs time) of migration speed and directionality. (C) ANOVA of healing rates (n = 3 experiments). (D) Microtubule and VIF organization in control and vimentin-knockdown RPE cells at the wound edge. Scale bar: 10 μm. (E) Boxplot of circular standard deviations of orientation distribution (n = 5 experiments). The p-value of the Wilcoxon rank sum test is shown. (F) Histograms of microtubule orientation in control and vimentin-knockdown RPE cells at different time points after scratching (Movie S13 and S14). (G) Golgi and γ-tubulin staining in control and vimentin-knockdown RPE cells at the wound edge (n = 30 cells). Scale bar: 20 μm. (H) Analysis of Golgi and γ-tubulin orientation with respect to the wound edge in control and vimentin knockdown RPE cells. The p-value of the Wilcoxon rank sum test is shown. (I) Model of VIF templating microtubules with positive feedback between microtubule structure and VIF assembly conferring increased persistence in cellular polarity and directed migration.

References

    1. Applegate KT, Besson S, Matov A, Bagonis MH, Jaqaman K, Danuser G. plusTipTracker: Quantitative image analysis software for the measurement of microtubule dynamics. J Struct Biol. 2011;176:168–184. - PMC - PubMed
    1. Bowen JR, Hwang D, Bai X, Roy D, Spiliotis ET. Septin GTPases spatially guide microtubule organization and plus end dynamics in polarizing epithelia. The Journal of cell biology. 2011;194:187–197. - PMC - PubMed
    1. Carlson DF, Tan W, Lillico SG, Stverakova D, Proudfoot C, Christian M, Voytas DF, Long CR, Whitelaw CB, Fahrenkrug SC. Efficient TALEN-mediated gene knockout in livestock. Proceedings of the National Academy of Sciences of the United States of America. 2012;109:17382–17387. - PMC - PubMed
    1. Cermak T, Doyle EL, Christian M, Wang L, Zhang Y, Schmidt C, Baller JA, Somia NV, Bogdanove AJ, Voytas DF. Efficient design and assembly of custom TALEN and other TAL effector-based constructs for DNA targeting. Nucleic acids research. 2011;39:e82. - PMC - PubMed
    1. Chang L, Goldman RD. Intermediate filaments mediate cytoskeletal crosstalk. Nature reviews Molecular cell biology. 2004;5:601–613. - PubMed

Publication types