. 2016 Sep 26:7:12846.
doi: 10.1038/ncomms12846.

Extraction and analysis of signatures from the Gene Expression Omnibus by the crowd

Affiliations

Extraction and analysis of signatures from the Gene Expression Omnibus by the crowd

Zichen Wang et al. Nat Commun. .

Abstract

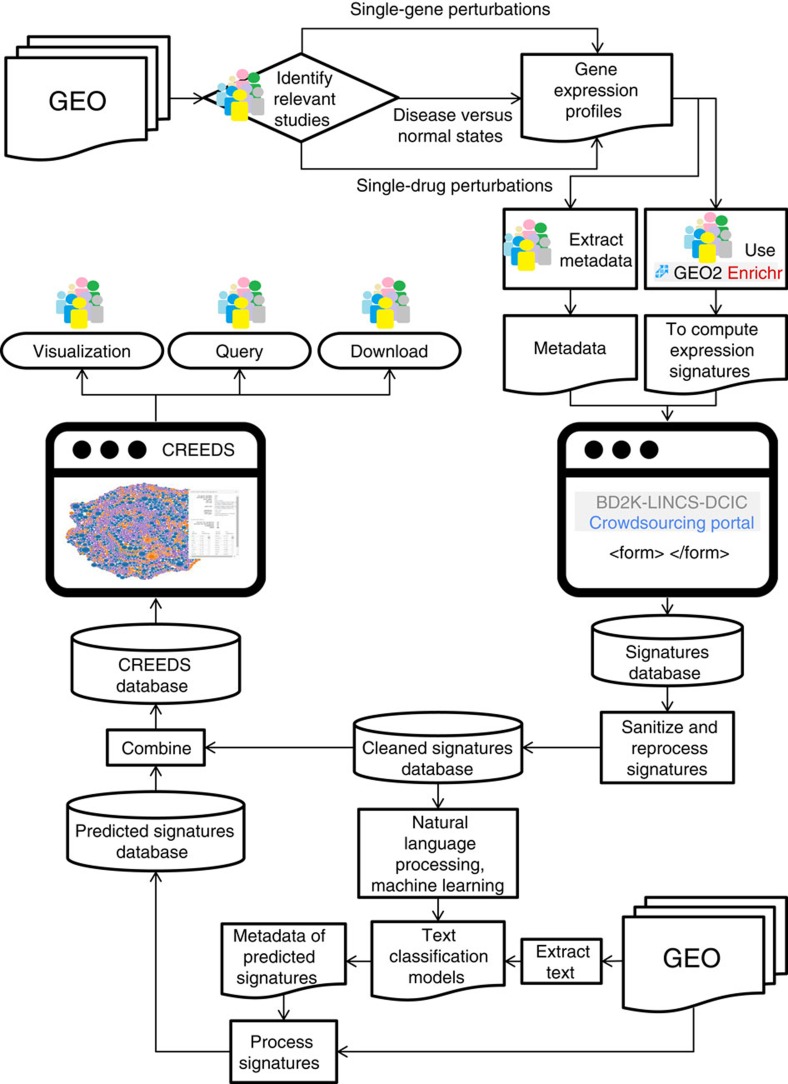
Gene expression data are accumulating exponentially in public repositories. Reanalysis and integration of themed collections from these studies may provide new insights, but requires further human curation. Here we report a crowdsourcing project to annotate and reanalyse a large number of gene expression profiles from Gene Expression Omnibus (GEO). Through a massive open online course on Coursera, over 70 participants from over 25 countries identify and annotate 2,460 single-gene perturbation signatures, 839 disease versus normal signatures, and 906 drug perturbation signatures. All these signatures are unique and are manually validated for quality. Global analysis of these signatures confirms known associations and identifies novel associations between genes, diseases and drugs. The manually curated signatures are used as a training set to develop classifiers for extracting similar signatures from the entire GEO repository. We develop a web portal to serve these signatures for query, download and visualization.


Figures

Figure 1
Figure 1. Workflow of the crowdsourcing project.
Participants identify relevant studies from GEO and then extract gene expression signatures using GEO2Enrichr. Participants also add metadata to each signature. Submitted signatures were manually reviewed and then used to scale up the collections with machine learning methods. All signatures are served on the CRowd Extracted Expression of Differential Signatures (CREEDS) web portal.
Figure 2
Figure 2. Batch effect correction influence on the quality of gene expression signatures.
Line plots show the probability density distribution of the scaled ranks of expected DEGs in gene expression signatures from the three collections: (a) single-gene perturbations, (b) disease signatures, and (c) single-drug perturbations. The colours indicate which algorithm was used to call the differentially expressed genes: Characteristic Direction (CD), limma, or fold change; and whether batch effect correction was applied with surrogate variable analysis (SVA).
Figure 3
Figure 3. Benchmarking signature connections with prior knowledge.
Signed Jaccard index and absolute Jaccard index are used to measure the similarity between signatures, and plotted in dashed and solid lines, respectively. Different methods for identifying differentially expressed genes include: the Characteristic Direction (CD), limma with Benjamini–Hochberg (BH) correction, and limma with Bonferroni correction. These are plotted in blue, orange and green, respectively. ROC curves are plotted for (a) recovering the same perturbed genes; (b) recovering similar diseases; and (c) recovering drugs with similar chemical structure.
Figure 4
Figure 4. Hierarchical clustering of the adjacency matrix of all gene expression signatures and selected clusters.
(a) The entire adjacency matrix of all signatures. (bd) Three selected zoomed-in views of clusters from the adjacency matrix displayed in (a).
Figure 5
Figure 5. Distributions of the ranks of matched perturbations between signatures from CREEDS and the LINCS L1000 dataset.
The highest ranks (a,c), and all ranks (b,d) of matched drugs (a,b) and matched genes (c,d) are presented. Drug perturbation signatures from CREEDS were queried against ∼30,000 significant drug perturbation signatures from the LINCS L1000 dataset; whereas gene perturbation signatures from CREEDS were queried against ∼110,000 gene perturbation signatures from the LINCS L1000 dataset.

References

    1. Barrett T. et al. NCBI GEO: archive for functional genomics data sets—update. Nucleic Acids Res. 41, D991–D995 (2013). - PMC - PubMed
    1. Rustici G. et al. ArrayExpress update—trends in database growth and links to data analysis tools. Nucleic Acids Res. 41, D987–D990 (2013). - PMC - PubMed
    1. Chang J. et al. SIGNATURE: A workbench for gene expression signature analysis. BMC Bioinformatics 12, 443 (2011). - PMC - PubMed
    1. Williams G. A searchable cross-platform gene expression database reveals connections between drug treatments and disease. BMC Genom. 13, 12 (2012). - PMC - PubMed
    1. Fujibuchi W., Kiseleva L., Taniguchi T., Harada H. & Horton P. CellMontage: similar expression profile search server. Bioinformatics 23, 3103–3104 (2007). - PubMed