. 2017 Jan:29:1-11.
doi: 10.1016/j.cellsig.2016.09.005. Epub 2016 Sep 23.

Role of End Binding Protein-1 in endothelial permeability response to barrier-disruptive and barrier-enhancing agonists

Affiliations

Role of End Binding Protein-1 in endothelial permeability response to barrier-disruptive and barrier-enhancing agonists

Xinyong Tian et al. Cell Signal. 2017 Jan.

Abstract

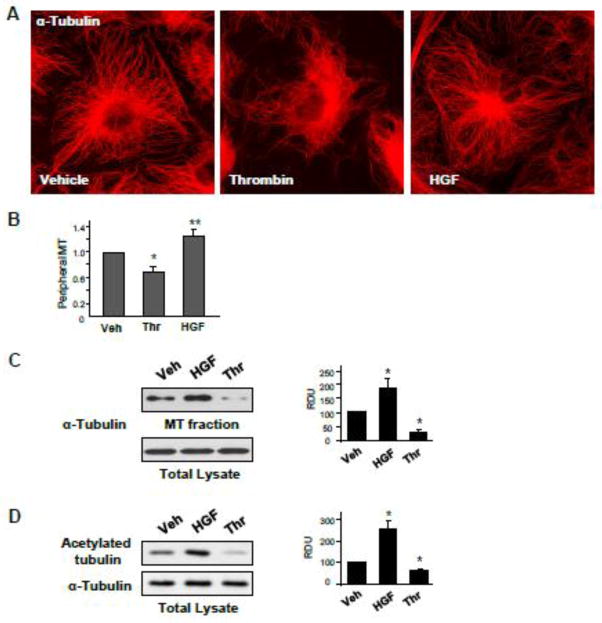
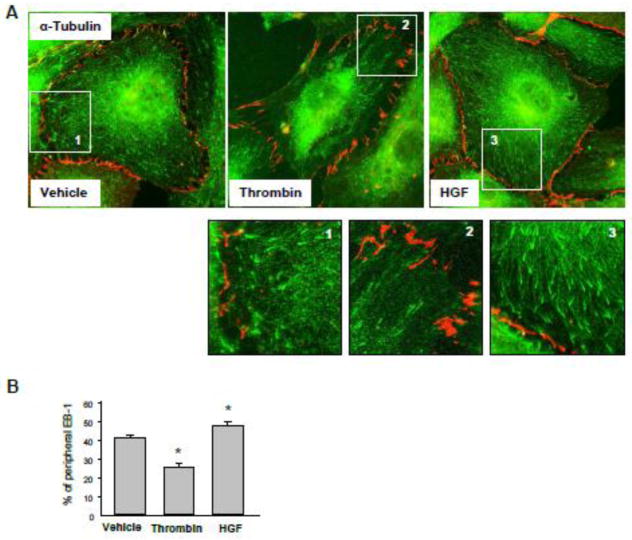
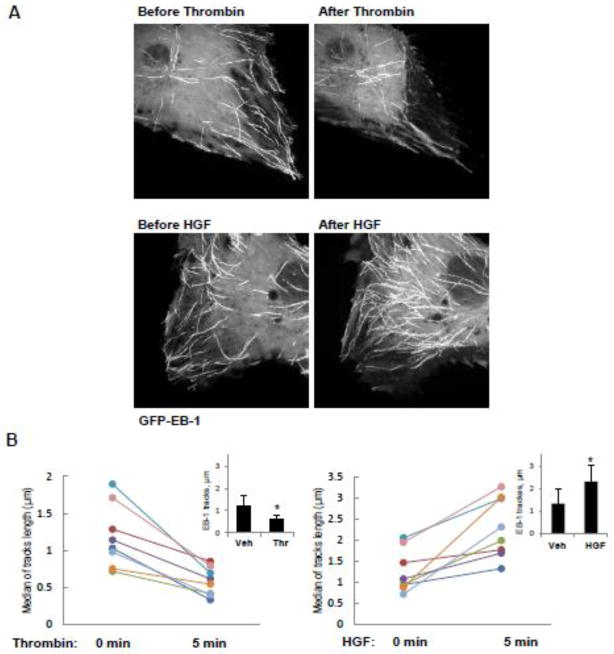
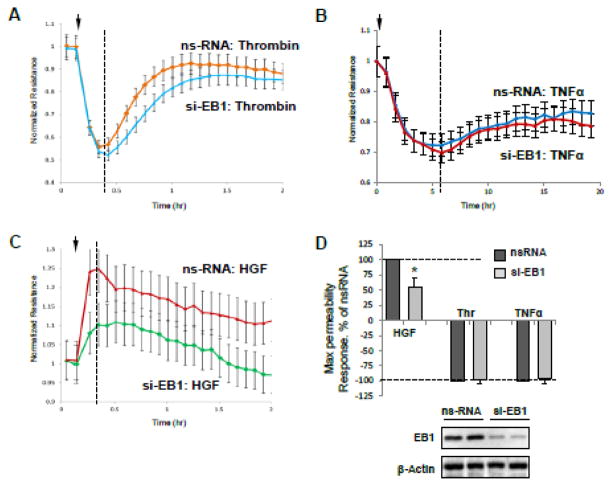
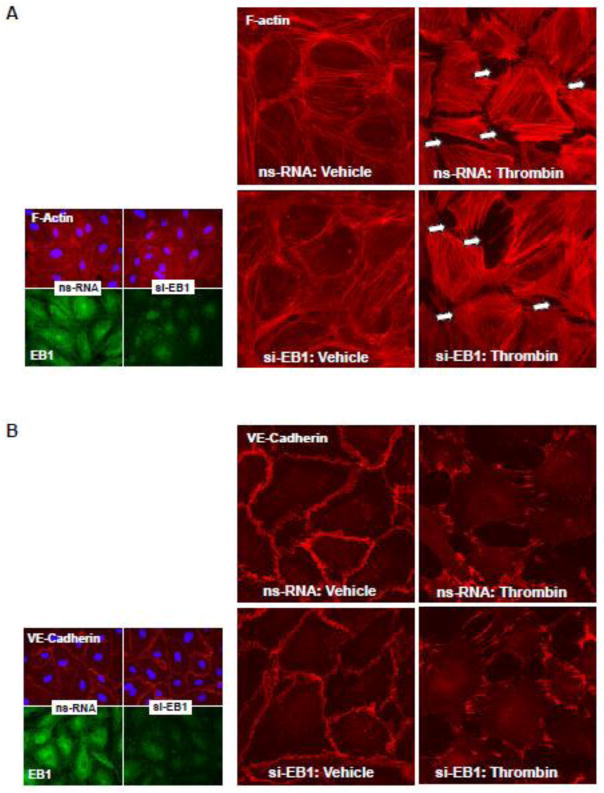
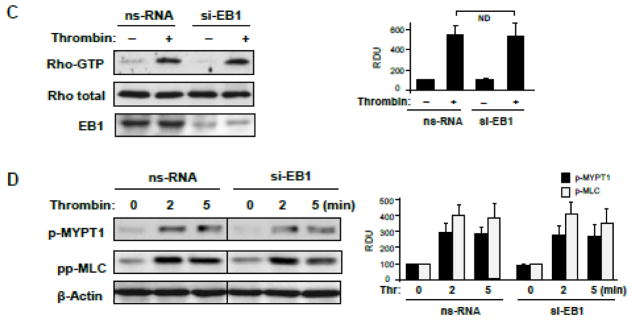
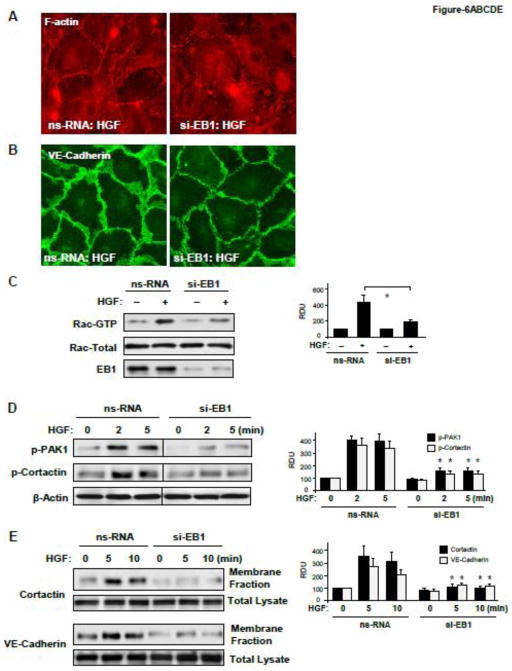
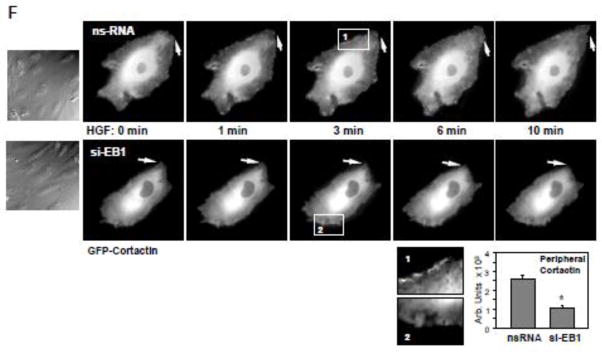
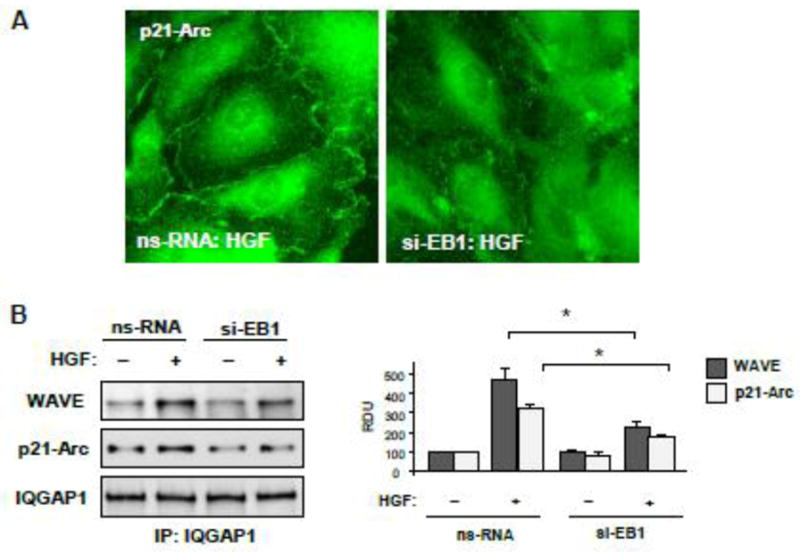
Rapid changes in microtubule (MT) polymerization dynamics affect regional activity of small GTPases RhoA and Rac1, which play a key role in the regulation of actin cytoskeleton and endothelial cell (EC) permeability. This study tested the role of End Binding Protein-1 (EB1) in the mechanisms of increased and decreased EC permeability caused by thrombin and hepatocyte growth factor (HGF) and mediated by RhoA and Rac1 GTPases, respectively. Stimulation of human lung EC with thrombin inhibited peripheral MT growth, which was monitored by morphological and biochemical evaluation of peripheral MT and the levels of stabilized MT. In contrast, stimulation of EC with HGF promoted peripheral MT growth and protrusion of EB1-positive MT plus ends to the EC peripheral submembrane area. EB1 knockdown by small interfering RNA did not affect partial MT depolymerization, activation of Rho signaling, and permeability response to thrombin, but suppressed the HGF-induced endothelial barrier enhancement. EB1 knockdown suppressed HGF-induced activation of Rac1 and Rac1 cytoskeletal effectors cortactin and PAK1, impaired HGF-induced assembly of cortical cytoskeleton regulatory complex (WAVE-p21Arc-IQGAP1), and blocked HGF-induced enhancement of peripheral actin cytoskeleton and VE-cadherin-positive adherens junctions. Altogether, these data demonstrate a role for EB1 in coordination of MT-dependent barrier enhancement response to HGF, but show no involvement of EB1 in acute increase of EC permeability caused by the barrier disruptive agonist. The results suggest that increased peripheral EB1 distribution is a critical component of the Rac1-mediated pathway and peripheral cytoskeletal remodeling essential for agonist-induced EC barrier enhancement.

Keywords: Cytoskeleton; GTPase; Microtubule dynamics; Permeability; Pulmonary endothelium.


Figures

Figure 1
Figure 1. Effects of thrombin and HGF on microtubule dynamics and stability
A and B - HPAEC grown on coverslips were stimulated with vehicle, thrombin (0.3 U/ml, 10 min), or HGF (50 ng/ml, 10 min) followed by immunofluorescence staining with an antibody against α-tubulin (A). Bar graph depicts results of quantitative analysis of peripheral microtubules in methanol-fixed EC; *P<0.05; n=4; 6 images from each experiment (B). C - HPAEC were stimulated with thrombin or HGF followed by fractionation assay. Content of polymerized tubulin in MT-enriched fraction and depolymerized tubulin in cytosolic fraction was determined by western blotting with α-tubulin antibodies. Results are represented as mean ± SD; *P<0.05; n=4. D – Effect of HGF and thrombin stimulation on the pool of stable MT was evaluated by western blot of whole cell lysates with antibody against acetylated tubulin. Equal tubulin content was confirmed by probing of membranes for α-tubulin. Results are representative of three independent experiments. Results are represented as mean ± SD; *P<0.05; n=4.
Figure 2
Figure 2. Effects of thrombin and HGF on EB1-positive MT tips distribution
A and B - HPAEC grown on coverslips were stimulated with vehicle, thrombin (0.3 U/ml, 10 min), or HGF (50 ng/ml, 10 min) followed by fixation with methanol and double immunofluorescence staining for EB1 (green) and Ve-cadherin (red). Insets show high magnification images of cell periphery areas with EB1-positive microtubule tips. VE-cadherin staining outlines cell borders. Results are representative of five independent experiments (A). Bar graph depicts results of quantitative analysis of peripheral EB1; *P<0.05; n=3; 10 images from each experiment (B).
Figure 3
Figure 3. Effects of thrombin and HGF on MT growth
A and B - Live cell imaging of HPAEC transfected with GFP-EB1 and stimulated with thrombin (0.3 U/ml, 10 min) or HGF (50 ng/ml, 10 min). Projection analysis of 20 consecutive images before and after treatment is shown (A). Graphs depict quantification of GFP-EB1 track length. Each pair of dots represents the median track length in a cell before and after thrombin or HGF stimulation (B). Insets: Bar graphs represent agonist-induced changes in EB1 tracks. Data are expressed as mean ± SD of four independent experiments, 6–8 cells for each experiment; *p<0.05.
Figure 4
Figure 4. Effect of EB1 knockdown on EC permeability response by thrombin and HGF
HPAEC grown on microelectrodes were transfected with 150 nM EB1-specific siRNA or non-specific RNA (ns-RNA) for 72 hrs. A - C - At the time point indicated by arrow, EC were stimulated with thrombin (0.3 U/ml) (A), TNFα (10 ng/ml) (B), or HGF (50 ng/ml) (C), and measurements of transendothelial resistance (TER) were performed over time. Presented TER measurements are normalized average resistance values +/− SE from three independent readings in one experiment, the data are representative of four independent experiments. D - Bar graphs depict results of quantitative analysis of permeability data; n=4, *P<0.05. Inset: western blot analysis of siRNA-induced EB1 protein depletion in permeability assays.
Figure 5
Figure 5. Effect of EB1 knockdown on thrombin-induced EC barrier disruption and Rho pathway activation
Human pulmonary EC were transfected with EB1-specific or non-specific siRNA. A and B - Cells plated onto glass coverslips were treated with thrombin (0.3 U/ml, 10 min). Effects of EB1 depletion on thrombin-induced actin cytoskeleton (A) and cell junction (B) remodeling was monitored by immunofluorescence staining with Texas-Red phalloidin and VE-cadherin antibody, respectively. Insets: control and EB1-depleted EC were stained for EB1 and F-actin (A) or EB1 and VE-cadherin actibodies (B). C - Thrombin-induced Rho activation was assessed by RhoGTP pulldown assay. The content of activated Rho was normalized to the total Rho content in cell lysates. SiRNA-induced EB1 protein depletion was confirmed by western blotting. D - Western blot analysis of thrombin-induced MYPT1 and MLC phosphorylation. Probing for β-actin was used as a normalization control. Bar graphs represent the results of quantitative densitometry of western blot panels in control and treated HPAEC monolayers. Data are expressed as mean ± SD of three independent experiments; *P<0.05.
Figure 6
Figure 6. Effect of EB1 knockdown on HGF-induced EC barrier enhancement and activation of Rac1 signaling
Human pulmonary EC were transfected with EB1-specific or non-specific siRNA. A and B - Cells grown on glass coverslips were treated with HGF (50 ng/ml, 10 min). Effects of EB1 depletion on HGF-induced actin cytoskeleton (A) and cell junction (B) remodeling was monitored by immunofluorescence staining with Texas-Red phalloidin and VE-cadherin antibody, respectively. C - Rac1 activation was determined by Rac GTPase pulldown assay. The content of activated Rac1 was normalized to the total protein content in EC lysates. SiRNA-induced EB1 protein depletion was confirmed by western blotting. D - HGF-induced PAK and cortactin phosphorylation in control and EB1-depleted EC was evaluated by western blot. Equal protein loading was confirmed by probing with β-actin antibody. E - Cells were treated with HGF for 5 or 10 min, and membrane translocation of cortactin and VE-cadherin was analyzed by western blot analysis of EC membrane fractions. Protein content in corresponding total cell lysates was used as a normalization control. Bar graphs represent the results of quantitative densitometry of western blot panels in control and treated HPAEC monolayers. Data are expressed as mean ± SD of three independent experiments; *p<0.05. F - Live cell imaging of the cells expressing GFP-cortactin. Snapshots depict HGF-induced cortical dynamics at the cell periphery of control and EB1-depleted cells. Arrows and higher magnification insets show peripheral cortactin accumulation and lamellipodia formation upon HGF treatment. Insets show cortactin accumulation at cell periphery after 3 min of HGF stimulation in control, but not EB1-depleted cells. The bar graph depicts quantitative image analysis of GFP-cortactin immunoreactivity at the cell cortical compartment. Results are average +/− SD of six microscopy fields per condition.
Figure 7
Figure 7. Effect of EB1 knockdown on HGF-mediated regulation of actin remodeling
Human pulmonary EC were transfected with EB1-specific or non-specific siRNA. A - Cells grown on glass coverslips were stimulated with HGF (50 ng/ml, 10 min). Intracellular redistribution of p21-Arc was examined by immunofluorescence staining with corresponding antibody. Shown are representative results of three independent experiments. B – Control and EB1-depleted EC were used for co-immunoprecipitation assays with IQGAP1 antibody followed by western blot detection of WAVE and p21-Arc. Bar graphs depict quantitative densitometry analysis of immunoblotting data. Results are represented as mean ± SD; *P<0.05; n=4.

Similar articles

Cited by

References

    1. Frank JA, Matthay MA. Crit Care. 2003;7(3):233–241. - PMC - PubMed
    1. Tremblay LN, Slutsky AS. Intensive Care Med. 2006;32(1):24–33. - PubMed
    1. Maniatis NA, Kotanidou A, Catravas JD, Orfanos SE. Vascul Pharmacol. 2008;49(4–6):119–133. - PMC - PubMed
    1. Deng JC, Standiford TJ. Compr Physiol. 2011;1(1):81–104. - PubMed
    1. Beckers CM, van Hinsbergh VW, van Nieuw Amerongen GP. Thromb Haemost. 2010;103(1):40–55. - PubMed

Publication types

MeSH terms

Substances