. 2016 Oct 11;24(4):582-592.
doi: 10.1016/j.cmet.2016.08.012. Epub 2016 Sep 22.

Suppressors of Superoxide-H2O2 Production at Site IQ of Mitochondrial Complex I Protect against Stem Cell Hyperplasia and Ischemia-Reperfusion Injury

Affiliations

Suppressors of Superoxide-H2O2 Production at Site IQ of Mitochondrial Complex I Protect against Stem Cell Hyperplasia and Ischemia-Reperfusion Injury

Martin D Brand et al. Cell Metab. .

Abstract

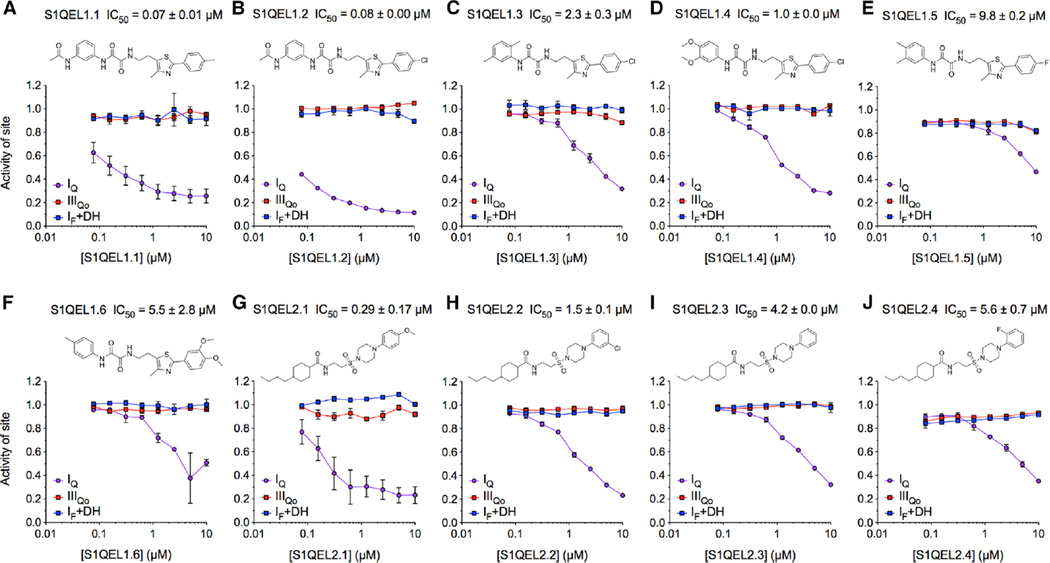
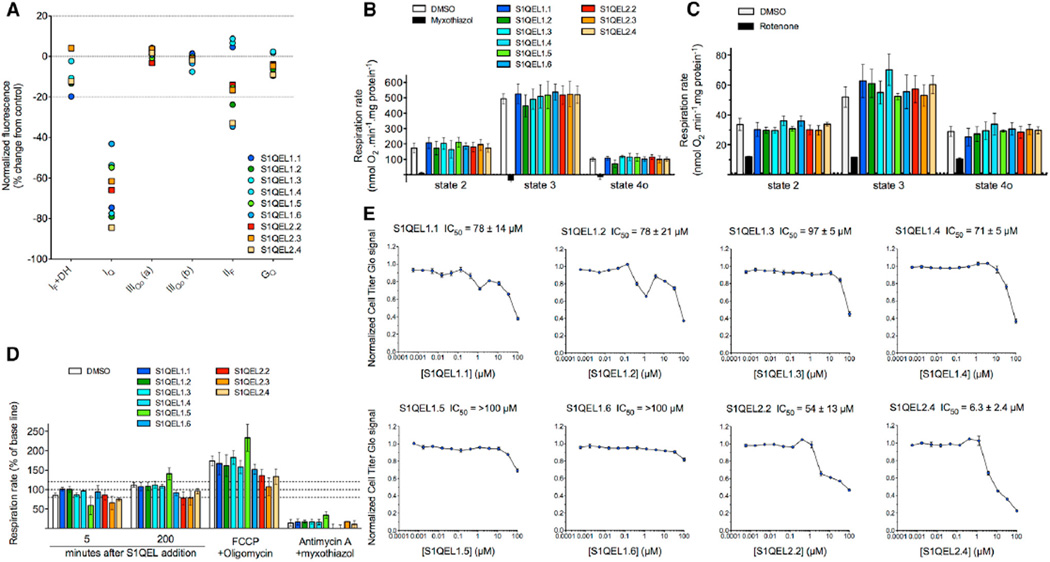
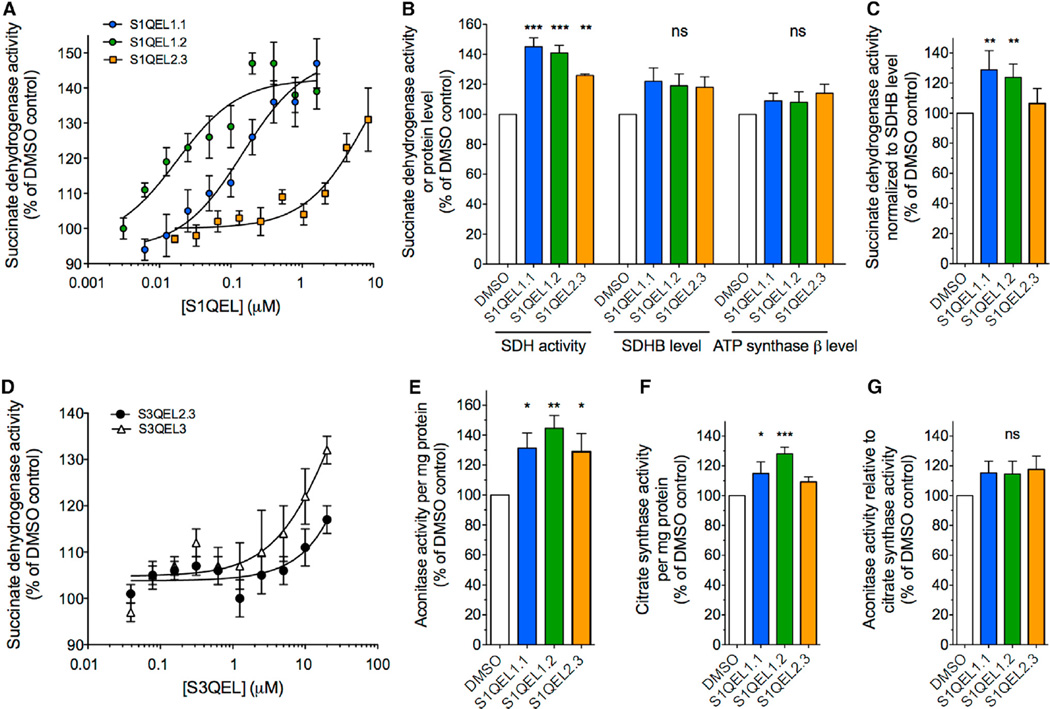
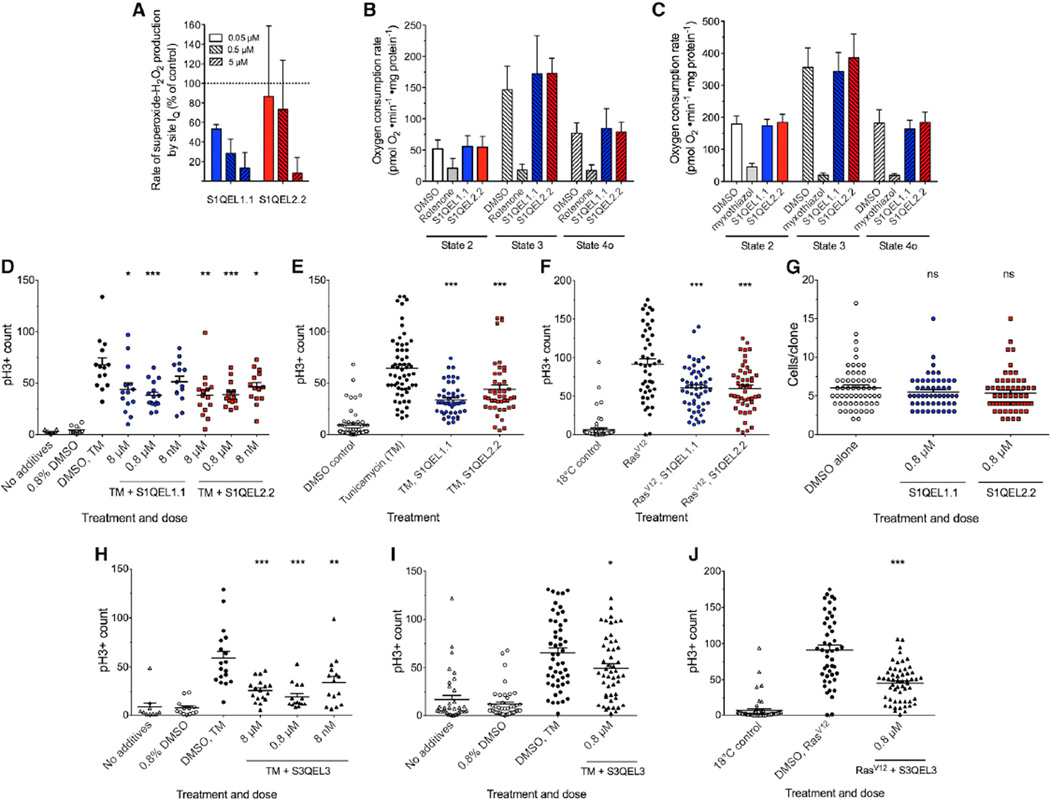
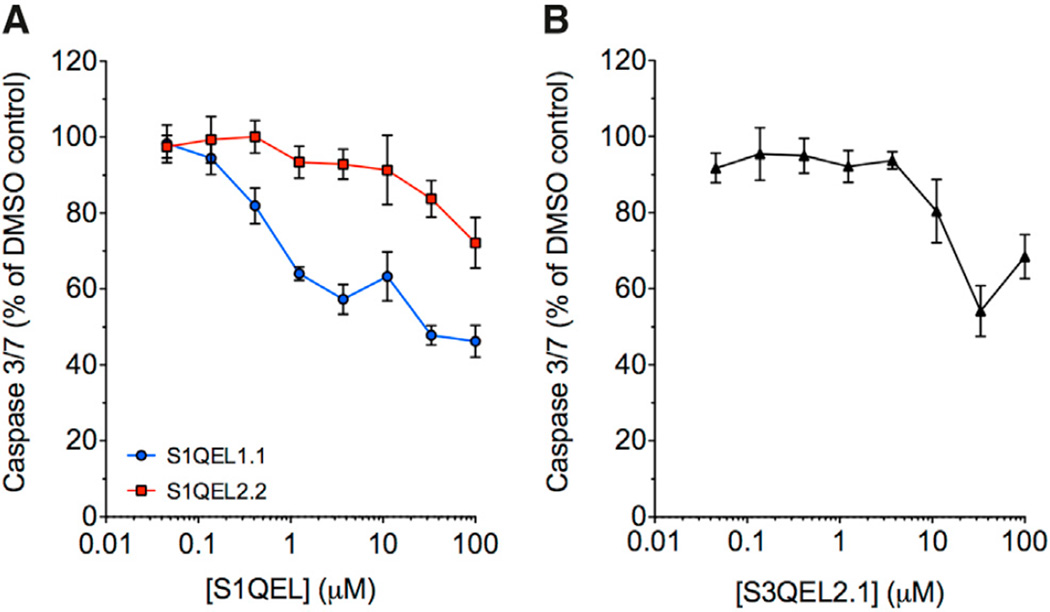
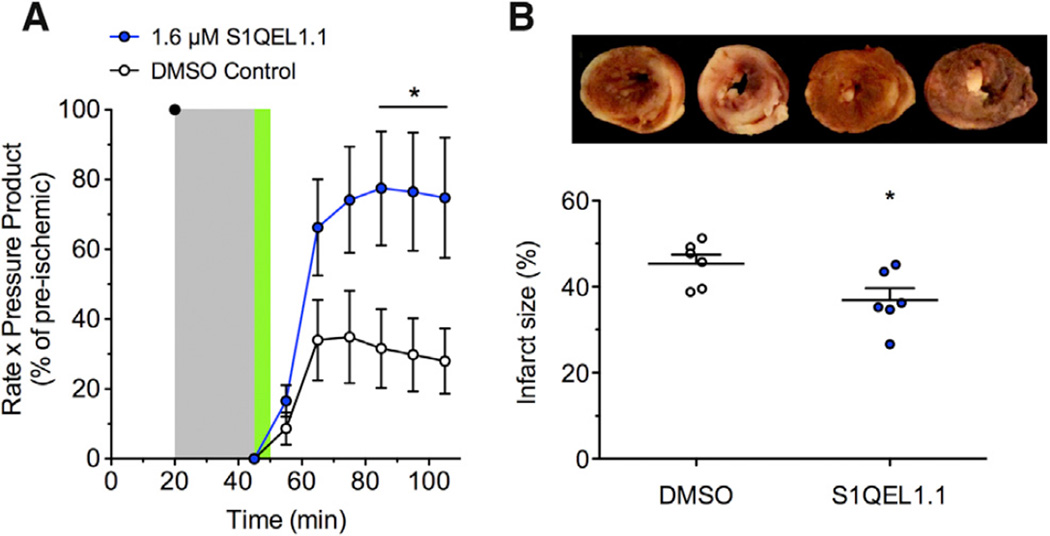
Using high-throughput screening we identified small molecules that suppress superoxide and/or H2O2 production during reverse electron transport through mitochondrial respiratory complex I (site IQ) without affecting oxidative phosphorylation (suppressors of site IQ electron leak, "S1QELs"). S1QELs diminished endogenous oxidative damage in primary astrocytes cultured at ambient or low oxygen tension, showing that site IQ is a normal contributor to mitochondrial superoxide-H2O2 production in cells. They diminished stem cell hyperplasia in Drosophila intestine in vivo and caspase activation in a cardiomyocyte cell model driven by endoplasmic reticulum stress, showing that superoxide-H2O2 production by site IQ is involved in cellular stress signaling. They protected against ischemia-reperfusion injury in perfused mouse heart, showing directly that superoxide-H2O2 production by site IQ is a major contributor to this pathology. S1QELs are tools for assessing the contribution of site IQ to cell physiology and pathology and have great potential as therapeutic leads.


Conflict of interest statement

L.V., C.N.T., J.T.M., V.J.D., H.M.P., S.L.M., and E.K.A. were employed by the Genomics Institute of the Novartis Research Foundation during the period of their contribution to this research. M.D.B. has consulted for Seahorse Bioscience. A.A.G. has a financial interest in Image Analyst Software.

Figures

Figure 1
Figure 1. Specific Suppression by S1QELs of Superoxide-H2O2 Production from Site IQ in Isolated Rat Skeletal Muscle Mitochondria
(A–F) Structures of S1QEL1s and dose-response curves against site IQ (site of respiratory complex I active during reverse electron transport, nominally the ubiquinone binding site), site IF+DH (flavin site of complex I and predominantly the 2-oxoglutarate dehydrogenase complex, site OF), and site IIIQo (outer ubiquinone-binding site of complex III) normalized to DMSO control = 1.0. (G–J) Structures of S1QEL2s and dose-response curves. Data are means ± SE of n = 3 technical replicates (n = 2 for IF+DH) (step 10 in Table 1). IC50 values against superoxide-H2O2 production from site IQ are means ± SE, n = 3 (n = 5 for S1QEL1.1 and S1QEL2.1).
Figure 2
Figure 2. Specificity of S1QELs for Superoxide-H2O2 Production from Site IQ in Isolated Rat Skeletal Muscle Mitochondria without Effects on Oxidative Phosphorylation or Cell Growth
(A) Effects of 10 µM S1QELs on rates of H2O2 production from different sites measured by Amplex UltraRed assay (normalized to DMSO control as 0% change and the appropriate positive control [Orr et al., 2013, 2015] as −100%). Dotted lines indicate control and ± 20% changes used to assess specificity. Sites IQ, IF+DH, and IIIQo are defined in Figure 1; IIIQo (a), assay at 5 mM succinate; IIIQo (b), assay at 4 mM succinate plus 1 mM malonate; IIF, flavin site of complex II; GQ, ubiquinone-binding site of mitochondrial glycerol 3-phosphate dehydrogenase. Data are from one experiment. (B and C) Effect of S1QELs on mitochondrial respiration measured in a Seahorse XF24 driven by (B) 5 mM succinate plus 4 µM rotenone with S1QELs added at 10 µM or (C) 5 mM glutamate plus 5 mM malate with S1QELs added at 20 × IC50 against superoxide-H2O2 production by site IQ. Substrate alone (respiratory state 2) was followed by sequential addition of 5 mM ADP (phosphorylating state 3) then 1 µg • ml−1 oligomycin (non-phosphorylating state 4o). DMSO was used as vehicle control. 2 µM myxothiazol (in B) and 4 µM rotenone (in C) were controls for conventional inhibition. Data are means ± SE of n = 3 biological replicates (each comprising three technical replicates). Values with S1QELs were not significantly different from values with DMSO (one-way ANOVA). (D) Effect of S1QELs on respiration of HEK293 cells in the presence of 4 mM pyruvate, 2 mM glutamine, and 20 mM galactose after acute addition of S1QELs at 20 × IC50 against superoxide-H2O2 production by site IQ. Where indicated, respiration was uncoupled (and ATPase was inhibited) by addition of 0.6 µM FCCP plus 1 µg • ml−1 oligomycin, and non-mitochondrial oxygen consumption was revealed using 4 µM antimycin A plus 4 µM myxothiazol. Data were normalized to baseline in each well before addition of DMSO or S1QEL. Values are means ± SE of three or four biological replicates (each comprising three technical replicates). Dotted lines indicate the normalized baseline rate and ± 20% changes. Values with S1QELs were not significantly different from values with DMSO (one-way ANOVA). (E) Effect of S1QELs on growth of HEK293T cells cultured in glucose-free DMEM containing 10% v/v fetal bovine serum, 2 mM pyruvate, 2 mM glutamine, and 20 mM galactose. Cell number was assessed after 72 hr as total ATP measured with Cell Titer Glo. The average effect of compounds was normalized to the intraplate median signal and expressed relative to DMSO control = 1.0. Data are means ± SE (n = 3). IC50 values are means ± SD.
Figure 3
Figure 3. Effects of S1QELs and S3QELs in Primary Cortical Astrocytes
Mouse primary astrocytes were cultured with DMSO vehicle or S1QELs or S3QELs under 3% oxygen for 5 days or 20% oxygen for 3 days. (A) Titration of succinate dehydrogenase activity in astrocytes cultured with S1QELs under 20% oxygen. Data are means ± SE (n = 5). (B) Effect of S1QEL1.1 (1.3 µM), S1QEL1.2 (0.2 µM), and S1QEL2.3 (8.4 µM) on succinate dehydrogenase activity and levels of SDH subunit B and ATP synthase β subunit determined by immunofluorescence in astrocytes cultured under 3% oxygen with S1QELs. Data are means ± SE (n = 6). (C) Effect of S1QELs on succinate dehydrogenase activity normalized to SDH subunit B levels determined by immunofluorescence. Astrocytes were cultured under 3% oxygen in the presence of 1.3 µM S1QEL1.1, 0.2 µM S3QEL1.2, or 8.4 µM S1QEL2.3. Data are means ± SE (n = 4). (D) Effect of S3QEL2.3 and S3QEL3 on succinate dehydrogenase activity in astrocytes cultured under 20% oxygen in the presence of the compounds. Data are means ± SE (n = 5). (E–G) Effect of S1QELs on (E) aconitase activity per mg protein, (F) citrate synthase activity per mg protein and (G) aconitase activity/citrate synthase activity in astrocytes cultured under 20% oxygen for 5 days with 0.1% (v/v) DMSO or S1QEL1.1 (0.5 µM), S1QEL1.2 (0.2 µM), or S1QEL2.3 (5 µM). Data are means ± SE (n = 5 for S1QEL1.1; n = 8 for S1QELs 1.2 and 2.3). In all panels, statistics compare values to the appropriate DMSOcontrol. ns, not significant; *p < 0.05; **p < 0.01; ***p < 0.001 by ANOVA followed by Holm-Sidak’s posthoc test.
Figure 4
Figure 4. Effects of S1QELs and S3QELs on Mitochondria and Intestinal Stem Cell Hyperproliferation in Drosophila
(A–C) Effect of S1QELs 1.1 and 2.2 on mitochondria isolated from Drosophila. (A) Superoxide-H2O2 production from site IQ. The 100% value was established in the presence 20 mM glycerol 3-phosphate (dotted line). H2O2 production from site IQ was assumed to be 0% after addition of 5 µM rotenone. (B and C) The effect of S1QEL1.1 and S1QEL2.2 at 20 × IC50 (against site IQ in rat skeletal muscle mitochondria) on respiration rate in Drosophila mitochondria driven by (B) 10 mM pyruvate plus 10 mM proline or (C) 10 mM glycerol 3-phosphate is shown. Substrate alone (respiratory state 2) was followed by sequential additions of 1 mM ADP (phosphorylating state 3) and 1 µg • ml−1 oligomycin (non-phosphorylating state 4o). DMSO was used as vehicle control. 4 µM rotenone or 2 µM myxothiazol were added as positive controls to show conventional inhibition. Data are means ± SE of three biological replicates (each comprising four technical replicates). Values with S1QELs were not significantly different from values with DMSO (one-way ANOVA). (D–J) Effects of S1QELs (D–G) and S3QELs (H–J) on ROS-dependent induction of stem cell proliferation in vivo in Drosophila. S1QELs and S3QELs were administered at the concentrations indicated 24 hr before and during treatments. (D) Dose optimization for inhibition of stem cell division by S1QELs 1.1 and 2.2, measured by staining of phospho-histone H3 (pH3), following feeding with 0.8% (v/v) DMSO or 50 µM tunicamycin (TM) (final DMSO concentration 0.8% [v/v]). (E and F) Effect of 0.8 µMS1QELs on intestinal stem cell hyperproliferation in vivo in Drosophila. Stimulation was measured following (E) 50 µMdietary tunicamycin (TM) or (F) temperature-controlled expression of the RasV12 oncogene. (G) Effect of S1QELs on unstressed stem cell division tracked using the MARCM system to label individual stem cell progeny with GFP. Clone size was assessed at day 7 for 50–60 clones per condition from 6–8 intestines. (H) Dose optimization for inhibition of stem cell division by S3QEL3 (same protocol as D). (I and J) Effect of 0.8 µM S3QEL3 following (I) 50 µM dietary TM or (J) temperature-controlled expression of the RasV12 mutant (same protocols as E and F). For (D)–(J), horizontal bars show mean ± SE; dots represent individual intestines. ns, not significantly different from DMSO alone; *p < 0.05; **p < 0.001; ***p < 0.0001 versus tunicamycin or RasV12 alone (ANOVA with Tukey’s post-test).
Figure 5
Figure 5. Effects of S1QELs and S3QELs on Activation of Caspase 3/7 by Tunicamycin in H9c2 Cells
(A) Effect of S1QELs. (B) Effect of S3QEL2.1. Values are means ± SE, n = 6.
Figure 6
Figure 6. Effect of S1QEL1.1 on Ischemia-Reperfusion Injury in Perfused Mouse Heart
(A) The rate-pressure product in Langendorff-perfused hearts after 20 min equilibration was set to 100%. Flow was stopped for 25 min ischemia (gray). Reperfusion included either 0.05% v/v DMSO vehicle or 1.6 µM S1QEL1.1 for 5 min (green), then continued with no additions. (B) Infarct size measured at the end of the experiment in the same hearts using tetrazolium chloride staining. Bars are means; dots represent individual hearts. Representative images (white, necrotic infarct; red, live tissue) are shown (left two hearts, DMSO; right two hearts, S1QEL1.1). Data are means ± SE (n = 6 hearts per group); *p < 0.05 versus control by Student’s t test.

References

    1. Affourtit C, Quinlan CL, Brand MD. Measurement of proton leak and electron leak in isolated mitochondria. Methods Mol. Biol. 2012;810:165–182. - PubMed
    1. Biteau B, Jasper H. EGF signaling regulates the proliferation of intestinal stem cells in Drosophila. Development. 2011;138:1045–1055. - PMC - PubMed
    1. Biteau B, Hochmuth CE, Jasper H. JNK activity in somatic stem cells causes loss of tissue homeostasis in the aging Drosophila gut. Cell Stem Cell. 2008;3:442–455. - PMC - PubMed
    1. Brand MD. The sites and topology of mitochondrial superoxide production. Exp. Gerontol. 2010;45:466–472. - PMC - PubMed
    1. Brand MD. Mitochondrial generation of superoxide and hydrogen peroxide as the source of mitochondrial redox signaling. Free Radic. Biol. Med. 2016 Published online April 13, 2016. http://dx.doi.org/10.1016/j.freeradbiomed.2016.04.001. - DOI - PubMed

MeSH terms