. 2016 Oct 6;167(2):397-404.e9.
doi: 10.1016/j.cell.2016.08.069. Epub 2016 Sep 22.

Loss of IFN-γ Pathway Genes in Tumor Cells as a Mechanism of Resistance to Anti-CTLA-4 Therapy

Affiliations

Loss of IFN-γ Pathway Genes in Tumor Cells as a Mechanism of Resistance to Anti-CTLA-4 Therapy

Jianjun Gao et al. Cell. .

Abstract

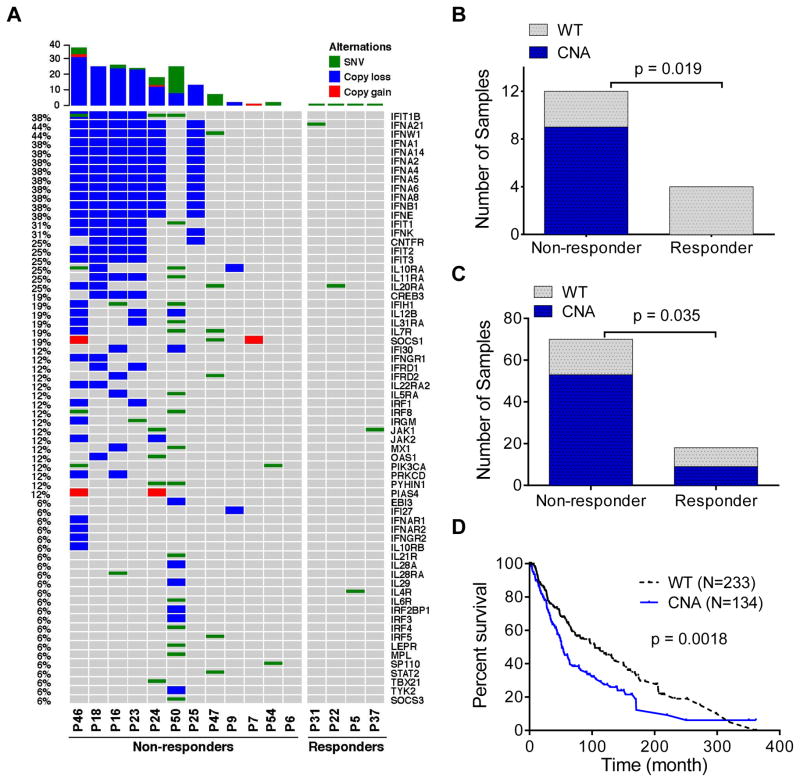
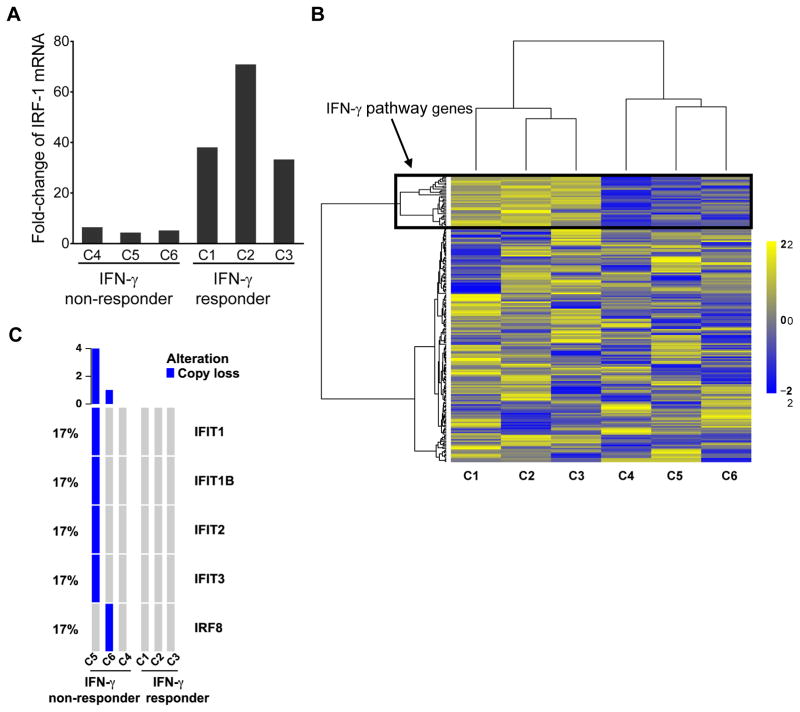
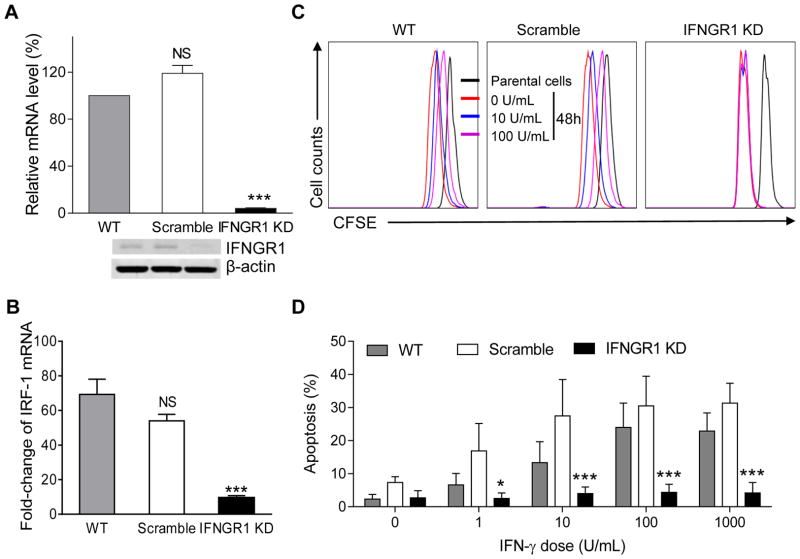
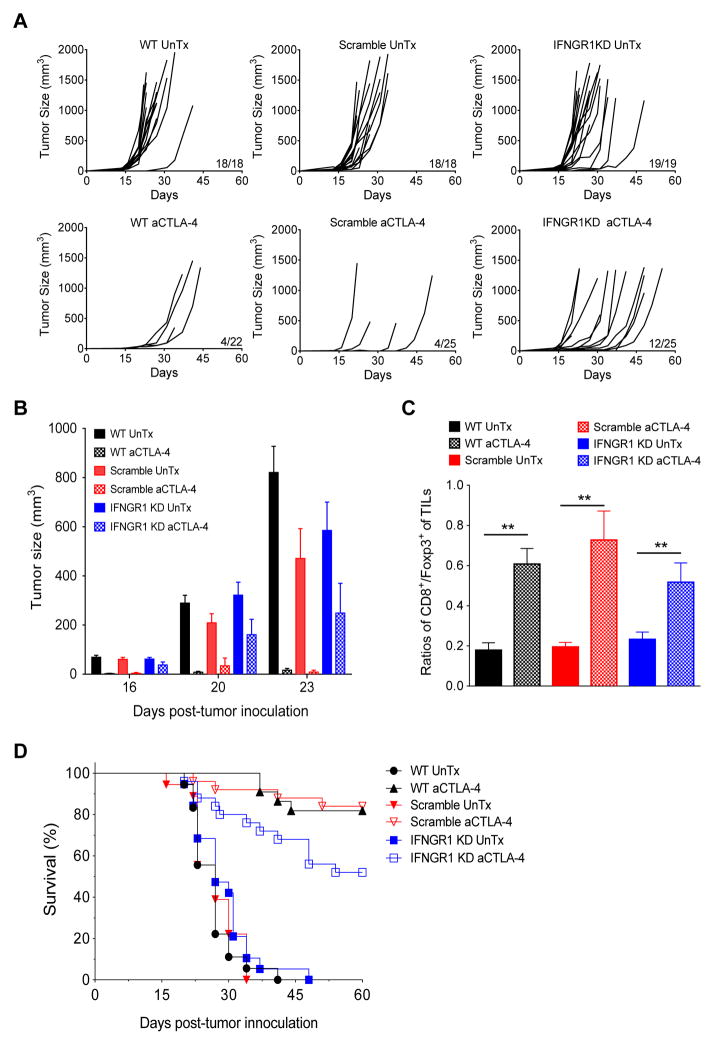
Antibody blockade of the inhibitory CTLA-4 pathway has led to clinical benefit in a subset of patients with metastatic melanoma. Anti-CTLA-4 enhances T cell responses, including production of IFN-γ, which is a critical cytokine for host immune responses. However, the role of IFN-γ signaling in tumor cells in the setting of anti-CTLA-4 therapy remains unknown. Here, we demonstrate that patients identified as non-responders to anti-CTLA-4 (ipilimumab) have tumors with genomic defects in IFN-γ pathway genes. Furthermore, mice bearing melanoma tumors with knockdown of IFN-γ receptor 1 (IFNGR1) have impaired tumor rejection upon anti-CTLA-4 therapy. These data highlight that loss of the IFN-γ signaling pathway is associated with primary resistance to anti-CTLA-4 therapy. Our findings demonstrate the importance of tumor genomic data, especially IFN-γ related genes, as prognostic information for patients selected to receive treatment with immune checkpoint therapy.

Keywords: IFN-γ signaling; Melanoma; anti-CTLA-4; copy-number alteration; ipilimumab; primary resistance.


Figures

Figure 1
Figure 1. Melanoma tumors resistant to ipilimumab therapy contain genomic defects in IFN-γ pathway genes
(A) Landscape of CNAs of IFN-γ pathway genes in 16 melanoma tumors (See Table S1 for patient information). Each column represents a patient tumor sample as labeled at the bottom. The bar plot at the top of the figure represents the total number of genes with CNA or SNV in that specific sample. The numbers on the left side represent the percentage of melanoma samples carrying CNA or SNV of each specific gene. The gene names are labeled on the right side of the figure. See Figure S1 for permutation analyses of CNAs (A) and SNVs (B) between responders and non-responders. Figure S3 depicts the two common interferon gene clusters deleted in ipilimumab non-responders. (B) Numbers of melanoma tumor samples with wild-type (grey bars) and carrying CNAs (blue bars) of IFN-γ pathway genes in responders (N=4) vs. non-responders (N=12) to ipilimumab therapy in our cohort. See Table S2 for a complete list of defined IFN-γ pathway genes. (C) Numbers of melanoma tumor samples with wild-type (grey bars) and carrying CNAs (blue bars) of IFN-γ pathway genes in responders (N=18) vs. non-responders (N=70) in an independent cohort. See also Table S3 for responder and non-responder patients and Figure S2 for detailed distribution of CNAs in these patients. The associations of somatic CNAs with ipilimumab clinical responses in Figure 1B and C were based on one-tailed Fisher’s exact test. (D) Kaplan-Meier survival curve of patients with metastatic melanoma containing CNAs in IFN-γ pathway genes (N=134) vs. those with melanoma tumors containing wild-type IFN-γ pathway genes (N=233). The p-value was based on log rank test.
Figure 2
Figure 2. Human melanoma cell lines that are refractory to in vitro treatment with IFN-γ contain genomic defects in IFN-γ pathway genes
(A) IRF-1 gene expression fold change after IFN-γ treatment in the 6 cell lines derived from human melanoma tumors. The 3 cell lines (C1, C2 and C3) with higher fold changes were defined as IFN-γ responders and the other 3 (C4, C5 and C6) as IFN-γ non-responders. (B) Heatmap of unsupervised clustering analysis of the scaled log2 fold changes of gene expression in the 6 cell lines after IFN-γ treatment. The top panel in the black box illustrated the 36 probes (see Table S4 for details) showing consistent higher fold changes in C1, C2 and C3. (C) IFN-γ pathway gene copy number loss in 3 IFN-γ non-responder melanoma cells lines vs. 3 responder cell lines. See also Figure S3 and Table S4.
Figure 3
Figure 3. Knockdown of IFNGR1 gene in murine B16/BL6 melanoma attenuates IFN-γ mediated suppression of cell proliferation and apoptosis
(A) Knockdown of IFNGR1 gene in B16/BL6 cell line (see also Figure S4). Top panel shows IFNGR1 mRNA levels as detected by RT-PCR in wild-type (WT), scramble shRNA (SC) transduced-, and IFNGR1 shRNA- transduced (IFNGR1 KD) B16/BL6 cells (bar graphs). The bottom panel shows IFNGR1 protein levels as detected by western blot in the same experimental groups with β-actin as an internal control. (B) RT-PCR analysis of IRF-1 mRNA expression of the above B16/BL6 cells treated with 1000 unit/ml of IFN-γ for 16 hours (NS, not significant; *** P < 0.0001). (C) B16/BL6 cells as described in (A) that were freshly labeled with CFSE (parental cells) or CFSE-prelabeled cells that were further cultured for 48 h in the absence or presence of varying doses of IFN-γ were analyzed for CFSE expression by flow cytometry. (D) Apoptosis rate as detected by flow cytometry in wild-type, scramble shRNA transduced, and IFNGR1 shRNA-transduced B16/BL6 cells in response to increasing concentrations of IFN-γ. Data in the bar graphs are means ± SEM. NS: no statistical significance, *: p<0.05, **: p<0.01, ***: p<0.001 by ANOVA analysis, as compared to the wild-type counterparts. All data are representative of three independent experiments.
Figure 4
Figure 4. Knockdown of IFNGR1 gene in B16/BL6 tumors promotes in vivo tumor growth and reduces survival in response to anti-CTLA-4 therapy
(A) In vivo tumor growth rate in B16/BL6 wild-type tumors as compared to scramble shRNA- and IFNGR1 shRNA-transduced tumors in mice treated with anti-CTLA-4 (lower panel). Upper panels are untreated controls (UnTx). (B) Tumor load of wild-type, scramble shRNA- and IFNGR1 shRNA-transduced tumors in mice treated with anti-CTLA-4. Data in the bar graphs are means ± SEM. (C) Ratio of CD8 T cells to Foxp3+ regulatory T cells in wild-type, scramble shRNA- and IFNGR1 shRNA-transduced tumors from mice on day 14 post anti-CTLA-4 treatment. Data in the bar graphs are means ± SEM; **p<0.01 by student’s t-test, as compared to the untreated controls. (D) Survival rate of mice bearing B16/BL6 wild-type tumors as compared to scramble shRNA- and IFNGR1 shRNA-transduced tumors with and without treatment of anti-CTLA-4. All data are pooled results from 2–3 independent experiments.

Comment in

References

    1. Alegre ML, Shiels H, Thompson CB, Gajewski TF. Expression and function of CTLA-4 in Th1 and Th2 cells. J Immunol. 1998;161:3347–3356. - PubMed
    1. Borghaei H, Paz-Ares L, Horn L, Spigel DR, Steins M, Ready NE, Chow LQ, Vokes EE, Felip E, Holgado E, et al. Nivolumab versus Docetaxel in Advanced Nonsquamous Non-Small-Cell Lung Cancer. New Engl J Med. 2015;373:1627–1639. - PMC - PubMed
    1. Chen H, Liakou CI, Kamat A, Pettaway C, Ward JF, Tang DN, Sun J, Jungbluth AA, Troncoso P, Logothetis C, et al. Anti-CTLA-4 therapy results in higher CD4+ICOShi T cell frequency and IFN-gamma levels in both nonmalignant and malignant prostate tissues. Proc Natl Acad Sci U S A. 2009;106:2729–2734. - PMC - PubMed
    1. Chin YE, Kitagawa M, Kuida K, Flavell RA, Fu XY. Activation of the STAT signaling pathway can cause expression of caspase 1 and apoptosis. Molecular and cellular biology. 1997;17:5328–5337. - PMC - PubMed
    1. Cibulskis K, Lawrence MS, Carter SL, Sivachenko A, Jaffe D, Sougnez C, Gabriel S, Meyerson M, Lander ES, Getz G. Sensitive detection of somatic point mutations in impure and heterogeneous cancer samples. Nature biotechnology. 2013;31:213–219. - PMC - PubMed

Publication types

MeSH terms

LinkOut - more resources