. 2016 Sep 26:6:33087.
doi: 10.1038/srep33087.

A suppressor locus for MODY3-diabetes

Affiliations

A suppressor locus for MODY3-diabetes

Miguel A Garcia-Gonzalez et al. Sci Rep. .

Erratum in

  • Erratum: A suppressor locus for MODY3-diabetes.
    Garcia-Gonzalez MA, Carette C, Bagattin A, Chiral M, Makinistoglu MP, Garbay S, Prévost G, Madaras C, Hérault Y, Leibovici M, Pontoglio M. Garcia-Gonzalez MA, et al. Sci Rep. 2016 Oct 21;6:35697. doi: 10.1038/srep35697. Sci Rep. 2016. PMID: 27767025 Free PMC article. No abstract available.

Abstract

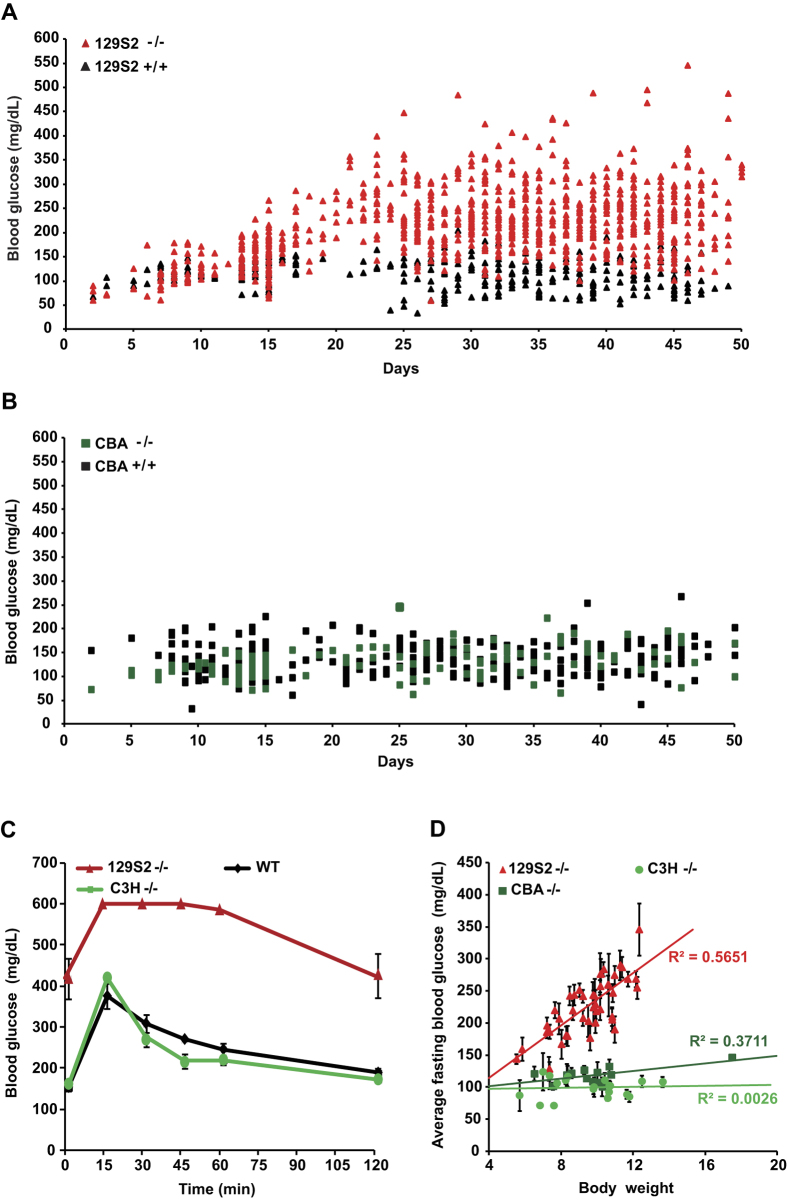
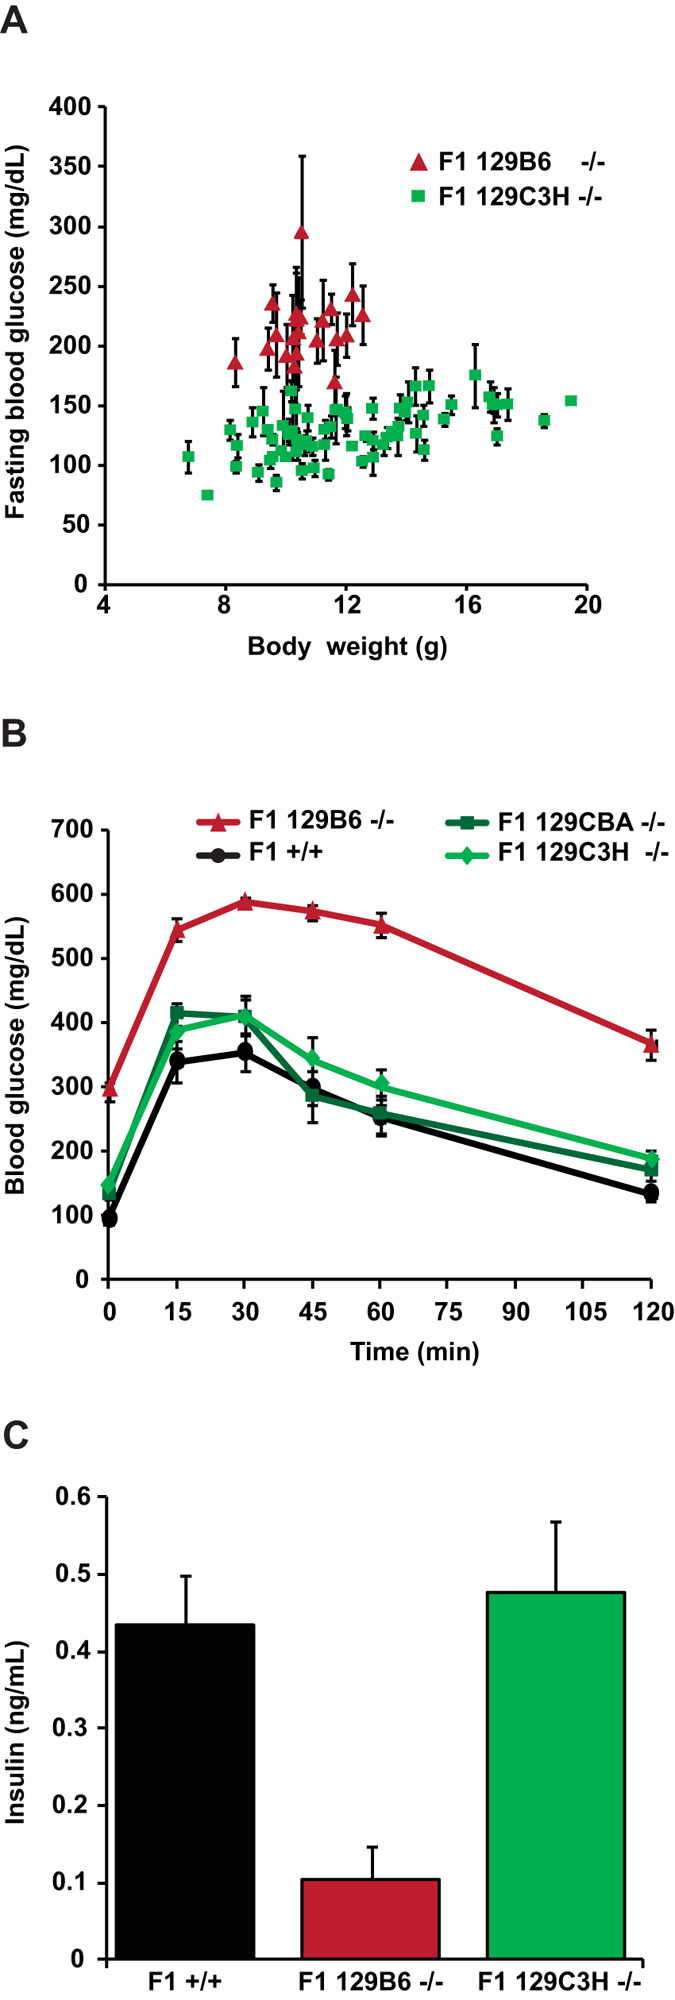
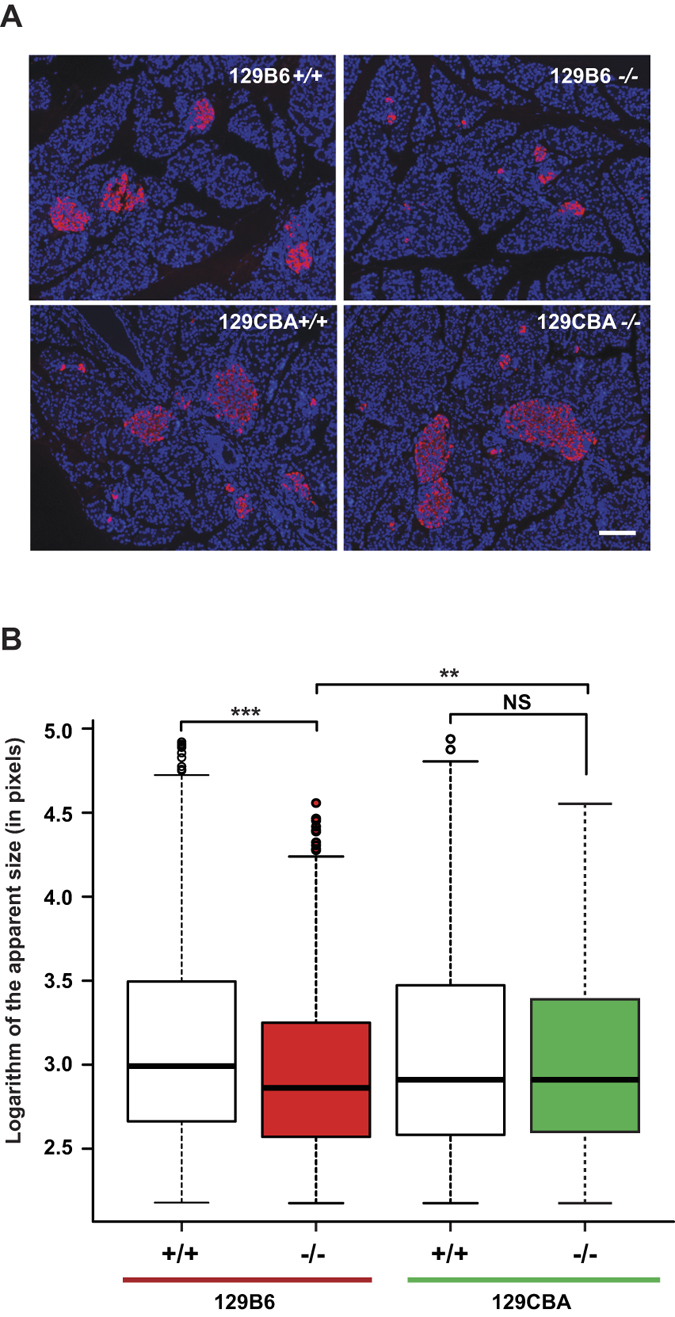
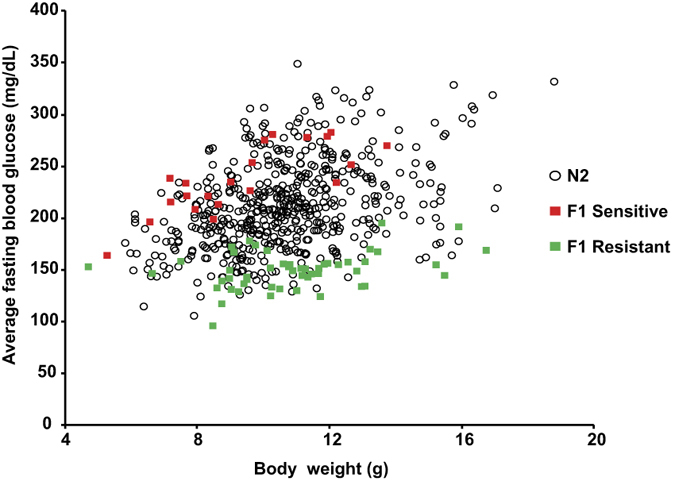
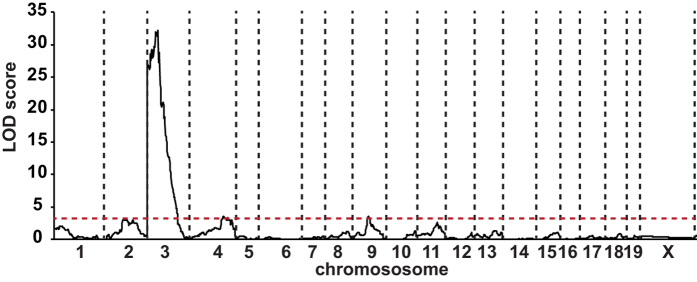
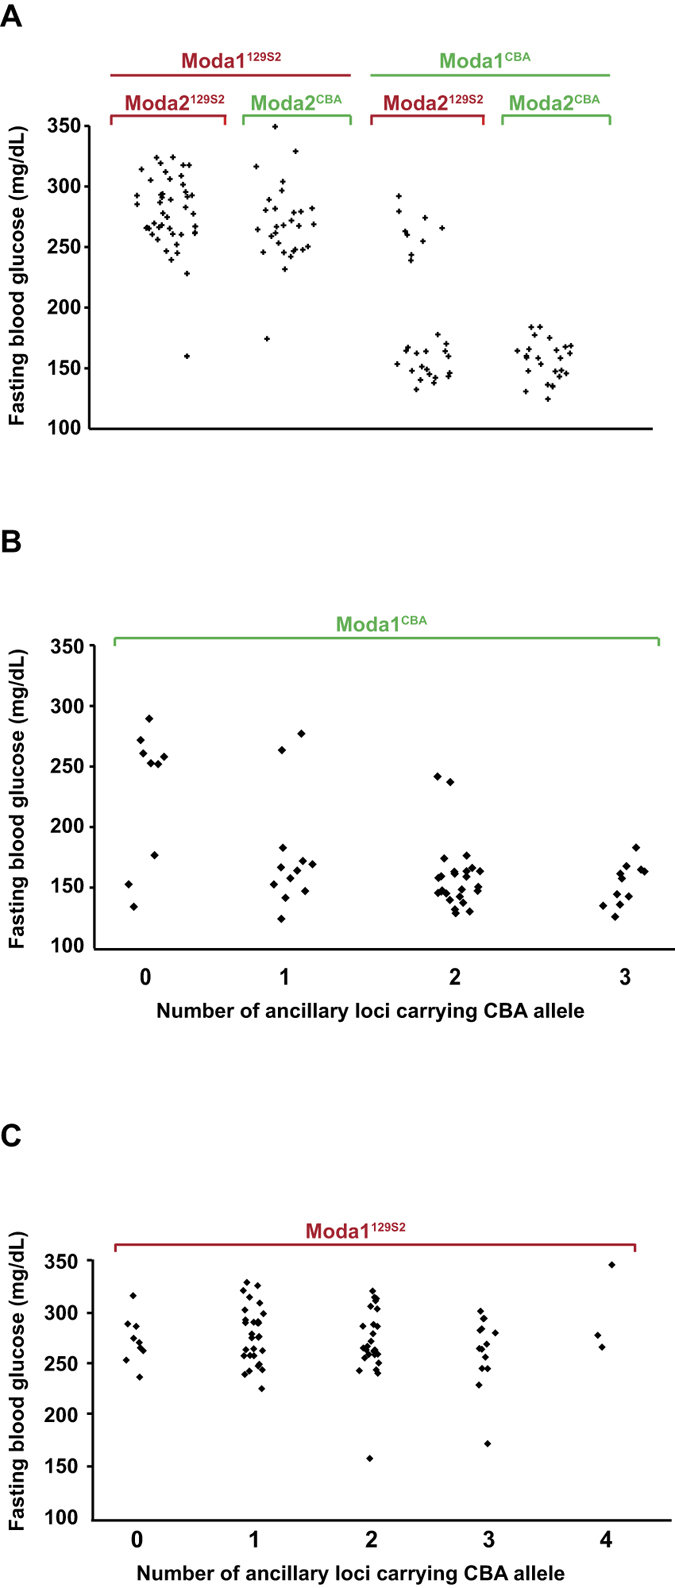
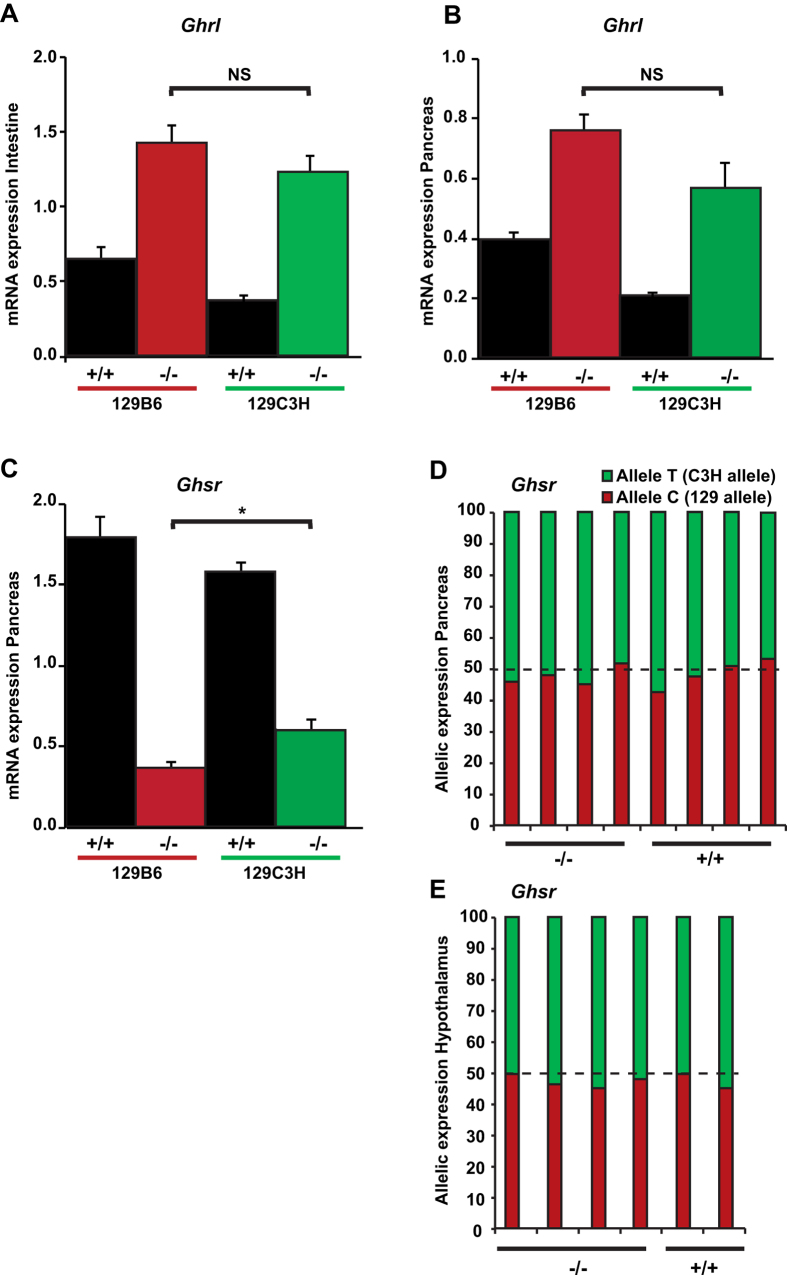
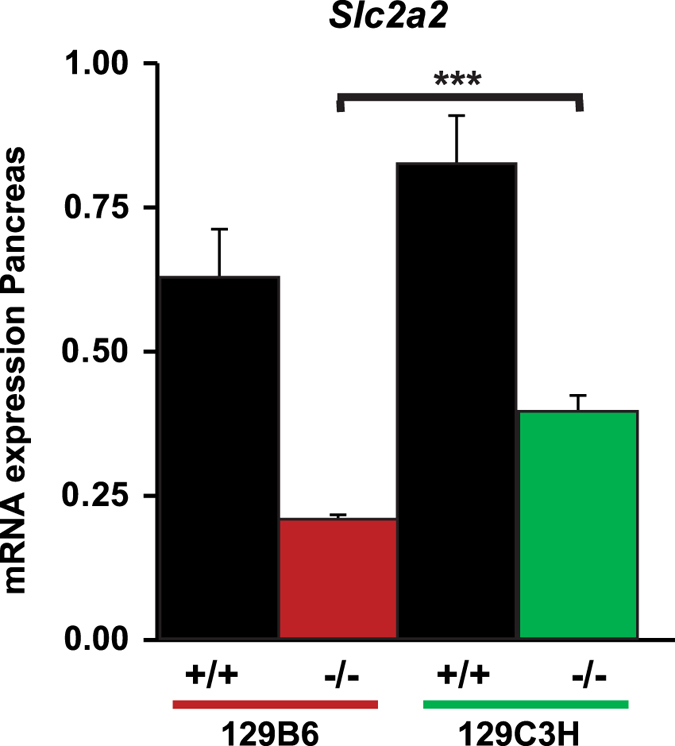
Maturity Onset Diabetes of the Young type 3 (MODY3), linked to mutations in the transcription factor HNF1A, is the most prevalent form of monogenic diabetes mellitus. HNF1alpha-deficiency leads to defective insulin secretion via a molecular mechanism that is still not completely understood. Moreover, in MODY3 patients the severity of insulin secretion can be extremely variable even in the same kindred, indicating that modifier genes may control the onset of the disease. With the use of a mouse model for HNF1alpha-deficiency, we show here that specific genetic backgrounds (C3H and CBA) carry a powerful genetic suppressor of diabetes. A genome scan analysis led to the identification of a major suppressor locus on chromosome 3 (Moda1). Moda1 locus contains 11 genes with non-synonymous SNPs that significantly interacts with other loci on chromosomes 4, 11 and 18. Mechanistically, the absence of HNF1alpha in diabetic-prone (sensitive) strains leads to postnatal defective islets growth that is remarkably restored in resistant strains. Our findings are relevant to human genetics since Moda1 is syntenic with a human locus identified by genome wide association studies of fasting glycemia in patients. Most importantly, our results show that a single genetic locus can completely suppress diabetes in Hnf1a-deficiency.


Figures

Figure 1
Figure 1. Blood glucose in Hnf1a sensitive and resistant mutant strains.
(A) Blood glucose level in 129S2 Hnf1a−/− (129S2−/−, red triangles, n = 151) mice and wild-type control (black triangles, n = 54). From weaning onwards, 129S2−/− mice presented significant hyperglycemia compared to control animals (p-value < 0.0001). (B) On the contrary, Hnf1a mutant CBA strain (dark green squares, n = 41) remained normoglycemic and comparable to CBA wild-type mice (black squares, n = 64). (C) Intraperitoneal Glucose Tolerance Test (IPGTT) on sensitive (red, n = 4), resistant (green, n = 4) and wild type (black, n = 3) adult animals demonstrates that the resistant strain is glucose tolerant. Error bars represent SEM. (D) Body weight affects the fasting blood glucose level in the sensitive mutant strain (red triangles, n = 43) but has no impact in the two resistant mutant strains CBA (dark green squares, n = 13) and C3H (light green dots, n = 19), respectively. The linear correlation between body weight and fasting glucose level indicated by solid lines is significant only in the sensitive mutant strain (Pearson R2 = 0.56). Error bars represent SEM for 3 to 7 fasting blood glucose measurements carried out on mice from 25 to 45 days old (P25 to P45). n = number of animals.
Figure 2
Figure 2. CBA and C3H genetic backgrounds suppress diabetes in F1 Hnf1a mutant mice.
(A) Hnf1a−/− mice carrying an F1 129B6 background (red triangles, n = 21) presented hyperglycemia whereas mutant mice carrying F1 129C3H (green squares, n = 69) remained normoglycemic. Fasting blood glucose measurements were carried out on P25-P45 mice. (B) Intraperitoneal glucose tolerance test (IPGTT) on F1 sensitive mutant 129B6 strain (red curve, n = 13), F1 resistant mutant strains 129CBA and 129C3H (dark green and light green curves, n = 7 and n = 9, respectively) and F1 129B6 (n = 6) plus 129C3H (n = 6) wild-type mice (black curve). The time course of glucose clearance was comparable in both F1 resistant mutant strains and wild-type mice. (C) Plasma insulin levels measured by ELISA at 15 min during IPGTT in F1 wild-type (n = 5), F1 sensitive mutant 129B6 (n = 5) and F1 resistant mutant 129C3H (n = 7). Insulin concentrations were not significantly different between F1 wild-type mice and F1 resistant mutant. n = number of animals. Error bars represent SEM.
Figure 3
Figure 3. Apparent size of Langherans islets.
(A) Selected representative views of P15 pancreas histological sections labeled for beta cells (pink staining) and nuclei (blue staining) with insulin antibody and DAPI, respectively. The genotype is indicated on each picture. Scale bar is 100 μm. (B) Box plot representation of apparent islet size from each genotype at P15 (3 animals per genotype). The total number of islets analyzed were 1534, 1752, 1433, and 1393 in F1 129B6+/+, F1 129B6−/−, F1 129CBA+/+ and F1 129CBA−/−, respectively. Nonparametric Wilcoxon test determined the significant differences between samples (**p-value < 0.005; ***p-value < 0.0001).
Figure 4
Figure 4. Blood glucose level segregation in N2 Hnf1a mutant animals.
Blood glucose of F1 sensitive mutant mice (red squares, n = 24), F1 resistant mutant mice (green squares, n = 51) and N2 mutant mice (open circles, n = 532). n = number of animals.
Figure 5
Figure 5. Identification of a major QTL for fasting blood glucose level on chromosome 3.
Whole genome multipoint LOD score for the Moda1 was 32 and defined a critical interval on chromosome 3 of 6.5 Mb (99% confidence interval). The minimum significant threshold value for the LOD score is indicated by a red dashed line.
Figure 6
Figure 6. Genetic interaction between the major Moda1 locus and ancillary loci modulates glucose homeostasis in Hnf1a−/− mice.
(A) Interaction between Moda1 and Moda2 loci. When Moda1 carries the sensitive allele 129S2, almost all mice are hyperglycemic whatever the status of the Moda2 locus (left part of the chart). Conversely, in animals carrying the resistant CBA allele of Moda1, the concomitant presence of Moda2CBA leads to the suppression of diabetes (right part of the chart). (B) Cumulative effect of Moda3, Moda4 and Moda5 in mice carrying a Moda1CBA resistant allele. The progressive decrease of blood glucose level is significantly correlated to the increase, in the genome, of ancillary modifier locus carrying CBA allele (linear regression of 24mg/dL per locus with a p-value < 0.0001). (C) The cumulative impact of all ancillary loci has no significant effect on mice that carry a sensitive Moda1 allele. In all figures each dot represents a mouse. For clarity, the complementary B6 allele was not indicated.
Figure 7
Figure 7. Expression of Ghrelin and Ghrelin receptor genes.
Ghrelin (Ghrl) and Ghrelin receptor (Ghsr) levels were determined by RT-qPCR in F1 wild-type 129B6 and 129C3H mice (n = 4 and n = 4, respectively) and F1 Hnf1a−/− 129B6 and 129C3H mice (n = 5 and n = 6, respectively). In (A) adult jejunum and (B) P6 pancreas, an increase in Ghrl transcripts is observed in both mutant strains compared to wild-type mice but no significant differences in expression were observed between the mutant strains. (C) By contrast, in P6 pancreas, Ghsr transcripts were decreased in mutant strains compared to the wild type counterparts. This decrease was statistically significantly higher in sensitive mutant compared resistant mutant strains (*p < 0.05). NS = non-significant. Allelic expression (pyrosequencing) of the Ghsr gene is presented in F1 129C3H mice in (D) pancreas, and (E) hypothalamus. The results are represented as a percentage of expression from each allele. n = number of animals.
Figure 8
Figure 8. Slc2a2 expression in sensitive and resistant mutant strains.
Slc2a2 expression was assessed by RT-qPCR in wild-type 129B6 and 129C3H mice, and in Hnf1a−/− 129B6 and 129C3H mice in the pancreas at P6 (n = 5 for each genotype). A decrease of Slc2a2 transcripts is observed in sensitive and resistant mutant mice compared to wild-type mice. Resistant mutant mice express statistically significant higher levels compared to sensitive mutant mice (***p-value < 0.005). n = number of animals.

Similar articles

Cited by

References

    1. Yamagata K. et al.. Mutations in the hepatocyte nuclear factor-1alpha gene in maturity-onset diabetes of the young (MODY3). Nature 384, 455–458, doi: 10.1038/384455a0 (1996). - DOI - PubMed
    1. Ashcroft F. M. & Rorsman P. Diabetes mellitus and the beta cell: the last ten years. Cell 148, 1160–1171, doi: 10.1016/j.cell.2012.02.010 (2012). - DOI - PMC - PubMed
    1. Bellanne-Chantelot C. et al.. Clinical characteristics and diagnostic criteria of maturity-onset diabetes of the young (MODY) due to molecular anomalies of the HNF1A gene. The Journal of clinical endocrinology and metabolism 96, E1346–E1351, doi: 10.1210/jc.2011-0268 (2011). - DOI - PubMed
    1. Kim S. H. et al.. Genetic modifiers of the age at diagnosis of diabetes (MODY3) in carriers of hepatocyte nuclear factor-1alpha mutations map to chromosomes 5p15, 9q22, and 14q24. Diabetes 52, 2182–2186 (2003). - PubMed
    1. Bellanne-Chantelot C. et al.. The type and the position of HNF1A mutation modulate age at diagnosis of diabetes in patients with maturity-onset diabetes of the young (MODY)-3. Diabetes 57, 503–508, doi: 10.2337/db07-0859 (2008). - DOI - PubMed