

Impaired virus replication and decreased innate immune responses to viral infections in nasal epithelial cells from patients with allergic rhinitis
- PMID: 27667736
- PMCID: PMC5167059
- DOI: 10.1111/cei.12869
Impaired virus replication and decreased innate immune responses to viral infections in nasal epithelial cells from patients with allergic rhinitis
Abstract
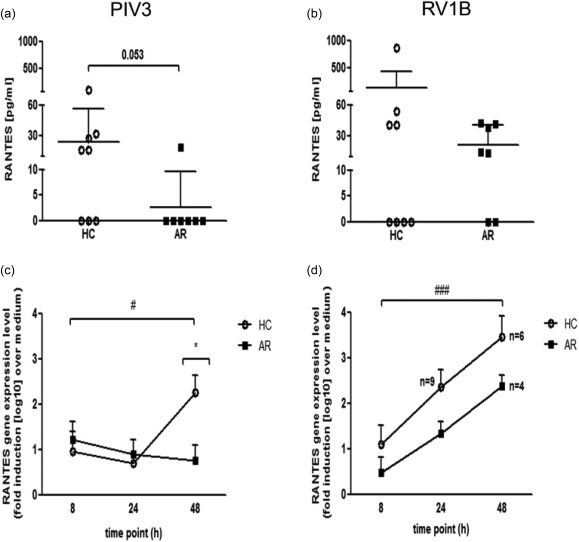
The aim of this study was to assess the immune response to parainfluenza virus type 3 (PIV3), rhinovirus 1B (RV1B) and intracellular Toll-like receptors (TLR) agonists in nasal epithelial cells (NECs) from patients with allergic rhinitis and healthy controls. NECs were obtained from eight patients with allergic rhinitis (AR) and 11 non-atopic healthy controls (HC) by nasal scraping, grown to confluence and exposed to PIV3, RV1B infection or TLR-3 and TLR-7/8 agonists. Interferon (IFN)-λ1, IFN-α, IFN-β and regulated on activation, normal T expressed and secreted (RANTES) release into the cell culture supernatants was assessed at 8, 24 and 48 h upon infection or 8 and 24 h after stimulation with poly(I:C) and R848. mRNA levels of IFNs, RANTES, interferon regulatory transcription factor (IRF)3, IRF7 and viral gene copy number were determined using real-time polymerase chain reaction (RT-PCR). PIV3 but not RV1B replication 48 h after infection was significantly lower (P < 0·01) in NECs from AR patients compared to HC. PIV3 infection induced significantly less IFN-λ1 (both protein and mRNA) in NECs from AR compared to HC. IFN-β mRNA expression and RANTES protein release and mRNA expression tended to be smaller in AR compared HC cells in response to both viruses. Stimulation with TLR-3 agonist [poly (I:C)] induced similar IFN-λ1 and RANTES generation in AR and HC subjects. Viral infections in NECs induced IRF7 expression, which correlated with IFN and RANTES expression. These data suggest that virus proliferation rates and the immune response profile are different in nasal epithelial cells from patients with allergic rhinitis compared to healthy individuals.
Keywords: allergic rhinitis; interferons; parainfluenza type 3 virus; primary nasal epithelial cells; rhinovirus 1B.
© 2016 British Society for Immunology.
Figures


Similar articles
-
Increased nasal mucosal interferon and CCL13 response to a TLR7/8 agonist in asthma and allergic rhinitis.J Allergy Clin Immunol. 2021 Feb;147(2):694-703.e12. doi: 10.1016/j.jaci.2020.07.012. Epub 2020 Jul 24. J Allergy Clin Immunol. 2021. PMID: 32717253
-
Innate Immune Response to Viral Infections in Primary Bronchial Epithelial Cells is Modified by the Atopic Status of Asthmatic Patients.Allergy Asthma Immunol Res. 2018 Mar;10(2):144-154. doi: 10.4168/aair.2018.10.2.144. Allergy Asthma Immunol Res. 2018. PMID: 29411555 Free PMC article.
-
Comparison of inflammatory cytokine release from nasal epithelial cells of non-atopic non-rhinitic, allergic rhinitic and polyp subjects and effects of diesel exhaust particles in vitro.Allergol Immunopathol (Madr). 2017 Sep-Oct;45(5):473-481. doi: 10.1016/j.aller.2016.10.015. Epub 2017 Mar 2. Allergol Immunopathol (Madr). 2017. PMID: 28259510
-
The roles of toll like receptor 3, 7 and 8 in allergic rhinitis pathogenesis.Allergol Immunopathol (Madr). 2018 Sep-Oct;46(5):503-507. doi: 10.1016/j.aller.2017.09.026. Epub 2018 Feb 3. Allergol Immunopathol (Madr). 2018. PMID: 29398117 Review.
-
Mechanism of Rhinovirus Immunity and Asthma.Front Immunol. 2021 Oct 6;12:731846. doi: 10.3389/fimmu.2021.731846. eCollection 2021. Front Immunol. 2021. PMID: 34691038 Free PMC article. Review.
Cited by
-
Biological Significance of Dual Mutations A494D and E495K of the Genotype III Newcastle Disease Virus Hemagglutinin-Neuraminidase In Vitro and In Vivo.Viruses. 2022 Oct 25;14(11):2338. doi: 10.3390/v14112338. Viruses. 2022. PMID: 36366435 Free PMC article.
-
Cutaneous and Mucosal Manifestations of Sjögren's Syndrome.Clin Rev Allergy Immunol. 2017 Dec;53(3):357-370. doi: 10.1007/s12016-017-8639-y. Clin Rev Allergy Immunol. 2017. PMID: 28871434 Review.
-
Rhinovirus-induced anti-viral interferon secretion is not deficient and not delayed in sinonasal epithelial cells of patients with chronic rhinosinusitis with nasal polyp.Front Immunol. 2022 Oct 21;13:1025796. doi: 10.3389/fimmu.2022.1025796. eCollection 2022. Front Immunol. 2022. PMID: 36341332 Free PMC article.
-
Mucosal Immunity against SARS-CoV-2 in the Respiratory Tract.Pathogens. 2024 Jan 26;13(2):113. doi: 10.3390/pathogens13020113. Pathogens. 2024. PMID: 38392851 Free PMC article. Review.
-
Postnatal Innate Immune Development: From Birth to Adulthood.Front Immunol. 2017 Aug 11;8:957. doi: 10.3389/fimmu.2017.00957. eCollection 2017. Front Immunol. 2017. PMID: 28848557 Free PMC article. Review.
References
-
- Tantilipikorn P. The relationship between allergic rhinitis and viral infections. Curr Opin Otolaryngol Head Neck Surg 2014; 22:249–52. - PubMed
-
- Marsland BJ, Scanga CB, Kopf M, Le Gros G. Allergic airway inflammation is exacerbated during acute influenza infection and correlates with increased allergen presentation and recruitment of allergen‐specific T‐helper type 2 cells. Clin Exp Allergy 2004; 34:1299–306. - PubMed
MeSH terms
Substances
LinkOut - more resources
Full Text Sources
Other Literature Sources
Medical
Research Materials
