

The Racial and Ethnic Representation of Faculty in US Pharmacy Schools and Colleges
- PMID: 27667845
- PMCID: PMC5023979
- DOI: 10.5688/ajpe806108
The Racial and Ethnic Representation of Faculty in US Pharmacy Schools and Colleges
Abstract
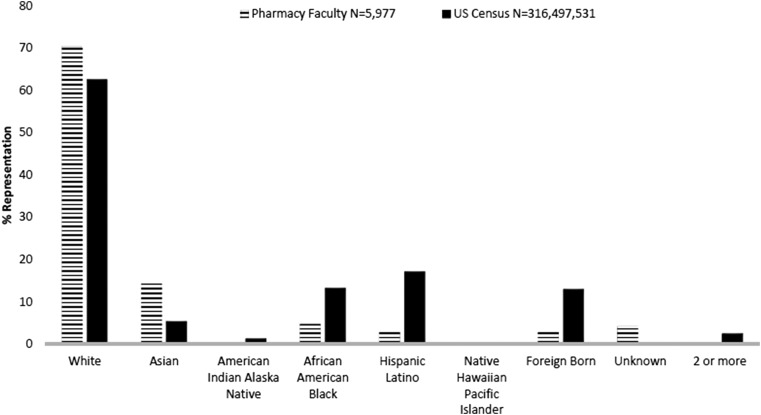
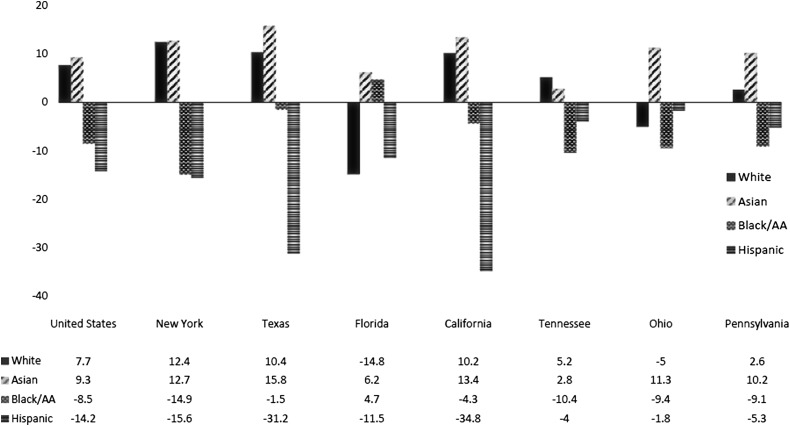
Objective. To describe the representation of racial and ethnic minorities among faculty members (faculty) in schools and colleges of pharmacy (COP) compared to US Census Bureau data; to evaluate the representation of racial and ethnic minorities in historically black colleges and universities (HBCUs), newer doctor of pharmacy (PharmD) programs, and PharmD programs with a religious affiliation compared with all pharmacy programs; and to compare racial and ethnic pharmacy faculty data to trends in medical and dental schools, and all higher education. Methods. Information was obtained from national databases and published reports; data was comparatively evaluated. Results. Compared to the general population, Asians are overrepresented in pharmacy, while all other minority groups are underrepresented. The HBCUs, newer schools, and religious-affiliated institutions have greater numbers of African American/Black faculty. Newer schools also have better representation of Hispanic faculty. Pharmacy has been more successful than medicine and dentistry in recruiting African American/Black faculty, but lag behind dental schools in their representation of Hispanic faculty. Conclusion. To meet the health care needs of the population, we recommend the implementation of short-term and long-term diversity and inclusion strategies that address minority representation in COP.
Keywords: census; diversity; ethnicity; faculty; race.
Figures
References
-
- The American Association of Colleges of Pharmacy Ad Hoc Committee on Affirmative Action and Diversity. Final Report, October 2000. http://www.aacp.org/resources/studentaffairspersonnel/admissionsguidelin.... Accessed May 4, 2015.
-
- Levsen VB, Goettel N, Chong F, Farris R. Do we practice diversity in business schools? Int J Educ Manage. 2001;15(4):167–171.
-
- Moradi B, Neimeyer GJ. Diversity in the ivory white tower: a longitudinal look at faculty race/ethnicity in counseling psychology academic training programs. Couns Psychol. 2005;33(5):655–675.
-
- Davis SP, Davis M. Experiences of ethnic minority faculty employed in predominantly white schools of nursing. J Cult Divers. 1998;5(2):68–76. - PubMed
Publication types
MeSH terms
LinkOut - more resources
Full Text Sources
Other Literature Sources
