. 2016 Sep 26:5:e17047.
doi: 10.7554/eLife.17047.

Modelling TFE renal cell carcinoma in mice reveals a critical role of WNT signaling

Affiliations

Modelling TFE renal cell carcinoma in mice reveals a critical role of WNT signaling

Alessia Calcagnì et al. Elife. .

Abstract

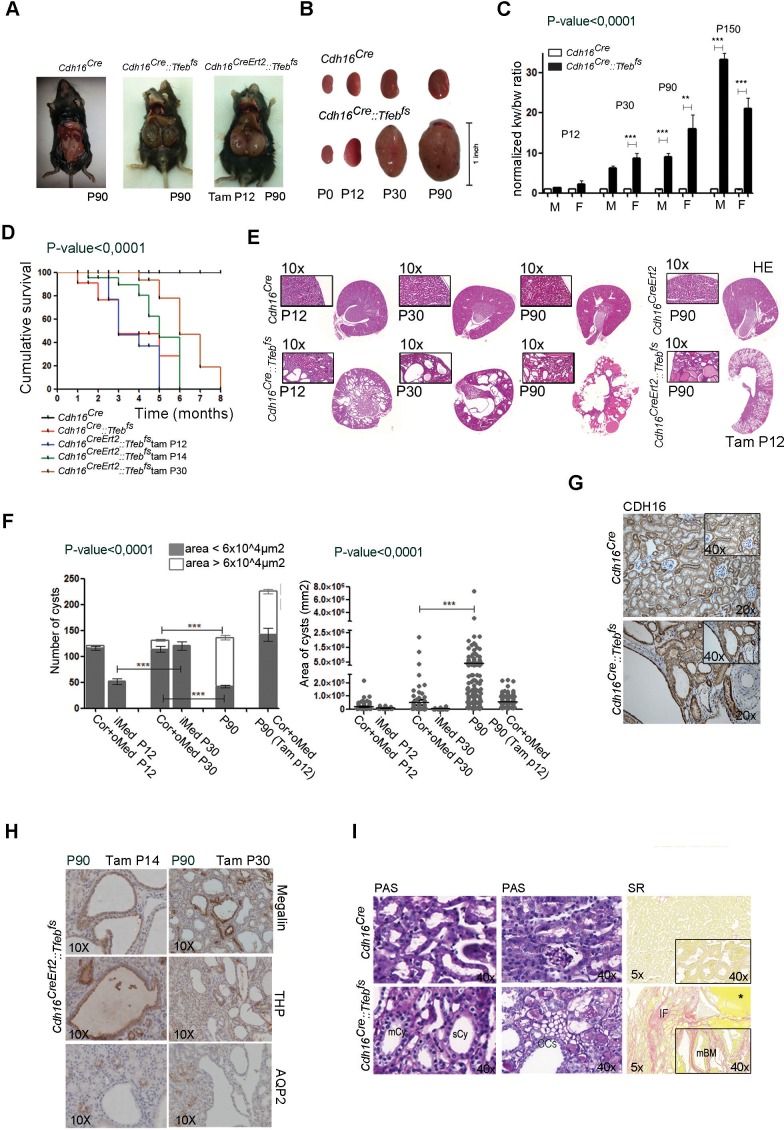
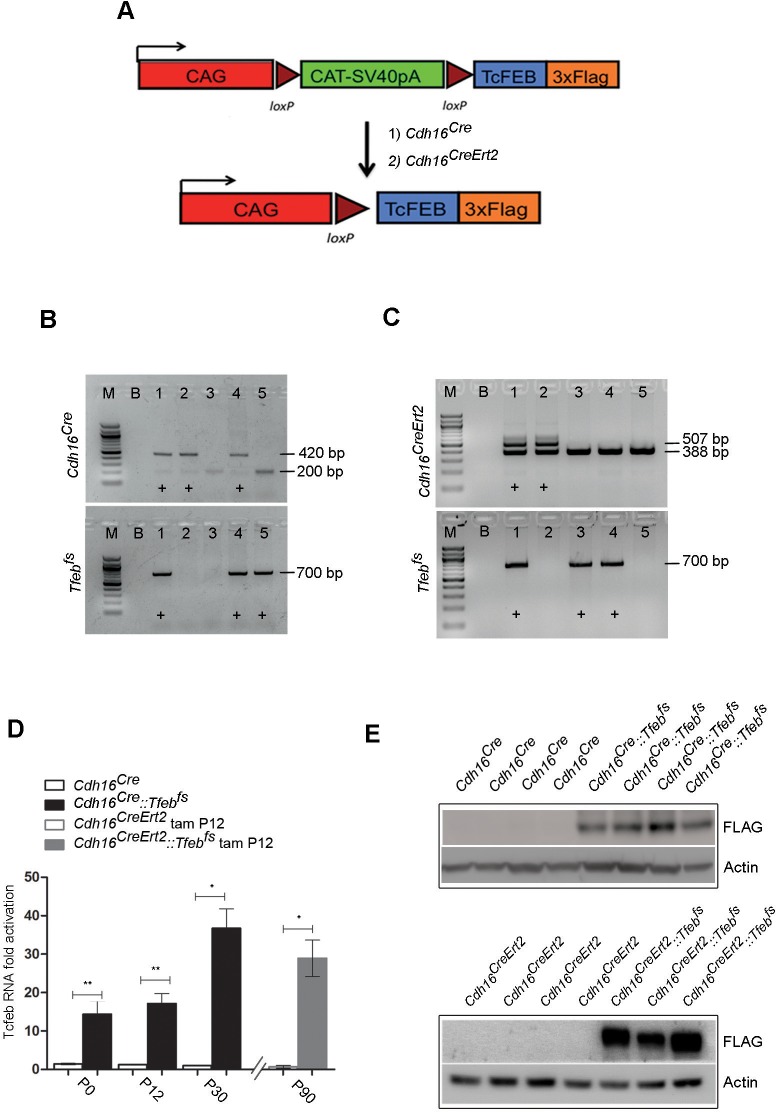
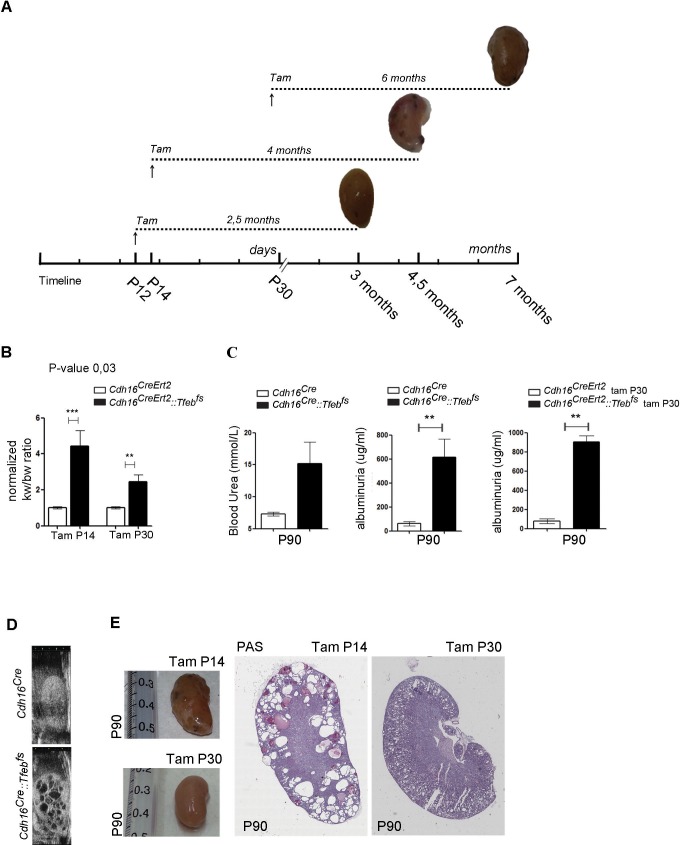
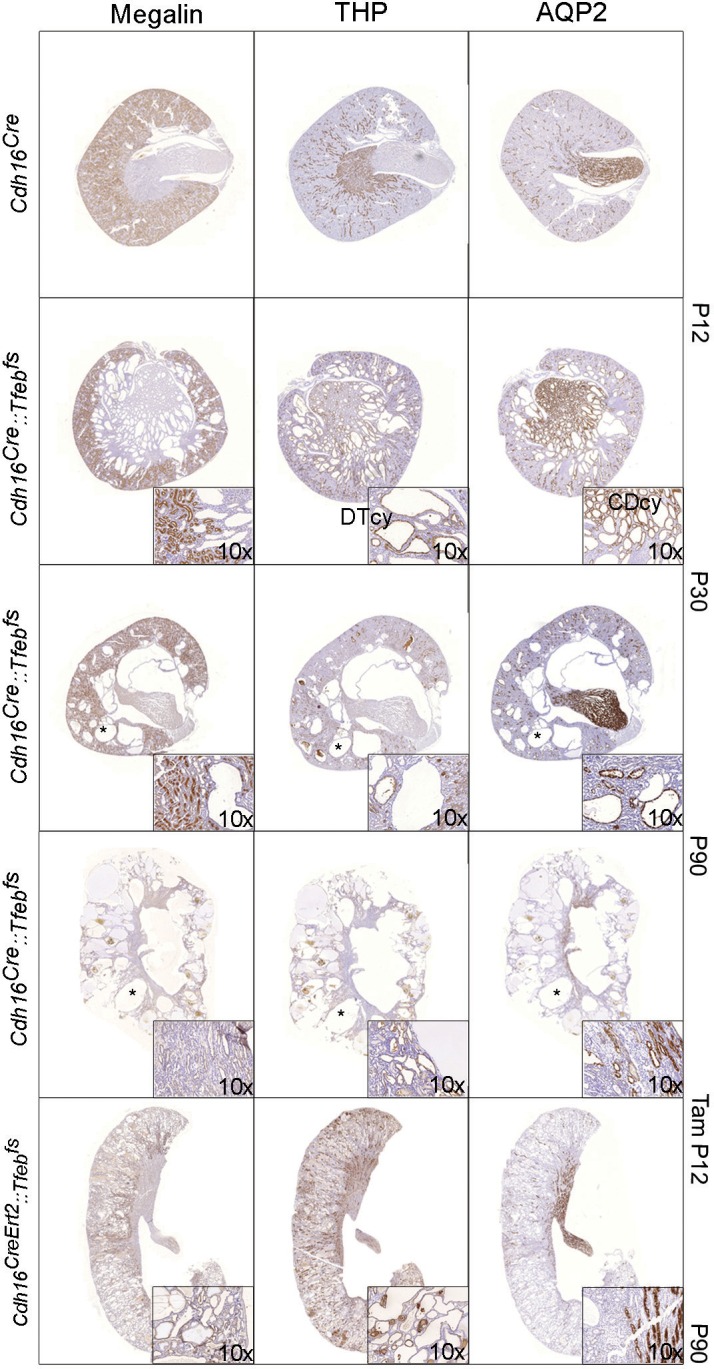
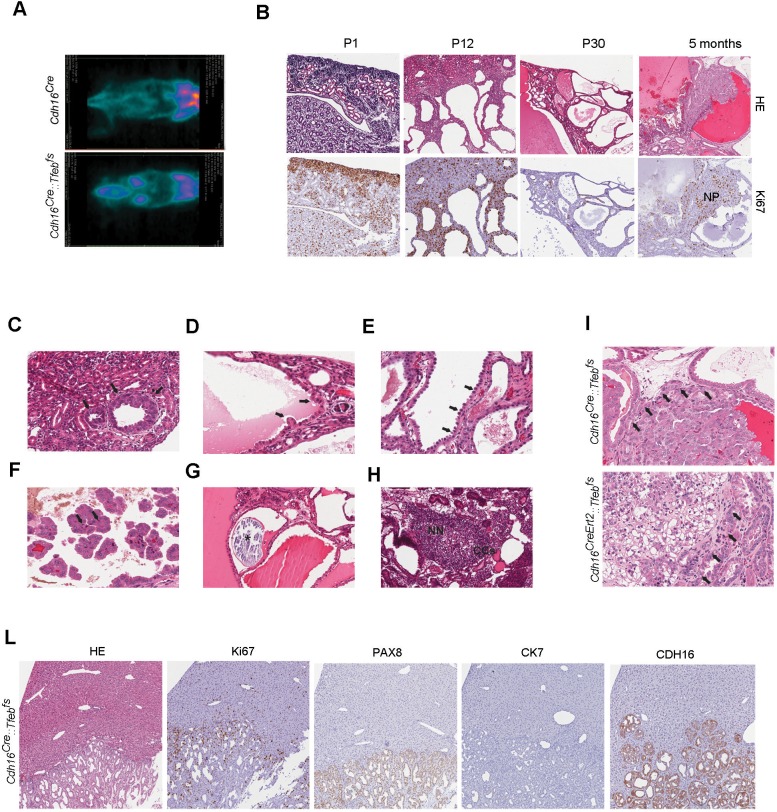
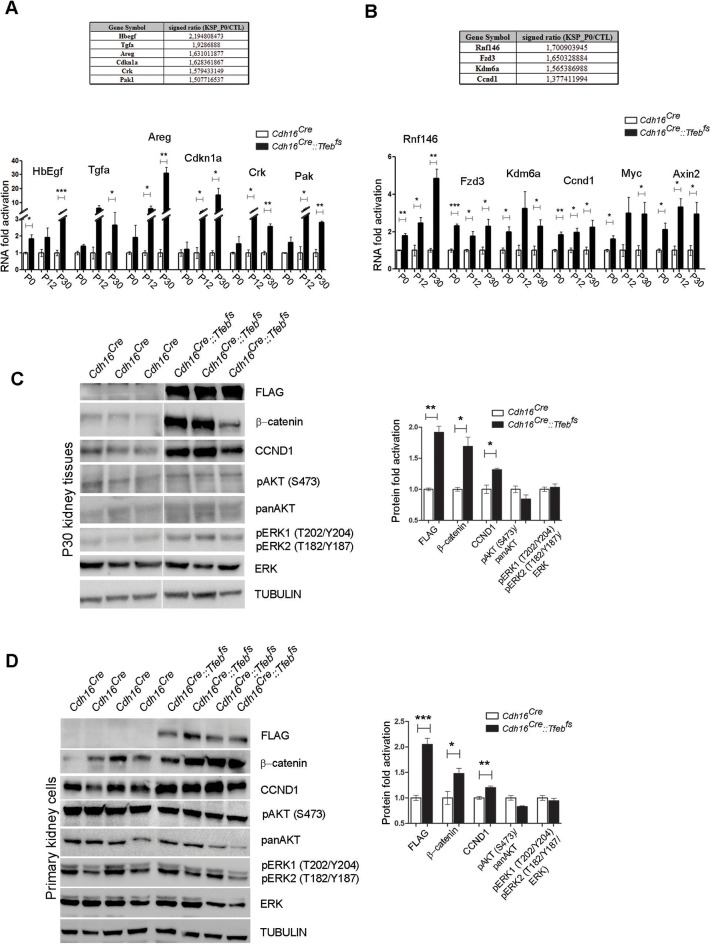
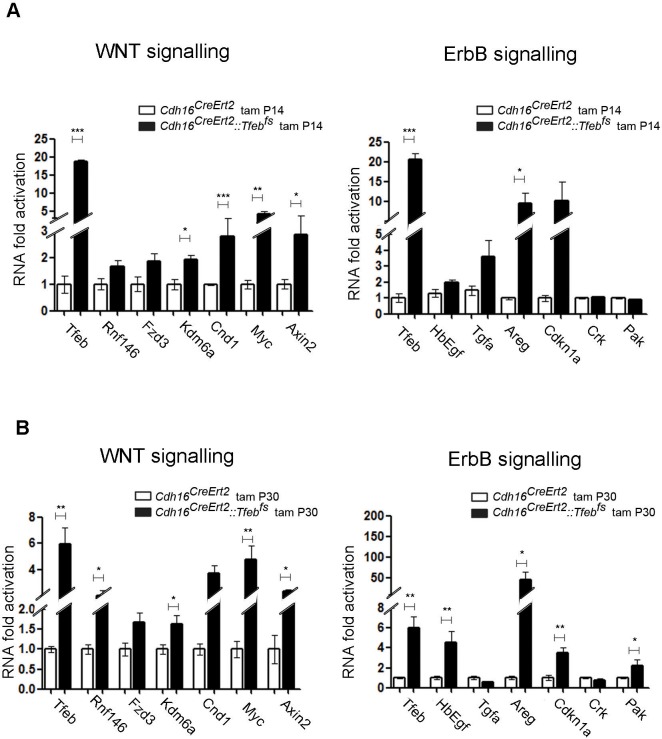
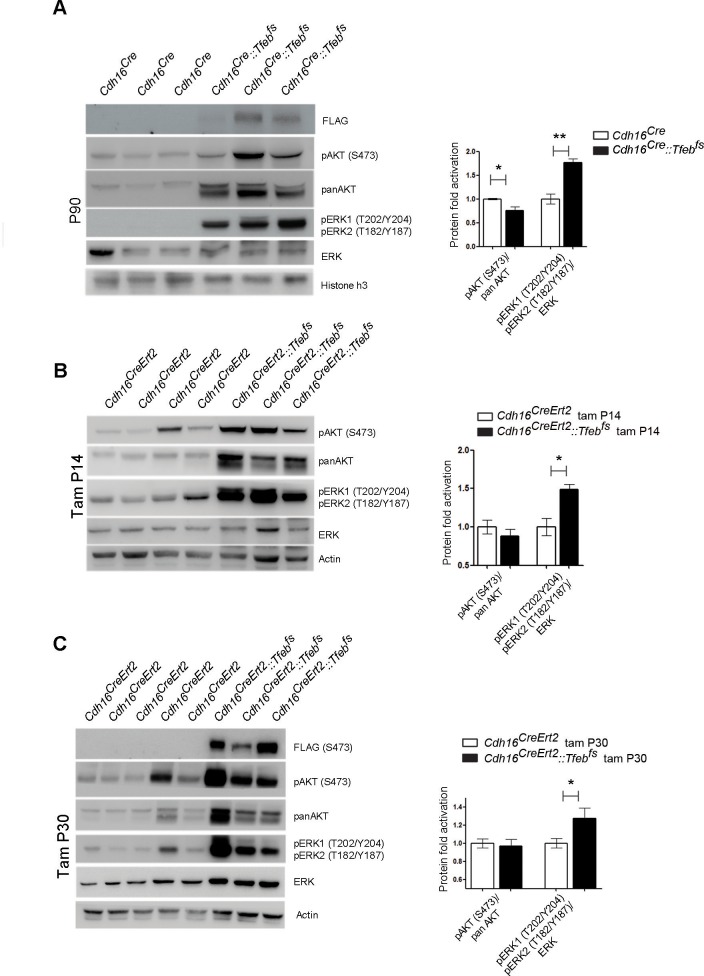
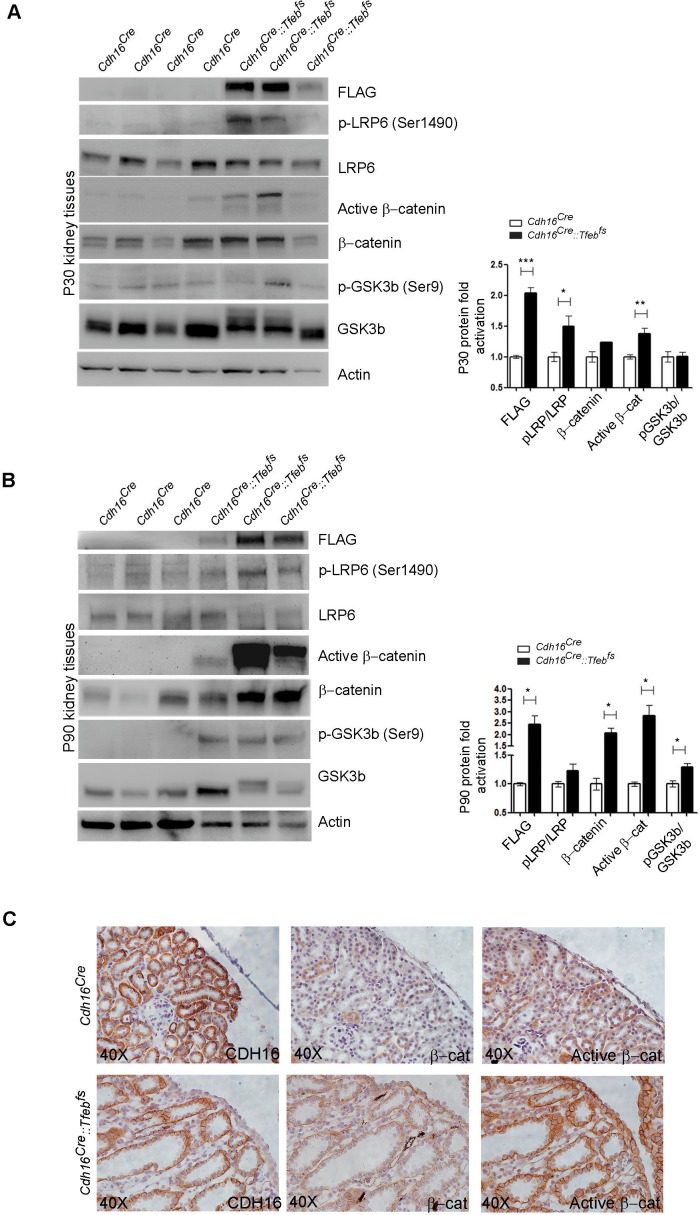
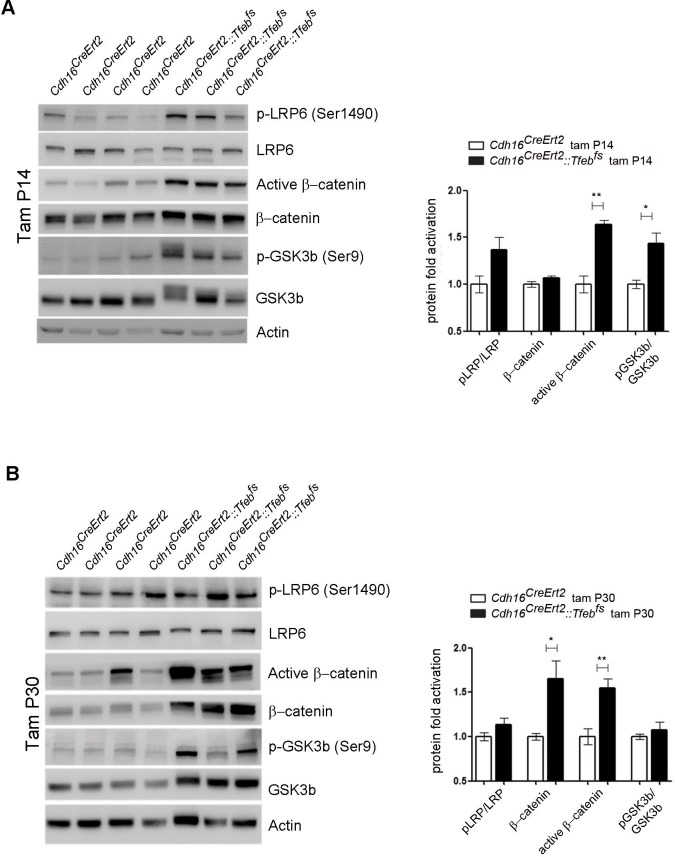
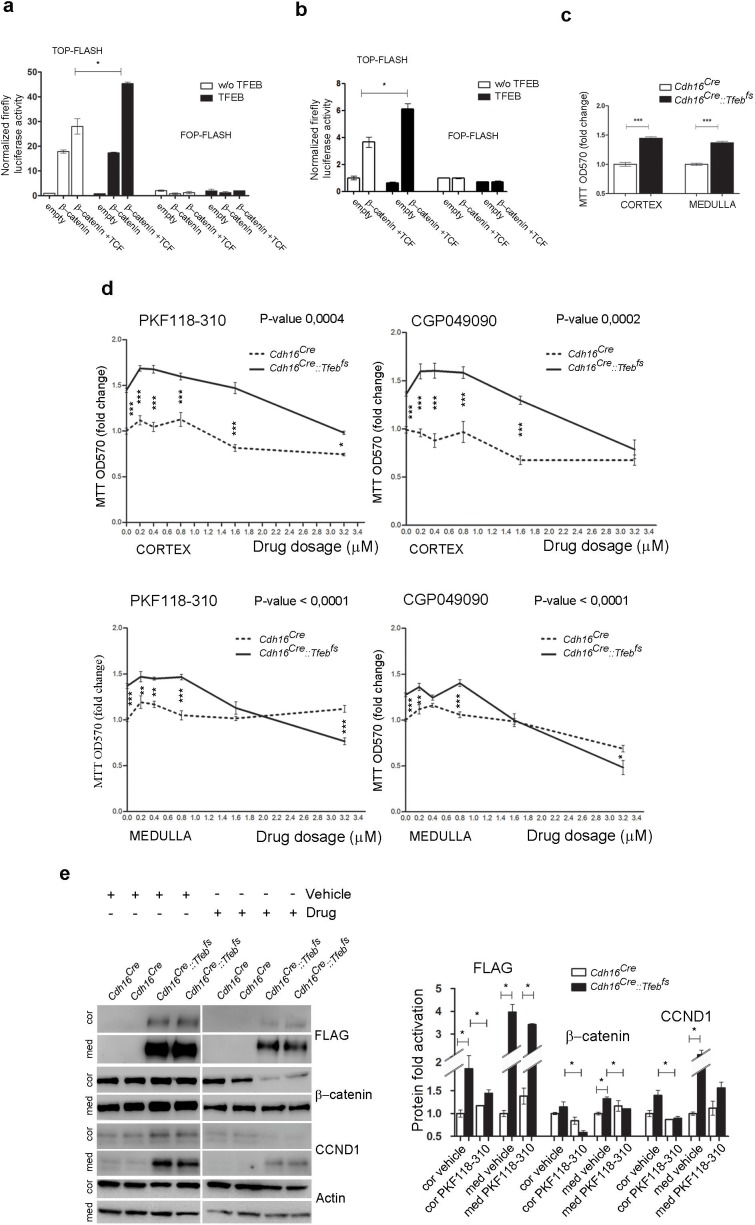
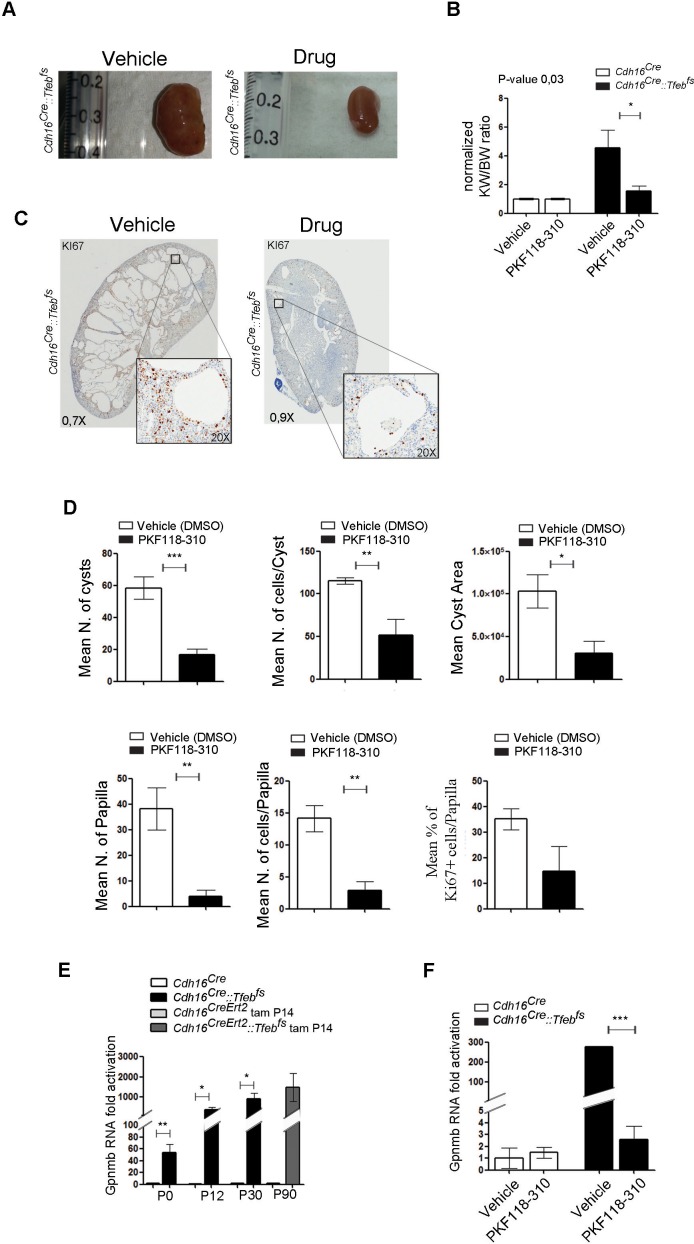
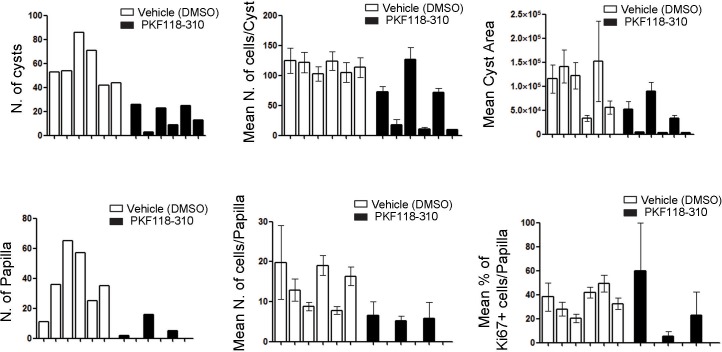
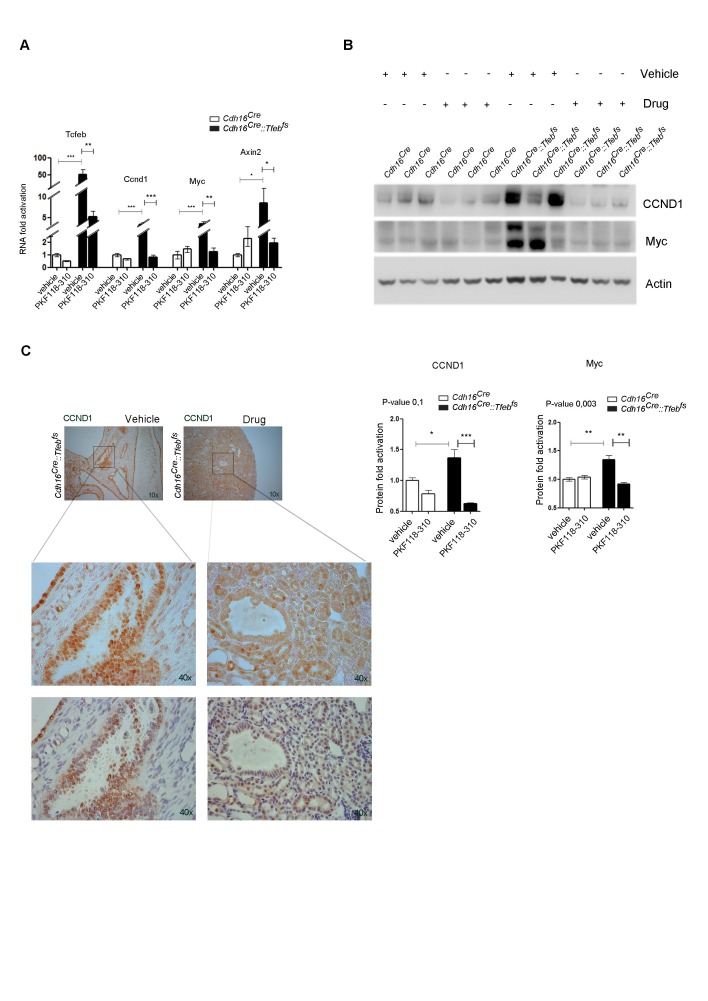
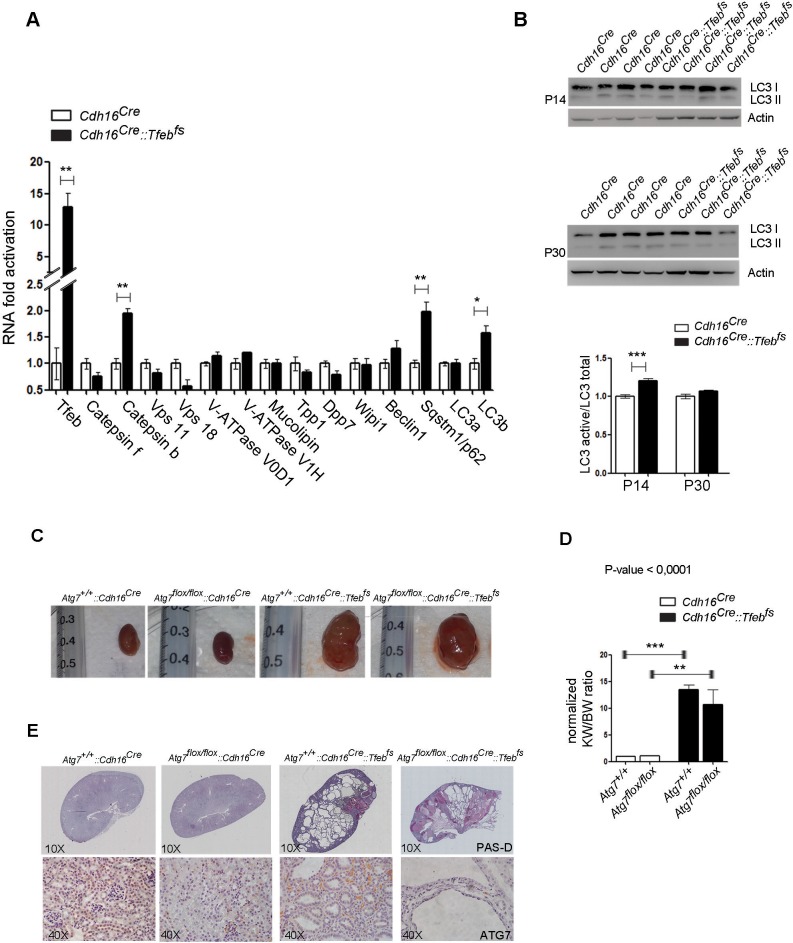
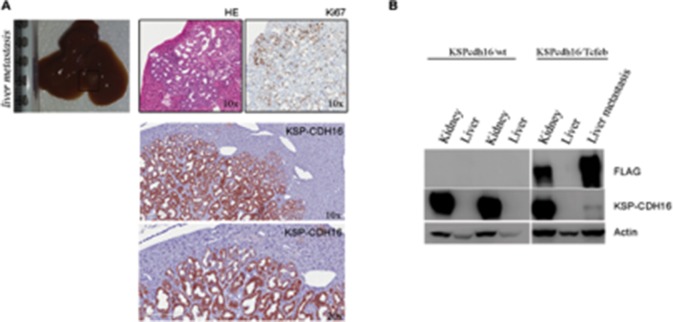
TFE-fusion renal cell carcinomas (TFE-fusion RCCs) are caused by chromosomal translocations that lead to overexpression of the TFEB and TFE3 genes (Kauffman et al., 2014). The mechanisms leading to kidney tumor development remain uncharacterized and effective therapies are yet to be identified. Hence, the need to model these diseases in an experimental animal system (Kauffman et al., 2014). Here, we show that kidney-specific TFEB overexpression in transgenic mice, resulted in renal clear cells, multi-layered basement membranes, severe cystic pathology, and ultimately papillary carcinomas with hepatic metastases. These features closely recapitulate those observed in both TFEB- and TFE3-mediated human kidney tumors. Analysis of kidney samples revealed transcriptional induction and enhanced signaling of the WNT β-catenin pathway. WNT signaling inhibitors normalized the proliferation rate of primary kidney cells and significantly rescued the disease phenotype in vivo. These data shed new light on the mechanisms underlying TFE-fusion RCCs and suggest a possible therapeutic strategy based on the inhibition of the WNT pathway.

Keywords: TFEB; WNT pathway; cancer biology; human biology; medicine; mouse; renal cell carcinoma.


Conflict of interest statement

The authors declare that no competing interests exist.

Figures

Figure 1.
Figure 1.. Tfeb overexpressing mice display cystic kidneys.
Morphological analyses were performed on Cdh16Cre and Cdh16Cre::Tfebfs, and on tam-treated Cdh16CreErt2 and Cdh16CreErt2::Tfebfs mice. (A) Representative images of the abdominal cavity at P90. (B) Kidney size at different stages (p=days post-natal). (C) Relative ratio of kidney-to-body weight (KW/BW). Data from males (M) and females (F) are shown separately as means of Cdh16Cre::Tfebfs to Cdh16Cre KW/BW ratio. Three-way Anova was applied (factors: gender, time, genotype). (D) Evaluation of the survival of Cdh16Cre::Tfebfs and tam-treated Cdh16CreErt2::Tfebfs mice. Mantel-Cox test was applied (Cdh16CreErt2::Tfebfs tam P12/tam P14 p-value 0.02; Cdh16CreErt2::Tfebfs tam P12/P30 p-value<0.0001). (E) Haematoxylin and Eosin (HE) staining of kidneys. Enlarged panels show cyst growth over time. (F) Number (left graph) and area (right graph) of kidney cysts in Cdh16Cre::Tfebfs, and Cdh16CreErt2::Tfebfs mice. Number of cysts is shown as an average (± SEM) with bars sub-divided according to the dimension of the cysts. Cyst areas are presented as independent values (dots) with lines representing the means. Three-way (cyst number) and two-way (cyst area) Anova was applied. Cor, cortex; oMed, outer medulla; iMed, inner medulla. (G) Cadherin16 (CDH16) staining of kidneys from P30 mice. (H) Megalin, THP and AQP2 stainings in P90 Cdh16CreErt2::Tfebfs mice. (I) PAS and Sirius Red staining. PAS staining shows the presence of single-layered or multi-layered cysts, and the presence of Clear Cells (CCs). SR staining shows areas of interstitial fibrosis, multi-layered basement membrane and protein casts. Asterisks, protein casts; sCy, simple Cysts; mCy, multilayered Cy; IF, Interstitial Fibrosis; mBM, multi-layered Basement Membrane. (*p<0.05, **p<0.01, ***p<0.001). DOI: http://dx.doi.org/10.7554/eLife.17047.002
Figure 1—figure supplement 1.
Figure 1—figure supplement 1.. Generation of transgenic mouse lines with kidney-specific Tfeb overexpression.
(A) Map of the transgene: Tfeb-3xFLAG was inserted after the chicken actin promoter (CAG) and the chloramphenicol acetyltransferase (CAT)-SV40pA flanked by loxP sites. The latter can be removed by CRE recombinase, resulting in the overexpression of the Tfeb gene under the control of the strong CAG promoter. Two different CRE lines were used: (1) a constitutive kidney-specific Cdh16Cre(Cadherin 16) and (2) a tamoxifen-inducible Cdh16CreErt2. (B, C) Representative genotypes of littermates. (B) Lanes 1 and 4 indicate double heterozygous Cdh16Cre::Tfebfs mice as they carry both the Cdh16Cre (420 bp CRE band, 200 bp wt band) and the Tfebfs transgenes (700 bp) (M, marker; B, Blank). (C) Lane 1 indicates a double heterozygous Cdh16CreErt2::Tfebfs mouse as it carries both the Cdh16CreErt2 (507 bp Cre band, 388 bp wt band) and the Tfebfs transgenes (700 bp). (D) Real-time PCR analysis of Tfeb-3xFLAG mRNA levels performed on Cdh16Cre and Cdh16Cre::Tfebfs mice at different stages (P0, P12, P30) and on Cdh16CreErt2and Cdh16CreErt2::Tfebfs mice induced with tamoxifen at P12 and sacrificed at P90. Values are shown as the average (± SEM) of at least three animals per time point and genotype (*p<0. 05, **p<0.01, two-sided, Student’s t test). (E) Immunoblot analysis using an anti-Flag antibody to determine the expression of Tfeb-3xFLAG protein in Cdh16Cre::Tfebfs and tam-treated Cdh16CreErt2::Tfebfs mice. Each replicate is a different biological sample. DOI: http://dx.doi.org/10.7554/eLife.17047.003
Figure 1—figure supplement 2.
Figure 1—figure supplement 2.. Renal-specific Tfeb overexpression results in kidney enlargement and failure.
(A) Tamoxifen injection of Cdh16CreErt2::Tfebfs mice at P12, P14 and P30 with representative images at the time of sacrifice (tam, tamoxifen). (B) Relative ratio of kidney to body weight (KW/BW) evaluated in tam-treated Cdh16CreErt2::Tfebfs mice at P90. Two-way Anova was applied (factors: treatment, genotype). (C) Blood urea and albuminuria levels in Cdh16Cre::Tfebfs and Cdh16CreErt2::Tfebfs mice. Values are shown as means (± SEM) of at least three Cdh16Cre::Tfebfs and Cdh16CreErt2::Tfebfs mice and are normalized versus the control animals (Cdh16Creand Cdh16CreErt2). (D) High-frequency ultrasound (HFUS) images of kidneys from P30 Cdh16Cre::Tfebfs mice. (E) Images and PAS staining from tam-treated Cdh16CreErt2::Tfebfs mice at P90. DOI: http://dx.doi.org/10.7554/eLife.17047.004
Figure 1—figure supplement 3.
Figure 1—figure supplement 3.. Characterization of cyst origin in Cdh16Cre::Tfebfs and Cdh16CreErt2::Tfebfs mice.
IHC staining of megalin, THP and AQP2 at different time points. Insets are enlargements of representative areas of interest. Larger cysts (denoted by an asterisk) are negative for all the markers tested. DTcy = Distal Tubules cysts; CDcy = Collecting Ducts cysts. DOI: http://dx.doi.org/10.7554/eLife.17047.005
Figure 2.
Figure 2.. Kidney-specific Tfeb overexpression is associated with cancer development in Cdh16Cre::Tfebfs and Cdh16CreErt2::Tfebfs mice.
(A) 18F-FDG PET/CT scan on P30 Cdh16Cre::Tfebfs mice. (B) HE and Ki67 staining performed on Cdh16Cre::Tfebfs mice at P1, P12, P30 and 5 months. Beginning at P12 the increase in cyst size is associated with an increase in papillary proliferation that becomes completely neoplastic by 5 months. NP, Neoplastic Papillae. (CH) Representative images of neoplastic lesions at different stages: (C) neoplastic nodules (arrows) in P12 Cdh16Cre::Tfebfs mice; (D) micropapillae (arrows) and (E) hobnail-like cells (arrows) in P30 Cdh16Cre::Tfebfs mice; (F) mitotic spindles (arrows) in 5-month-old Cdh16Cre::Tfebfs mice; (G) microcalcifications (asterisk) in tam-treated Cdh16CreErt2::Tfebfs mice induced at P14 and sacrificed at 5 months; (H) neoplastic nests (NN) and clear cells (CCs) in tam-treated Cdh16CreErt2::Tfebfs mice induced at P12 and sacrificed at P90. (I) HE staining of neoplastic lesions invading the surrounding stroma (arrows) in Cdh16Cre::Tfebfs and in tam-treated Cdh16CreErt2::Tfebfs mice. (L) Liver metastases in 5 month-old Cdh16Cre::Tfebfs mice stained for HE, Ki67, PAX8 and CK7. DOI: http://dx.doi.org/10.7554/eLife.17047.006
Figure 3.
Figure 3.. Activation of ErbB and WNT signaling pathways in kidneys from Cdh16Cre::Tfebfs mice.
Transcriptional and biochemical analyses were performed on Cdh16Cre and Cdh16Cre::Tfebfs mice. (A,B) Tables show the relative increase of genes related to the ErbB (A) and WNT (B) pathways in the microarray analyses performed on kidneys from P0 Cdh16Cre::Tfebfs mice. Graphs show real-time PCR validations performed on kidneys from Cdh16Cre::Tfebfs mice at different stages (P0, P12, P30). Data are shown as the average (± SEM) of at least three Cdh16Cre::Tfebfs mice normalized versus wild-type mice. (C,D) Immunoblot analyses performed on (C) P30 kidney tissues and (D) primary kidney cells isolated from Cdh16Cre::Tfebfs mice to evaluate ErbB and WNT activation status. Each replicate is a distinct biological sample. ErbB signaling was assessed by looking at phosphoAKT (Ser473) to total AKT ratio, and phosphoERK1 (T202/Y204)/ERK2(T185/Y187) to total ERK ratio; WNT signaling was assessed by quantifying β-catenin and CCND1 (Cyclin D1) protein levels. Graphs represent the densitometry quantification of Western blot bands. Values are normalized to actin when not specified and are shown as an average (± SEM) (*p<0.05, **p<0.01, ***p<0.001, two-sided, Student’s t test). DOI: http://dx.doi.org/10.7554/eLife.17047.007
Figure 3—figure supplement 1.
Figure 3—figure supplement 1.. ErbB and WNT transcriptional profiles in Cdh16CreErt2::Tfebfs mice.
Transcriptional analyses performed on Cdh16CreErt2::Tfebfs mice. (A,B) mRNA levels of previously validated genes belonging to the WNT (left graphs) and ErbB (right graphs) signaling pathways assessed in P90 Cdh16CreErt2::Tfebfs mice induced at (A) P14 and at (B) P30 with tamoxifen respectively. Data are shown as the average (± SEM) of at least Cdh16CreErt2::Tfebfs mice and values are normalized to the wild-type line. (*p<0.05, **p<0.01, ***p<0.001, two-sided Student’s t test). DOI: http://dx.doi.org/10.7554/eLife.17047.010
Figure 3—figure supplement 2.
Figure 3—figure supplement 2.. Biochemical analysis of ErbB signaling.
Immunoblot analysis performed on P90 kidneys from Cdh16Cre::Tfebfs mice (A) and P90 Cdh16CreErt2::Tfebfs animals induced with tamoxifen at P14 (B) and at P30 (C), respectively. Each replicate is a different biological sample. ErbB was analyzed by quantifying phosphoAKT (Ser473) to total AKT, and phosphoERK1 (T202/Y204)/ERK2(T185/Y187) to total ERK; graphs are the densitometry quantifications of Western blot bands normalized to wild-type line and are shown as an average (± SEM) (*p<0.05, **p<0.01, ***p<0.001, two-sided Student’s t test). DOI: http://dx.doi.org/10.7554/eLife.17047.011
Figure 4.
Figure 4.. Molecular and histological analysis of WNT signaling.
(A,B) Western blot analysis performed on (A) P30 and (B) P90 kidneys from Cdh16Cre::Tfebfs mice to assess WNT signaling activation by looking at different proteins related to this pathway. Each replicate is a distinct biological sample. p-LRP6 (Ser1490)/LRP6, active β-catenin, β-catenin and p-GSK3β (Ser9)/GSK3β protein levels were quantified by densitometry analysis of the Western blot bands. Values are normalized to actin when not specified, and are shown as an average (± SEM) (*p<0.05, **p<0.01, ***p<0.001, two-sided Student’s t test). (C) Immunohistochemistry staining of CDH16, β-catenin and active β-catenin proteins performed on P30 kidney tissues from Cdh16Cre::Tfebfs mice. DOI: http://dx.doi.org/10.7554/eLife.17047.014
Figure 4—figure supplement 1.
Figure 4—figure supplement 1.. Molecular analysis of WNT signaling pathway in Cdh16CreErt2::Tfebfs animals.
(A,B) Immunoblot analysis of WNT-related proteins performed on P90 Cdh16CreErt2::Tfebfs animals induced with tamoxifen at P14 (A) and at P30 (B). Each replicate is a different biological sample. Graphs show densitometry analysis of the Western blot bands. Values are normalized to actin when not specified, and are shown as an average (± SEM) (*p<0.05, **p<0.01, ***p<0.001, two-sided Student’s t test). DOI: http://dx.doi.org/10.7554/eLife.17047.015
Figure 5.
Figure 5.. Inhibition of WNT signaling rescues the hyper-proliferative phenotype of kidney cells from Cdh16/Tfeb mice.
(A,B) Activity of the TCF/LEF reporter TOP-FLASH. Luciferase activity after co-transfection of β-catenin and TCF plasmids in HEK293 (A) and HK2 (B) cells with and without Tfeb overexpression. Values are shown as an average (± SEM) of each point in duplicate, normalized to the Renilla values and to the basal condition. Data are representative of three independent experiments. (C) MTT tetrazolium reduction assay (MTT) was used to evaluate proliferation of primary kidney cells derived from Cdh16Cre::Tfebfs mice. Values are shown as an average (± SEM) of each point in triplicate and normalized versus wild-type mice. Data are representative of three independent experiments. (D) MTT proliferation assays of primary kidney cells treated independently with two WNT signaling inhibitors, PKF118-310 and CGP049090, added at different dosages for 24 hr. 0 µm represents the basal proliferation of cells. Values are shown as means (± SEM) of three replicates per point normalized to the vehicle (DMSO), added at the same concentration, and versus the Cdh16Cre cells without drug treatment. Results are representative of three independent experiments. Two-way Anova was applied (factors: cell genotype, treatment). (E) Immunoblot analysis on primary kidney cells treated with Drug (PKF118-310) or Vehicle (DMSO) for 24 hr at 1.6 µM. Graphs show the densitometry quantifications of Western blot bands. Values are normalized to actin and are shown as averages (± SEM) (Cor, cortex; Med, medulla). (*p<0.05, **p<0.01, ***p<0.001). DOI: http://dx.doi.org/10.7554/eLife.17047.016
Figure 6.
Figure 6.. Treatment with WNT inhibitor attenuates cystic and neoplastic phenotypes.
Morphological, histological and biochemical analyses performed on Cdh16Cre::Tfebfs mice treated with Vehicle (DMSO) or Drug (PKF118-310). (A,B) Kidney images (A) and sizes (KW/BW) (B) from Cdh16Cre::Tfebfs mice injected intraperitoneally (IP) either with vehicle or drug at 0.85 mg/kg. KW/BW ratios are shown as means (± SEM) and values are normalized to the Cdh16Cre animals treated with vehicle. Two-way ANOVA was applied (factors: treatment, genotype). (C) Ki67 staining of kidneys from Cdh16Cre::Tfebfs mice after treatment with vehicle or drug. Insets are enlargements of a single cyst. (D) Quantification of several parameters related to cysts and papillae performed on kidney sections from vehicle- and PKF118-310-treated Cdh16Cre::Tfebfs mice. (E) Gpnmb mRNA fold activation in kidneys from Cdh16Cre::Tfebfs and tam-treated Cdh16CreErt2::Tfebfs mice at different stages. Values are shown as means (± SEM) of at least three mice and each group is normalized to the proper control (respectively Cdh16Cre and tam-treated Cdh16CreErt2). (F) Gpnmb fold activation in kidneys from Cdh16Cre::Tfebfs mice treated with vehicle or PKF118-310. Values are shown as means (± SEM) of at least three animals per group and are all normalized versus the Cdh16Cre mice treated with vehicle. (*p<0.05, **p<0.01, ***p<0.001, two-sided Student’s t test). DOI: http://dx.doi.org/10.7554/eLife.17047.017
Figure 6—figure supplement 1.
Figure 6—figure supplement 1.. In vivo treatment of Cdh16Cre::Tfebfs mice with the WNT inhibitor PKF118-310 partially rescues cystic and neoplastic phenotypes.
Measurements of different parameters related to the cystic and papillary phenotype on six animals treated with vehicle (DMSO) and six animals treated with drug (PKF118-310). Values are shown as means (± SEM) when appropriate and are represented separately for each animal. DOI: http://dx.doi.org/10.7554/eLife.17047.019
Figure 6—figure supplement 2.
Figure 6—figure supplement 2.. In vivo treatment of Cdh16Cre::Tfebfs mice with the PKF118-310 drug inhibits WNT pathway overactivation.
(A) Tfeb, Cyclin D1, Myc and Axin2 mRNA levels in kidneys from Cdh16Cre and Cdh16Cre::Tfebfs mice treated with vehicle or PKF118-310. Values are shown as the average (± SEM) of four animals per group, and are all normalized to the Cdh16Cre mice treated with vehicle. (B) Biochemical analysis performed on Cdh16Cre and Cdh16Cre::Tfebfs mice treated with vehicle or PKF118-310. Each replicate is a distinct biological sample. Cyclin D1 and MYC protein levels were quantified by densitometry analysis of Western blot bands. Values are normalized to actin when not specified, and are shown as an average (± SEM) of at least three animals per time-point and genotype. Two-way ANOVA was applied (factors: cell genotype, treatment) (*p<0.05, **p<0.01, ***p<0.001). (C) Cyclin D1 staining performed on drug- and vehicle- treated Cdh16Cre::Tfebfs mice before and after the hematoxylin counterstaining. DOI: http://dx.doi.org/10.7554/eLife.17047.020
Figure 6—figure supplement 3.
Figure 6—figure supplement 3.. Inhibition of autophagy in Tfeb overexpressing mice (Atg7flox/flox::Cdh16Cre::Tfebfs) does not affect the cystic phenotype.
(A) Real-time PCR validation of well-known TFEB direct gene targets whose function is related to the lysosomal and autophagic pathways performed on P30 Cdh16Cre::Tfebfs mice. Values are shown as the average (± SEM) of at least three Cdh16Cre::Tfebfs mice and are normalized to wild-type mice (*p<0.05, **p<0.01, ***p<0.001, two-sided Student’s t test). (B) P14 and P30 kidney lysates from Cdh16Cre::Tfebfs animals were evaluated by LC3I/II immunoblot. LC3 active / LC3 total ratios were quantified via densitometry of the Western blot bands (graph). Each replicate is a different biological sample. Values are shown as the average (± SEM) of at least three Cdh16Cre::Tfebfs mice and are normalized to wild-type lines. (*p<0.05, **p<0.01, ***p<0.001, two-sided, Student’s t test). (C) Renal images of (Atg7flox/flox::Cdh16Cre::Tfebfs) double transgenic mice and controls at P30. (D) Kidney-to-body weight ratio (KW/BW) from the different genotypes obtained. Values are normalized to the Atg7flox/flox::Cdh16Cre line and are shown as the average (± SEM) of at least three mice per genotype. One-way Anova was applied (factors: genotype) (*p<0.05, **p<0.01, ***p<0.001). (E) PAS and ATG7 staining of kidneys from the different mouse lines. DOI: http://dx.doi.org/10.7554/eLife.17047.021
Author response image 1.
DOI: http://dx.doi.org/10.7554/eLife.17047.024

References

    1. Aksan I, Goding CR. Targeting the microphthalmia basic helix-loop-helix-leucine zipper transcription factor to a subset of E-box elements in vitro and in vivo. Molecular and Cellular Biology. 1998;18:6930–6938. doi: 10.1128/MCB.18.12.6930. - DOI - PMC - PubMed
    1. Amin MB, Amin MB, Tamboli P, Javidan J, Stricker H, Venturina MD-P, Deshpande A, Menon M, de-Peralta Venturina M. Prognostic impact of histologic subtyping of adult renal epithelial neoplasms: an experience of 405 cases. The American Journal of Surgical Pathology. 2002;26:281–291. doi: 10.1097/00000478-200203000-00001. - DOI - PubMed
    1. Argani P, Antonescu CR, Illei PB, Lui MY, Timmons CF, Newbury R, Reuter VE, Garvin AJ, Perez-Atayde AR, Fletcher JA, Beckwith JB, Bridge JA, Ladanyi M. Primary renal neoplasms with the ASPL-TFE3 gene fusion of alveolar soft part sarcoma: a distinctive tumor entity previously included among renal cell carcinomas of children and adolescents. The American Journal of Pathology. 2001;159:179–192. doi: 10.1016/S0002-9440(10)61684-7. - DOI - PMC - PubMed
    1. Argani P, Hicks J, De Marzo AM, Albadine R, Illei PB, Ladanyi M, Reuter VE, Netto GJ. Xp11 translocation renal cell carcinoma (RCC): extended immunohistochemical profile emphasizing novel RCC markers. The American Journal of Surgical Pathology. 2010;34:1295–1303. doi: 10.1097/PAS.0b013e3181e8ce5b. - DOI - PMC - PubMed
    1. Argani P, Ladanyi M. Translocation carcinomas of the kidney. Clinics in Laboratory Medicine. 2005;25:363–378. doi: 10.1016/j.cll.2005.01.008. - DOI - PubMed