. 2016 Nov;48(11):1359-1369.
doi: 10.1038/ng.3681. Epub 2016 Sep 26.

TSHZ3 deletion causes an autism syndrome and defects in cortical projection neurons

Affiliations

TSHZ3 deletion causes an autism syndrome and defects in cortical projection neurons

Xavier Caubit et al. Nat Genet. 2016 Nov.

Abstract

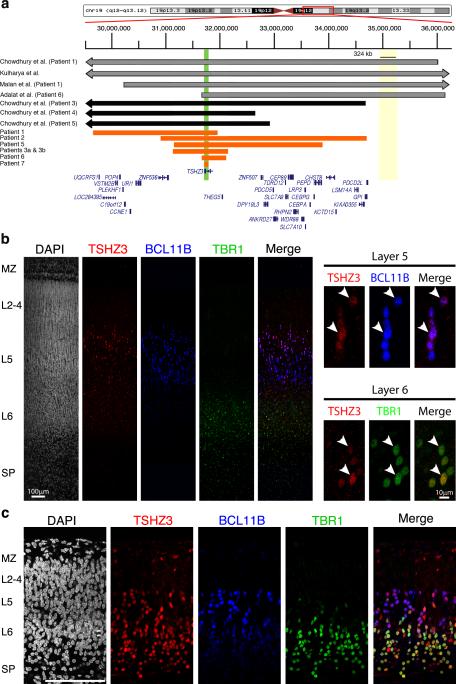
TSHZ3, which encodes a zinc-finger transcription factor, was recently positioned as a hub gene in a module of the genes with the highest expression in the developing human neocortex, but its functions remained unknown. Here we identify TSHZ3 as the critical region for a syndrome associated with heterozygous deletions at 19q12-q13.11, which includes autism spectrum disorder (ASD). In Tshz3-null mice, differentially expressed genes include layer-specific markers of cerebral cortical projection neurons (CPNs), and the human orthologs of these genes are strongly associated with ASD. Furthermore, mice heterozygous for Tshz3 show functional changes at synapses established by CPNs and exhibit core ASD-like behavioral abnormalities. These findings highlight essential roles for Tshz3 in CPN development and function, whose alterations can account for ASD in the newly defined TSHZ3 deletion syndrome.


Conflict of interest statement

The authors declare no competing financial interests.

Figures

Figure 1
Figure 1. Schematic of deletions of the TSHZ3 locus and TSHZ3 expression in the human and mouse fetal neocortex
(a) An ideogram of chromosome 19 and the relevant interval of 19q12q13.12 are displayed at the top. Horizontal bars represent deletions spanning the TSHZ3 gene. Orange bars are for individuals from this study. These new cases allow delineating a novel minimal region of overlap (MRO) of approximately 50kb ([hg19] chr19:31,765,881-31,812,396) represented by a vertical green box, which spans the TSHZ3 gene only. This MRO, which corresponds to the deletion found in patient 7, uncovers the second exon and part of the intron of TSHZ3. Grey and black bars are for published cases deleting TSHZ3 with or without deletion of a previously described MRO (vertical yellow box) for the syndrome associated with 19q13.11 microdeletions. (b) Expression of TSHZ3 (red) and of markers of deep layers cortical neurons BCL11B (blue) and TBR1 (green) in the human cerebral cortex at 20 weeks of gestation and (c) in coronal brain sections of the mouse cortex at E18.5. Scale bar = 100 μm in (b) and 50 μm in (c). L2-6: Cortical layers 2-6; MZ: Marginal zone; SP: Subplate. In b, arrowheads point to double positive cells.
Figure 2
Figure 2. Tshz3lacZ/lacZ mice show altered gene expression of cortical layer markers at E18.5
(a) Venn diagram identifying the DEX genes common or specific to cortical neuron subtypes (CaPN, callosal projection neurons; CThPN, corticothalamic projection neurons; ScPN, subcerebral projection neurons). (b) Fold changes (FC, log2 scale) in the 52 DEX genes that are preferentially expressed in L5 and/or L6 in Tshz3lacZ/lacZ cortex vs. wild-type. *indicate genes also expressed in the subplate. (c) In situ hybridization for selected DEX genes on coronal brain sections (Fezf2, Gdf10, Ramp3, Hs3st4, Stac2, Col5a1), CPLX3 immunoreactivity and mRNA level variation ± s.e.m. (n = 3) analyzed by qRT-PCR in Tshz3lacZ/lacZ versus wild-type mice. Scale bars, 100 μm. * p<0.05; ** p<0.02 by unpaired two-tailed t test. In c, arrowheads point to CPLX3 positive cells. (d) Human brain and nervous system pathologies associated with orthologs of the 52 Tshz3-regulated DEX genes. Scores: 1, one study; 2, two studies; 3, three or more studies. ADHD: attention deficit/hyperactivity disorder; ALS: amyotrophic lateral sclerosis; ASD: autism spectrum disorder; OCD: obsessive compulsive disorder.
Figure 3
Figure 3. Cortical layering and major axonal tracts are preserved in Tshz3lacZ/lacZ brains at E18.5
(a) Staining of markers that allow the distinction of cortical layers in coronal brain sections of the mouse cortex at E18.5. DAPI (blue). (b) L1-CAM (L1, green) and neurofilament (NF, red) and (c) L1-CAM (L1, white) immunostainings of coronal brain sections at E18.5. Numbered arrows point to: (1) fibers in the cortical intermediate zone, (2) striatal axonal bundles, (3) anterior commissure, (4) corpus callosum, (5) internal capsule, (6) optic chiasm, (7) optic tract, (8) cerebral peduncle, (9) corticothalamic tract. Hp: hippocampus; Nctx: neocortex; Thal: thalamus. Scale bars: 50 μm (a), 1 mm (b) and 0.5 mm (c).
Figure 4
Figure 4. Tshz3+/lacZ mice exhibit altered expression of genes in the neocortex from embryonic to postnatal stages but main projection systems from deep CPNs are preserved
(a) Quantitative-PCR analyses of DEX genes in the cortex of Tshz3+/lacZ (n=6) and wild-type (n=6) at E18.5, P5 and P20. Data are expressed as mean ± s.e.m. * p<0.05; ** p<0.02; *** p<0.005; unpaired t test. (b) Immunodetection of TSHZ3 (red) and BCL11B (green) in the cortex and the striatum. Boxed regions are magnified. TSHZ3/BCL11B double positive neurons are found in L6 and L5 but not in L2/3. The few TSHZ3 positive cells found in the striatum are not positive for BCL11B, a marker of MSNs. (c) Ipsilateral L5 (red) and L6 (green) cortical neurons are labeled 10 days after unilateral injection of cholera toxin B conjugated with Alexa-Fluor 488 into the striatum and conjugated with Alexa Fluor 647 into the thalamus in P28-old wild-type and Tshz3+/lacZ mice, showing that the corticostriatal and corticothalamic tracts are present in the mutant and L5/L6 layering is preserved. cc: corpus callosum; st: striatum; WT: wild-type. Scale bars 200 μm.
Figure 5
Figure 5. Altered corticostriatal synaptic transmission and plasticity in Tshz3+/lacZ mice
(a) Scheme of a mouse brain coronal slice with a CPN (dark gray), the stimulating electrode on the corpus callosum and the recording electrode on a striatal MSN (light gray). (b-f) Sample sizes (n) refer to the number of recorded MSNs. (b) PPR is lower in Tshz3+/lacZ compared to wild-type (WT) mice [F(1,144)=38.7 (2-way ANOVA); *p<0.05, **p<0.01, ***p<0.001 (Bonferroni post-test)], suggesting increased AP-dependent glutamate release from corticostriatal synapses (traces show samples of 2 consecutive EPSCs normalized to EPSC1). (c) mEPSCs frequency (left graph: inter-event interval, p>0.05, 2-samples Kolmogorov-Smirnov test, 5 ms bins; right histogram: average frequency, p>0.05, Mann-Whitney test; traces show samples of mEPSCs) and (d) mEPSC amplitude (left graph: p>0.05, 2-samples Kolmogorov-Smirnov test, 1 pA bins; right histogram: p>0.05, Mann-Whitney test), as well as (e) AMPA/NMDA ratio, are similar between Tshz3+/lacZ and WT mice, suggesting that heterozygous Tshz3 loss affects neither AP-independent glutamate release from corticostriatal synapses, nor ionotropic glutamate receptor sensitivity on striatal MSNs. (f) While corticostriatal LTP is induced in both WT and Tshz3+/lacZ mice, this form of synaptic plasticity is significantly enhanced in mutants; left graph shows the time-course of EPSC amplitude (gray bar represents LTP induction protocol); right histogram shows the average EPSC amplitude after LTP induction (values are normalized to baseline; $p<0.001 vs. baseline, *p<0.001, Mann-Whitney test); traces depict sample EPSCs before (black) and after (gray) the induction of LTP in the two groups. Data are expressed as mean ± s.e.m.
Figure 6
Figure 6. Tshz3+/lacZ mice display autism-like behavioral deficits
(a-d) Social behavior. (a) Experimental design. Tshz3+/lacZ mice have (b) normal activity in habituation, but (c) impaired sociability and (d) no preference for social novelty. The interaction genotype × sociability × social novelty is significant (F(1,22) = 39.88; p < 0.001; partial η2 = 0.64). The interactions genotype × sociability and genotype × social novelty are significant (ps < 0.001; partial η2 ≥ 0.48). Unlike wild-type, Tshz3+/lacZ do not show higher number of contacts with a stranger B6 vs a lure (wild-type: dependent-t (11) = 4.53; d = 1.31; Tshz3+/lacZ : dependent-t < 1) and with a stranger SWR vs the familiar B6 (wild-type: dependent-t (11) = 4.42; d = 1.28; Tshz3+/lacZ: dependent-t (11) = 1.40). (e-i) Narrowness of the field of interest. Tshz3+/lacZ mice (e) bury more marbles (t(22)= 4.77; d = 1.96), (f) perform equivalent number of dips but (g) perform more stereotyped dips (t(22)= 4.41; d = 1.82). In the open field, Tshz3+/lacZ mice (h) travel similar distance but (i) cross less the zones (t(22) = 3.33; d = 1.36). (j-l) Anxiety-like behavior. (j) Tshz3+/lacZ mice spend less time in the open-field central area, with differences in each period (ts(22) ≥ 3.48; ds ≥ 1.17). In the elevated plus-maze, Tshz3+/lacZ mice travel (k) a similar total distance compared to wild-type (t < 1), but (l) a smaller distance in the open arms (t(22) = 5.02; d = 2.05). ** p < 0.001; *** p < 0.0001. Data are mean ± s.e.m. from 12 mice per group.

References

References for main text

    1. Association, A.P. Diagnostic and Statistical Manual of Mental Disorders, DSM-5. Fifth Edition American Psychiatric Association; Washington, DC: 2013.
    1. Buxbaum JD, et al. The autism sequencing consortium: large-scale, high-throughput sequencing in autism spectrum disorders. Neuron. 2012;76:1052–6. - PMC - PubMed
    1. Parikshak NN, et al. Integrative functional genomic analyses implicate specific molecular pathways and circuits in autism. Cell. 2013;155:1008–21. - PMC - PubMed
    1. State MW, Sestan N. Neuroscience. The emerging biology of autism spectrum disorders. Science. 2012;337:1301–3. - PMC - PubMed
    1. Willsey AJ, et al. Coexpression networks implicate human midfetal deep cortical projection neurons in the pathogenesis of autism. Cell. 2013;155:997–1007. - PMC - PubMed

Methods-only references

    1. Paxinos G, Franklin KBJ. The mouse brain in stereotaxic coordinates. Second edition Academic Press; 2001.
    1. Kim D, et al. TopHat2: accurate alignment of transcriptomes in the presence of insertions, deletions and gene fusions. Genome Biol. 2013;14:R36. - PMC - PubMed
    1. Langmead B, Salzberg SL. Fast gapped-read alignment with Bowtie 2. Nat. Methods. 2012;9:357–9. - PMC - PubMed
    1. Banerjee-Basu S, Packer A. SFARI Gene: an evolving database for the autism research community. Dis. Models Mech. 2010;3:133–5. - PubMed
    1. Chassain C, et al. Metabolic, synaptic and behavioral impact of 5-week chronic deep brain stimulation in hemiparkinsonian rats. J. Neurochem. 2016;136:1004–16. - PubMed

Publication types

MeSH terms