. 2016 Nov;48(11):1303-1312.
doi: 10.1038/ng.3668. Epub 2016 Sep 26.

Discovery and refinement of genetic loci associated with cardiometabolic risk using dense imputation maps

Valentina Iotchkova  1   2 Jie Huang  2   3 John A Morris  4   5 Deepti Jain  6 Caterina Barbieri  2   7 Klaudia Walter  2 Josine L Min  8 Lu Chen  2   9 William Astle  10 Massimilian Cocca  11   12 Patrick Deelen  13   14 Heather Elding  2 Aliki-Eleni Farmaki  15 Christopher S Franklin  2 Mattias Franberg  16 Tom R Gaunt  8 Albert Hofman  17   18 Tao Jiang  10 Marcus E Kleber  19 Genevieve Lachance  20 Jian'an Luan  21 Giovanni Malerba  22 Angela Matchan  2 Daniel Mead  2 Yasin Memari  2 Ioanna Ntalla  23   15 Kalliope Panoutsopoulou  2 Raha Pazoki  17 John R B Perry  20   21 Fernando Rivadeneira  17   24 Maria Sabater-Lleal  16 Bengt Sennblad  16 So-Youn Shin  2   8 Lorraine Southam  2   25 Michela Traglia  7 Freerk van Dijk  13   14 Elisabeth M van Leeuwen  17 Gianluigi Zaza  26 Weihua Zhang  27 UK10K ConsortiumNajaf Amin  17 Adam Butterworth  10   28 John C Chambers  27 George Dedoussis  15 Abbas Dehghan  17 Oscar H Franco  17 Lude Franke  14 Mattia Frontini  29 Giovanni Gambaro  30 Paolo Gasparini  11   12   31 Anders Hamsten  16 Aaron Issacs  17 Jaspal S Kooner  32 Charles Kooperberg  33 Claudia Langenberg  21 Winfried Marz  34   35   36 Robert A Scott  21 Morris A Swertz  13   14   37 Daniela Toniolo  7 Andre G Uitterlinden  24 Cornelia M van Duijn  17 Hugh Watkins  38   25 Eleftheria Zeggini  2 Mathew T Maurano  39 Nicholas J Timpson  8 Alexander P Reiner #  40   33 Paul L Auer #  41 Nicole Soranzo #  2   9   28
Affiliations

Discovery and refinement of genetic loci associated with cardiometabolic risk using dense imputation maps

Valentina Iotchkova et al. Nat Genet. 2016 Nov.

Erratum in

  • Author Correction: Discovery and refinement of genetic loci associated with cardiometabolic risk using dense imputation maps.
    Iotchkova V, Huang J, Morris JA, Jain D, Barbieri C, Walter K, Min JL, Chen L, Astle W, Cocca M, Deelen P, Elding H, Farmaki AE, Franklin CS, Franberg M, Gaunt TR, Hofman A, Jiang T, Kleber ME, Lachance G, Luan J, Malerba G, Matchan A, Mead D, Memari Y, Ntalla I, Panoutsopoulou K, Pazoki R, Perry JRB, Rivadeneira F, Sabater-Lleal M, Sennblad B, Shin SY, Southam L, Traglia M, van Dijk F, van Leeuwen EM, Zaza G, Zhang W; UK10K Consortium; Amin N, Butterworth A, Chambers JC, Dedoussis G, Dehghan A, Franco OH, Franke L, Frontini M, Gambaro G, Gasparini P, Hamsten A, Isaacs A, Kooner JS, Kooperberg C, Langenberg C, Marz W, Scott RA, Swertz MA, Toniolo D, Uitterlinden AG, van Duijn CM, Watkins H, Zeggini E, Maurano MT, Timpson NJ, Reiner AP, Auer PL, Soranzo N. Iotchkova V, et al. Nat Genet. 2018 Dec;50(12):1752. doi: 10.1038/s41588-018-0276-8. Nat Genet. 2018. PMID: 30390057

Abstract

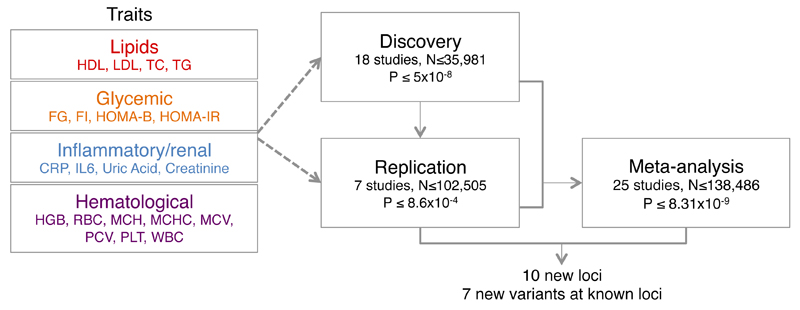
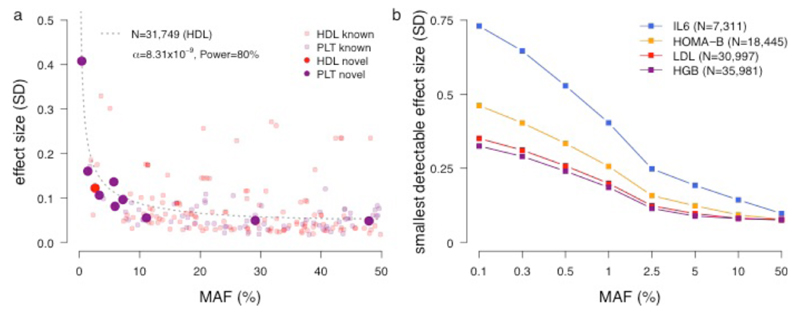
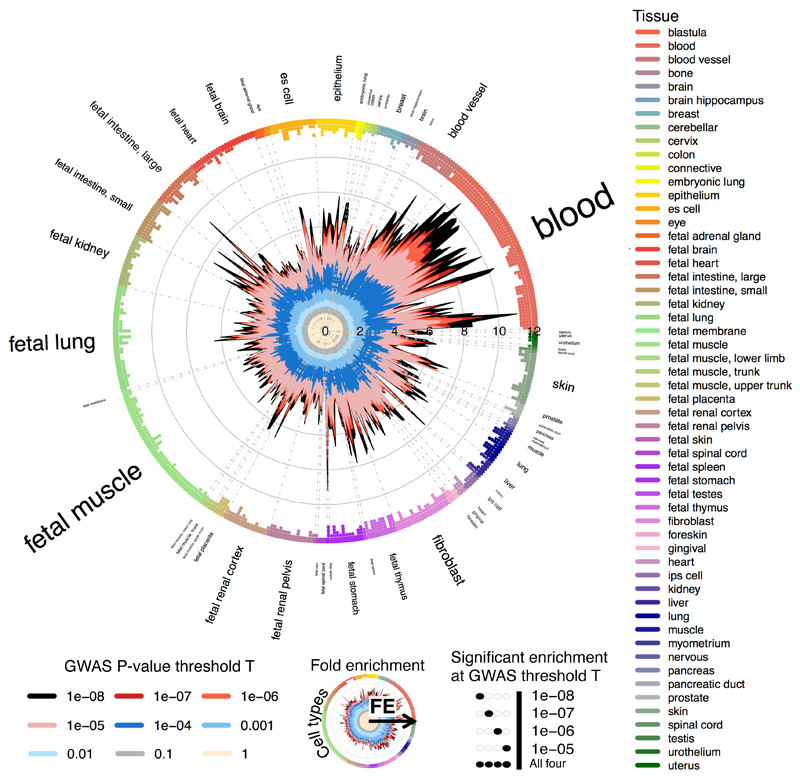
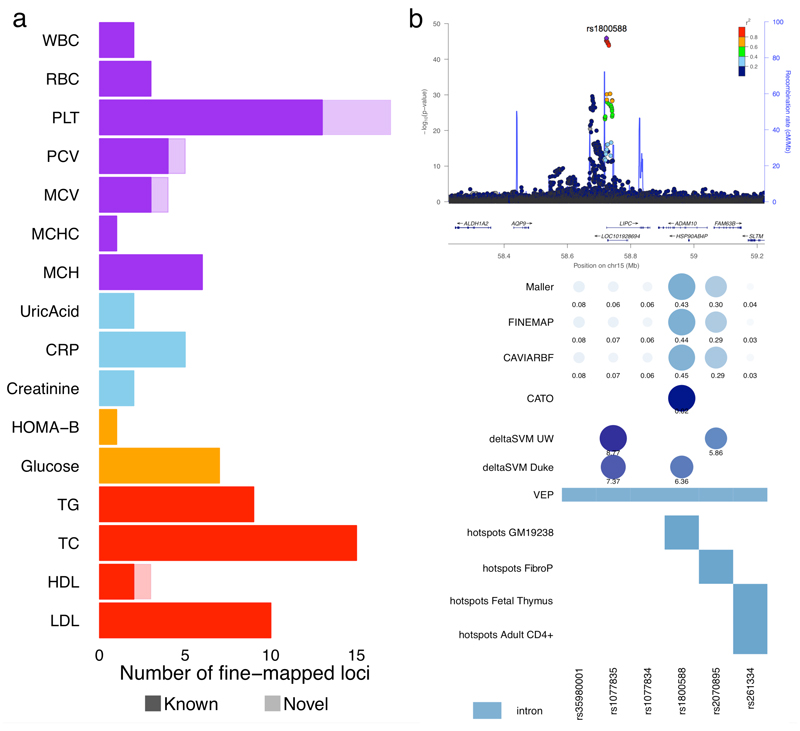
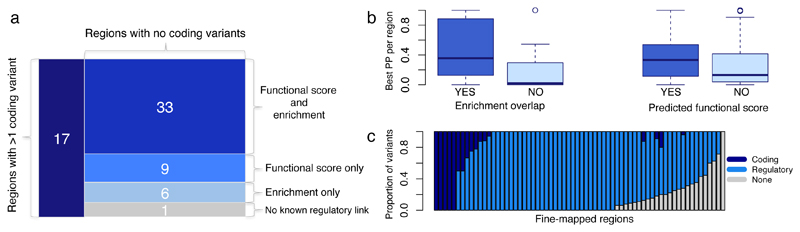
Large-scale whole-genome sequence data sets offer novel opportunities to identify genetic variation underlying human traits. Here we apply genotype imputation based on whole-genome sequence data from the UK10K and 1000 Genomes Project into 35,981 study participants of European ancestry, followed by association analysis with 20 quantitative cardiometabolic and hematological traits. We describe 17 new associations, including 6 rare (minor allele frequency (MAF) < 1%) or low-frequency (1% < MAF < 5%) variants with platelet count (PLT), red blood cell indices (MCH and MCV) and HDL cholesterol. Applying fine-mapping analysis to 233 known and new loci associated with the 20 traits, we resolve the associations of 59 loci to credible sets of 20 or fewer variants and describe trait enrichments within regions of predicted regulatory function. These findings improve understanding of the allelic architecture of risk factors for cardiometabolic and hematological diseases and provide additional functional insights with the identification of potentially novel biological targets.


Figures

Figure 1
Figure 1. Study design.
Summary of traits and studies investigated in this study. Study-specific information is given in Supplementary Table 1. HDL = high-density lipoprotein cholesterol; LDL = low-density lipoprotein cholesterol; TC = total cholesterol; TG = triglycerides; FG = fasting glucose; FI = fasting insulin; HOMA-B = homeostatic model assessment of β-cell function; HOMA-IR = homeostatic model assessment of insulin resistance; CRP = C-reactive protein; IL6 = interleukin-6; HGB = haemoglobin; RBC = red blood cell count; MCH = mean cell haemoglobin; MCHC = mean cell haemoglobin concentration; MCV = mean cell volume; PCV = packed cell volume or hematocrit; PLT = platelet count; WBC = white blood cell count.
Figure 2
Figure 2. Allelic spectrum of cardiometabolic trait variants.
(a) For each variant surpassing the genome-wide threshold in this study, the effect size (measured in standard deviations) is plotted as a function of the minor allele frequency proportion (MAF%). Loci discovered in this study are plotted with larger symbols. Associations for HDL (black) and PLT (purple) for which novel variants were discovered are shown. The dotted line represents the curve for 80% power with a sample size of 31,749 (for HDL) and an alpha of 8.31x10⁻⁹. The power line for PLT (sample size 31,555) is similar and therefore not shown here. (b) Plot of smallest detectable effect size for a range of MAF%. Power calculations were performed for 4 traits of different trait groups and with different sample sizes: IL6, HOMA-B, LDL, and HGB.
Figure 3
Figure 3. GARFIELD functional enrichment analyses.
Wheel plot displaying functional enrichment of associations with PLT within DHS hotspot regions in ENCODE and Roadmap studies. Radial axis shows the fold enrichment (FE) values calculated at each of eight GWAS P-value thresholds (T<10–1 to T<10–8) for each of 424 cell types. Cell types are sorted by tissue, represented on the outer circle with font size proportional to the number of cell types from that tissue. Boxes and circles next to the tissue labels are coloured with respect to tissue (right legend). FE values at the different thresholds T areplotted with different colours on the inner side of the circle (e.g. T<10–8 in black, bottom-left legend).Dots in the outer side of the circle denote significant enrichment (if present) for a given cell type at T<10–5 (outermost) to T<10–8 (innermost) (bottom-right legend). Results show overall well spread enrichment, with largest FE values obtained in blood, fetal spleen and fetal intestine tissues.
Figure 4
Figure 4. Fine mapping experiments.
Regional association plots for loci showing fine-mapped variants. (a) Numerical summary of 59 loci that were fine-mapped. (b) Example of fine-mapping and annotation at the LIPC locus for association with HDL. Panels show the regional association locuszoom plot, the PP statistics from the fine-mapping methods, the CATO and deltaSVM scores, VEP genic annotations and overlap of regulatory annotations found significant (coloured in blue) from GARFIELD enrichment analysis. Circles sizes and colours for all scores have been scaled with respect to score type (i.e. PP, CATO or deltaSVM) and numbers have been plotted below each circle.
Figure 5
Figure 5. Fine-mapping summary of variant consequences.
(a) Number of fine-mapped trait-region pairs containing at least one variant in the 95% credible set with consequences (i) coding; (ii) functional score and overlapping annotation significantly enriched for the given trait; (iii) functional score only; (iv) significant enrichment overlap only; (v) none of the above. (b) Distribution of the top posterior probability (PP) per region for variants with significant enrichment overlap and predicted functional score (after removing regions containing a coding variant). Boxplots depict the median (thick horizontal line), 1st and 3rd quartiles (coloured box), maximum and minimum values (whiskers) and outlying values (circles). (c) Proportions of variants within credible sets with coding, regulatory or no annotations.

References

    1. Cohen J, et al. Multiple rare alleles contribute to low plasma levels of HDL cholesterol. Science (New York, NY) 2004;305:869–872. - PubMed
    1. Johansen CT, et al. Excess of rare variants in genes identified by genome-wide association study of hypertriglyceridemia. Nat Genet. 2010;42:684–7. - PMC - PubMed
    1. Auer PL, et al. Rare and low-frequency coding variants in CXCR2 and other genes are associated with hematological traits. Nat Genet. 2014;46:629–34. - PMC - PubMed
    1. Willer CJ, et al. Discovery and refinement of loci associated with lipid levels. Nat Genet. 2013;45:1274–83. - PMC - PubMed
    1. Huyghe JR, et al. Exome array analysis identifies new loci and low-frequency variants influencing insulin processing and secretion. Nat Genet. 2013;45:197–201. - PMC - PubMed

Publication types