. 2016 Sep 26:5:e15392.
doi: 10.7554/eLife.15392.

A visual circuit uses complementary mechanisms to support transient and sustained pupil constriction

Affiliations

A visual circuit uses complementary mechanisms to support transient and sustained pupil constriction

William Thomas Keenan et al. Elife. .

Abstract

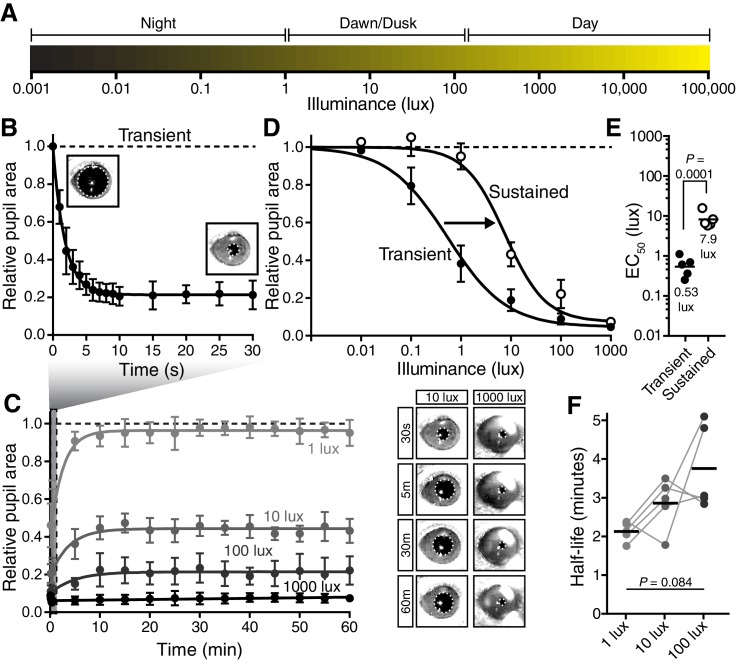
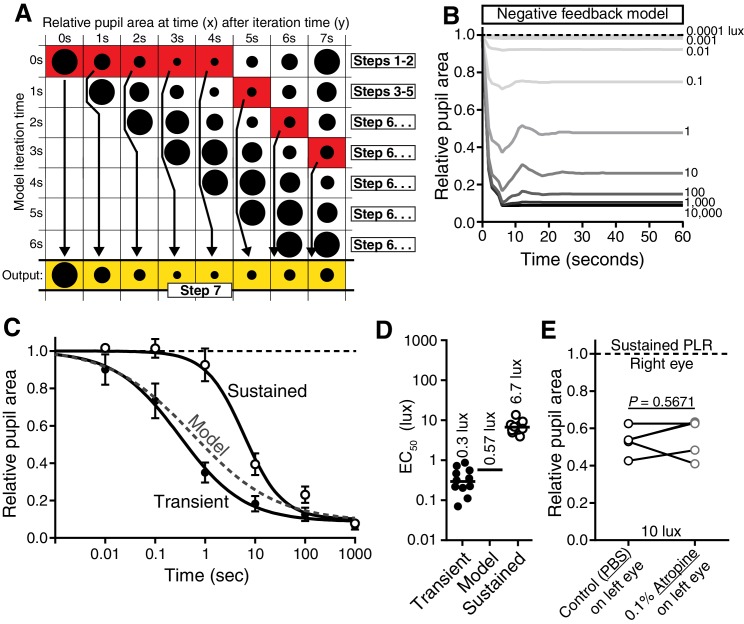
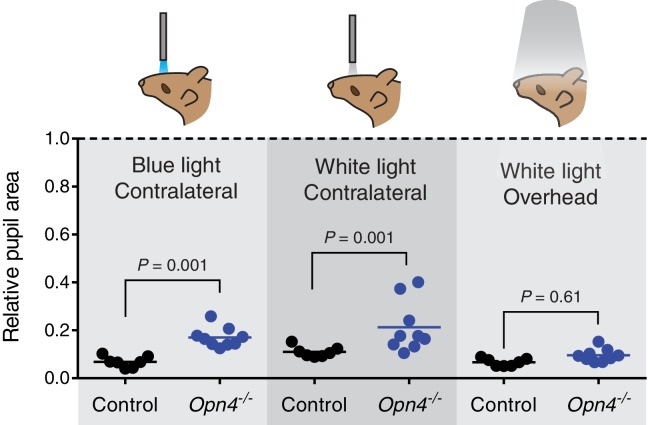
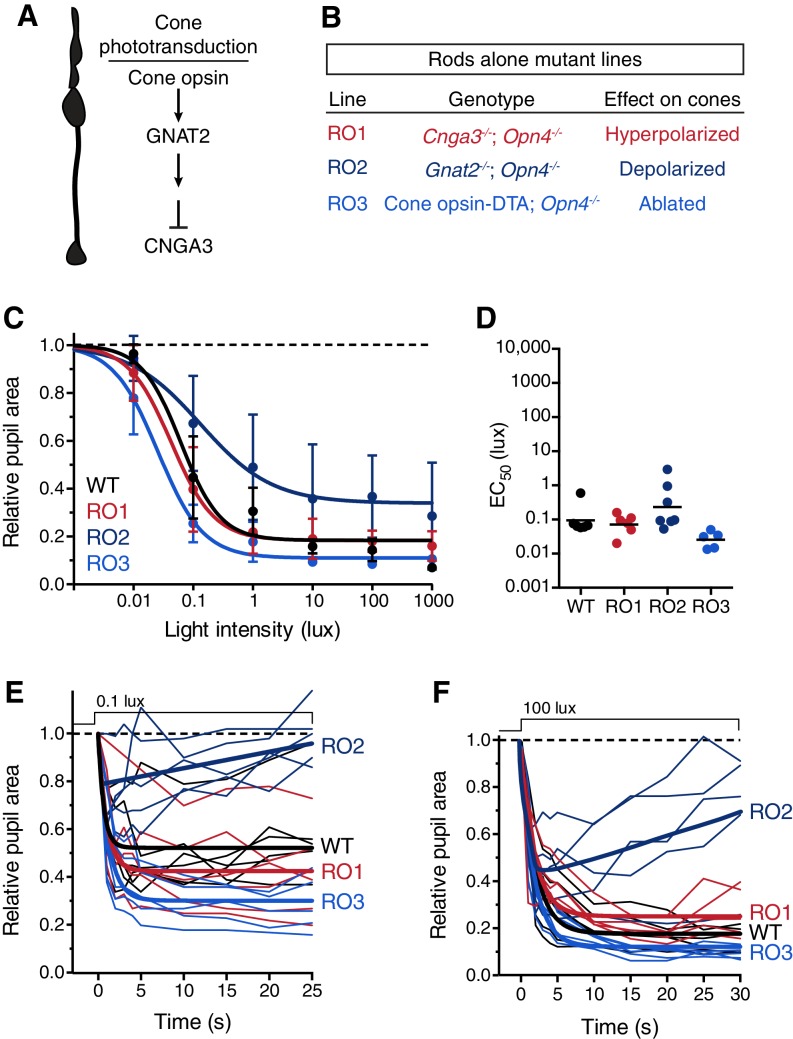
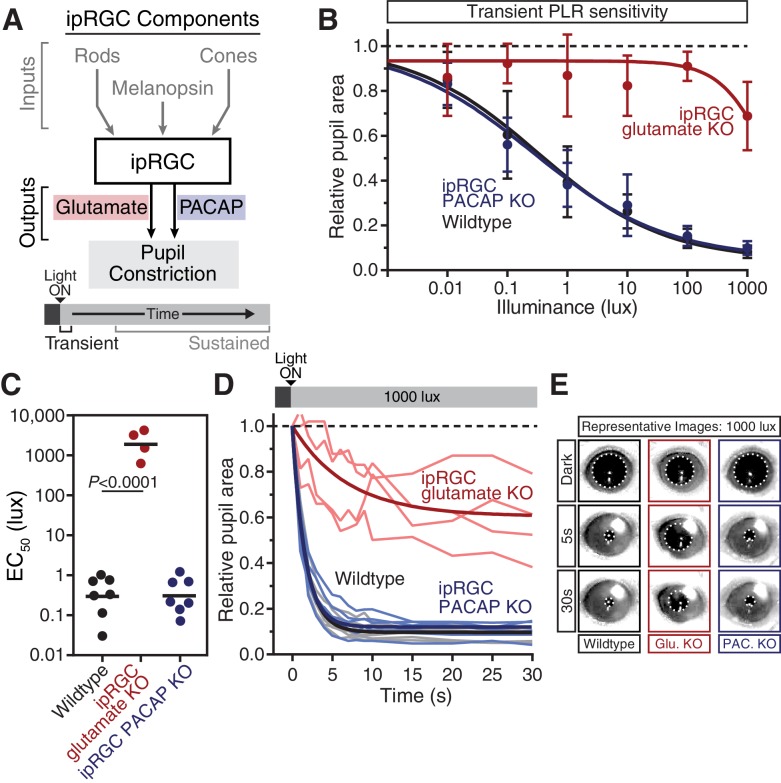
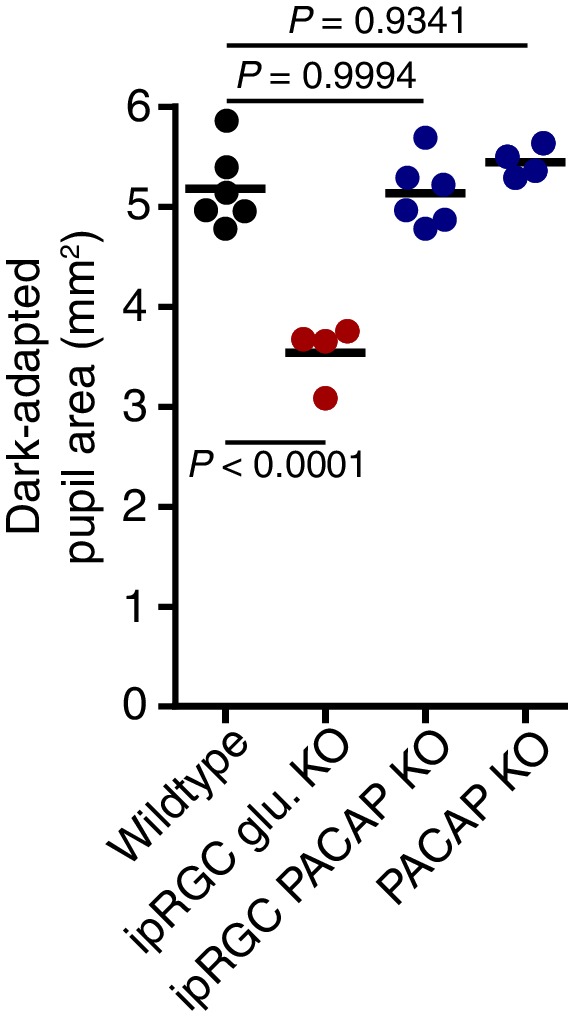
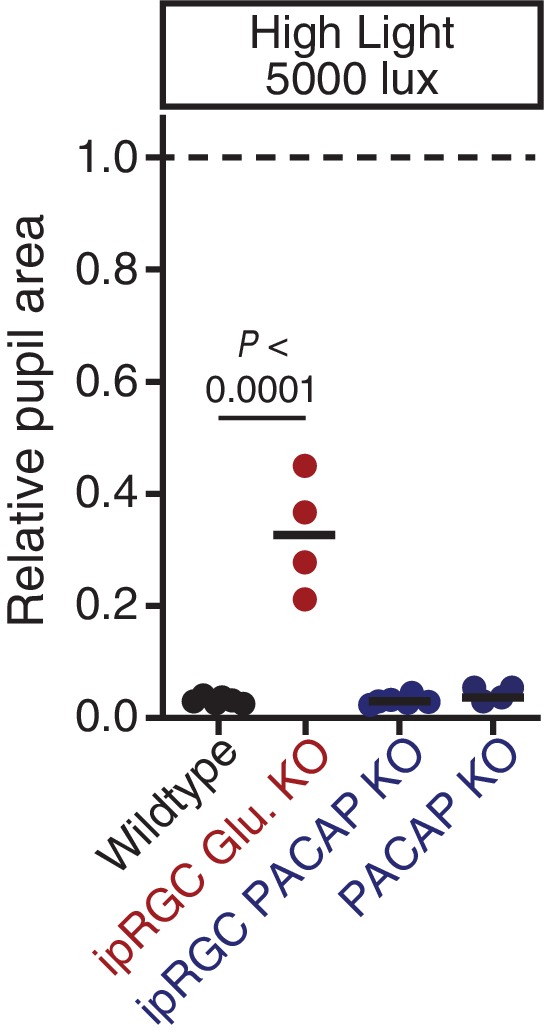
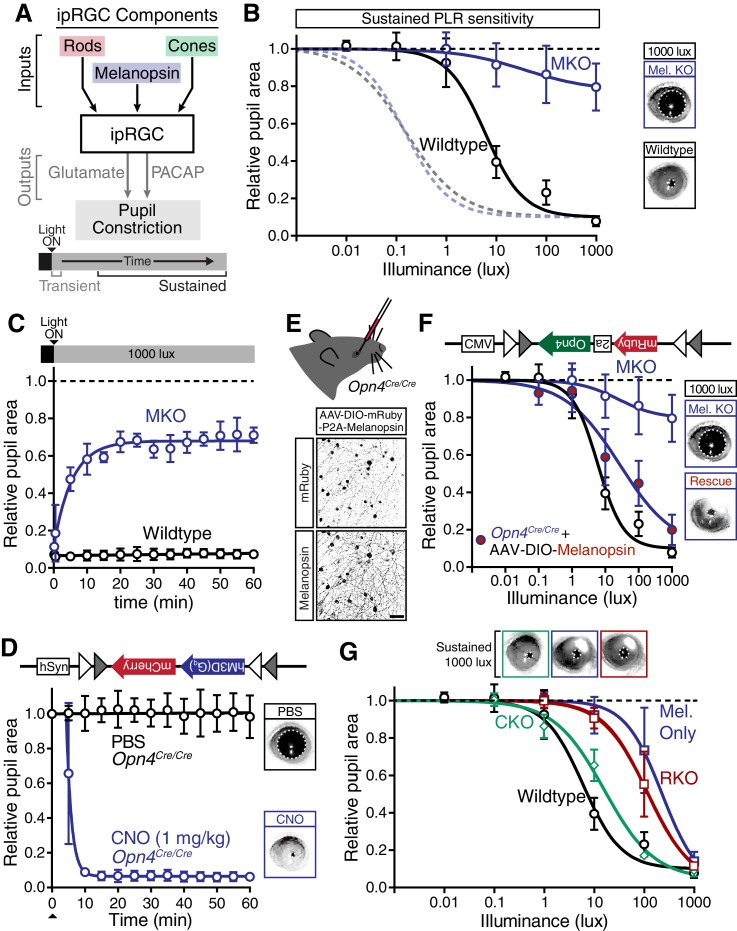
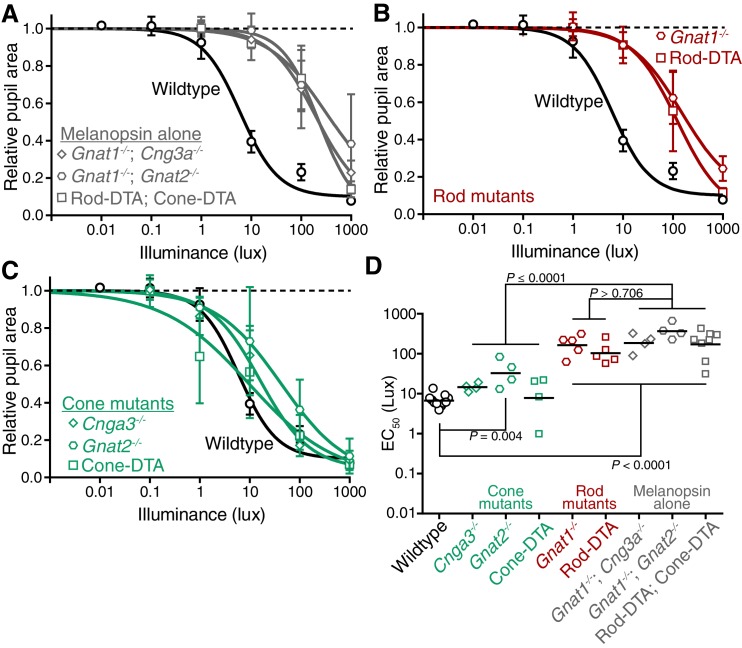
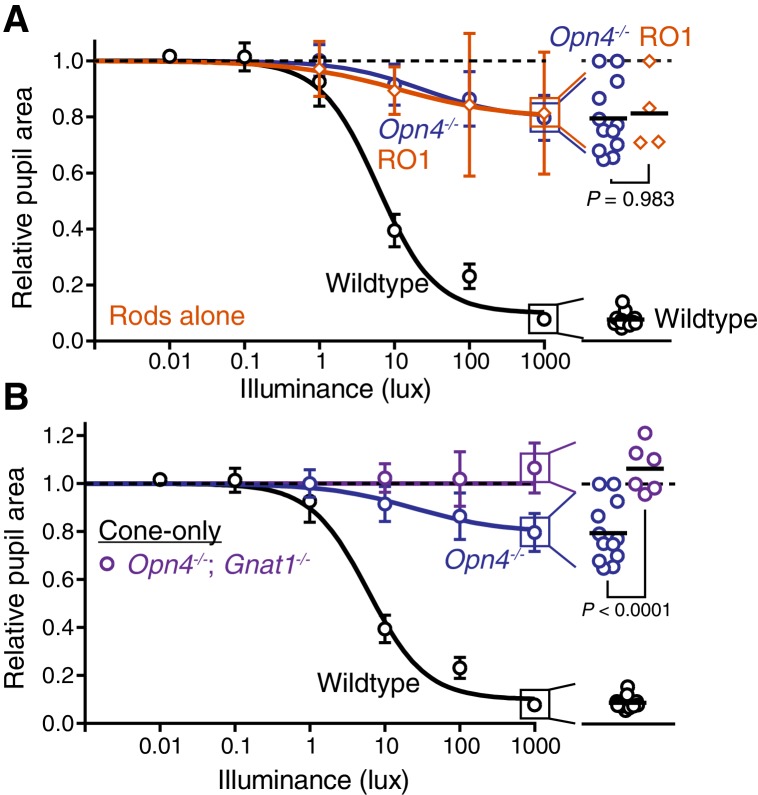
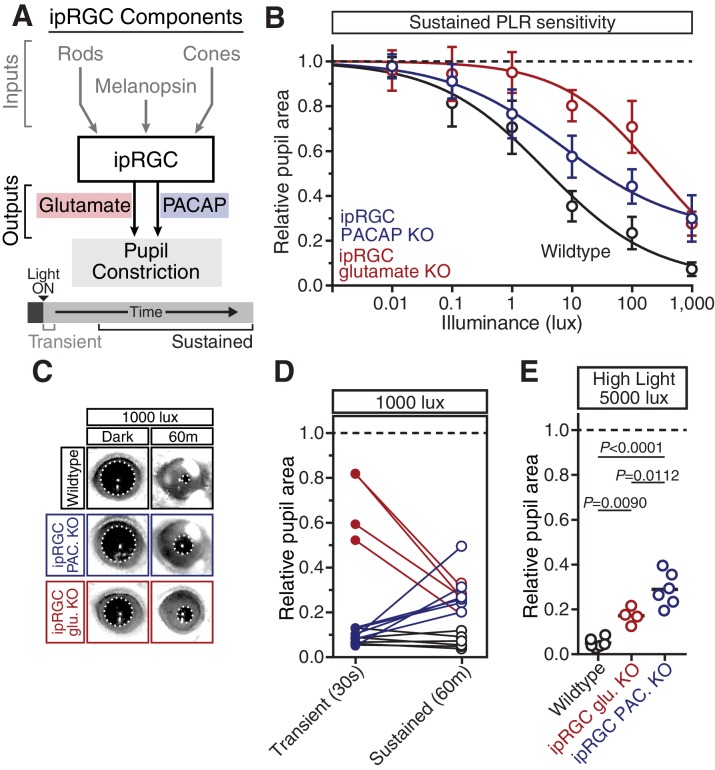
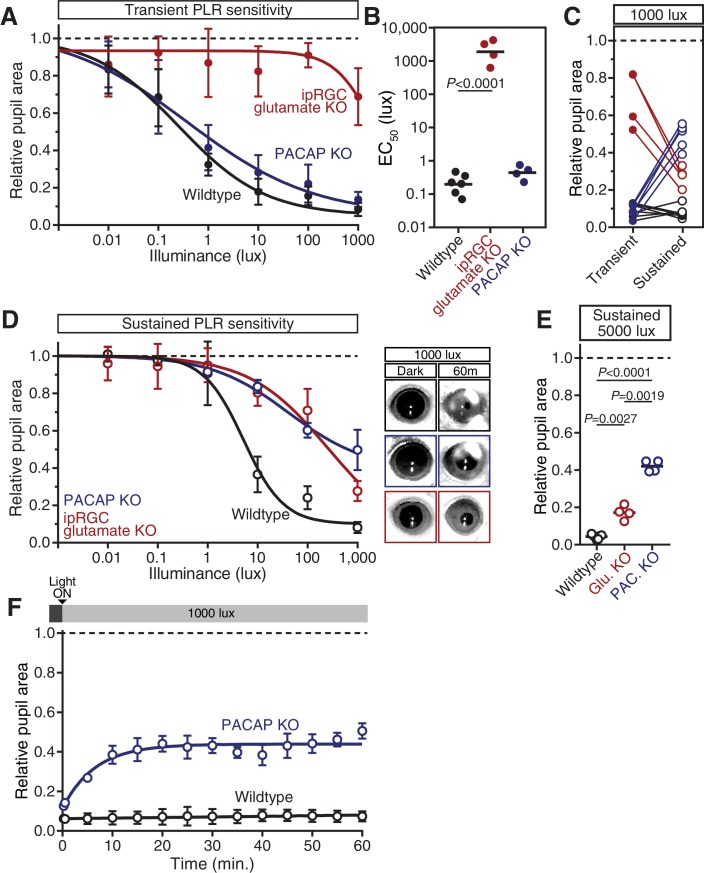
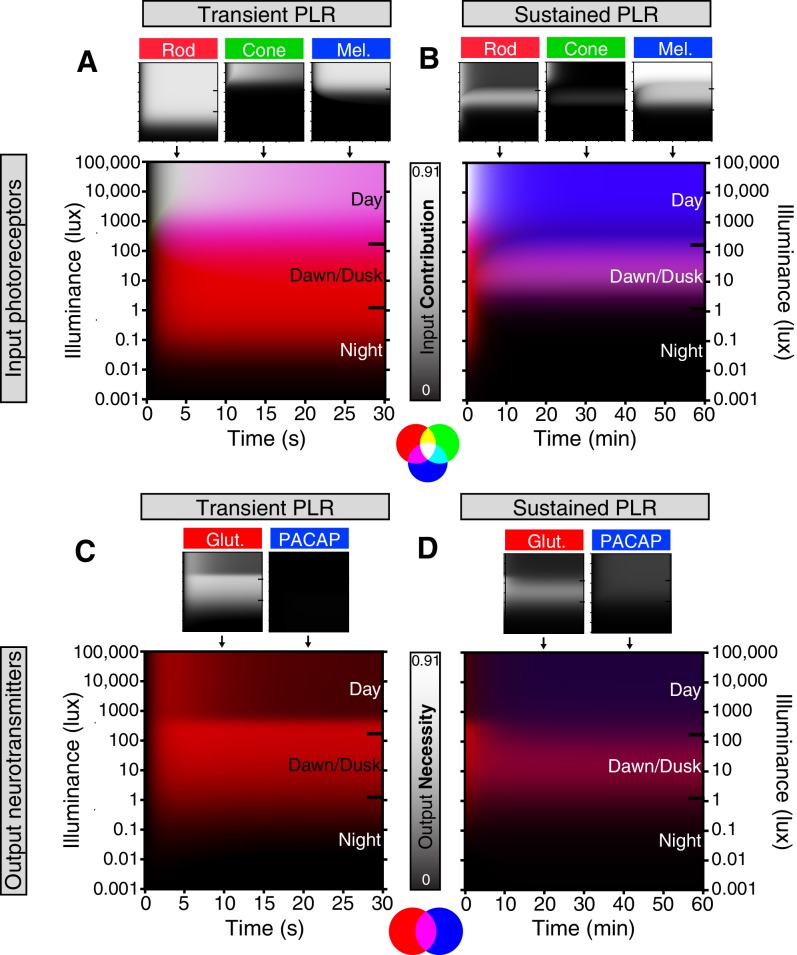
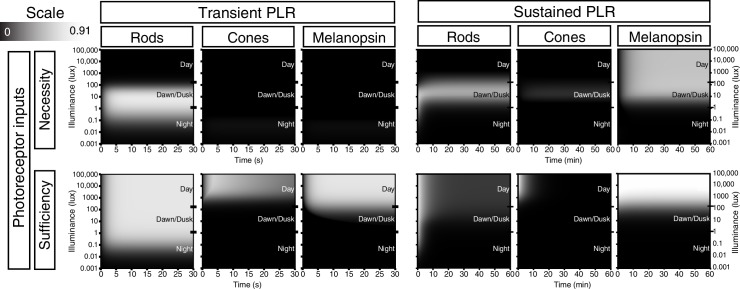
Rapid and stable control of pupil size in response to light is critical for vision, but the neural coding mechanisms remain unclear. Here, we investigated the neural basis of pupil control by monitoring pupil size across time while manipulating each photoreceptor input or neurotransmitter output of intrinsically photosensitive retinal ganglion cells (ipRGCs), a critical relay in the control of pupil size. We show that transient and sustained pupil responses are mediated by distinct photoreceptors and neurotransmitters. Transient responses utilize input from rod photoreceptors and output by the classical neurotransmitter glutamate, but adapt within minutes. In contrast, sustained responses are dominated by non-conventional signaling mechanisms: melanopsin phototransduction in ipRGCs and output by the neuropeptide PACAP, which provide stable pupil maintenance across the day. These results highlight a temporal switch in the coding mechanisms of a neural circuit to support proper behavioral dynamics.

Keywords: ipRGC; melanopsin; mouse; neuropeptides; neuroscience; neurotransmitters; retinal circuitry; vision.


Conflict of interest statement

The authors declare that no competing interests exist.

Figures

Figure 1.
Figure 1.. The pupillary light response contains two phases: transient and sustained.
(A) Approximate light intensity ranges (lux) at different times of day. (B) Transient constriction in response to a 10 lux overhead stimulus (mean ± SD). Boxes contain representative pupil images at time 0 and 30 s. (C) Continued monitoring of pupil constriction from b for 60 min of continuous light at 5 min intervals with representative images. (D) Intensity-response curve for transient and sustained constriction (30 s and 60 min, respectively). Data fit with a sigmoidal curve (n = 5, mean ± SD). (E) Light intensity required for half-maximal constriction (EC50) determined for both transient and sustained phases of the PLR. EC50 extracted from the sigmoidal curve fits for each mouse (points are individual mice, line is mean). Statistical significance determined with a student’s t test. (F) Half-life of PLR decay at 1, 10, and 100 lux. Statistical significance determined by main effect of light intensity from one-way ANOVA. See also Figure 1—figure supplement 1, Figure 1—figure supplement 2. DOI: http://dx.doi.org/10.7554/eLife.15392.003
Figure 1—figure supplement 1.
Figure 1—figure supplement 1.. Experimental setup and light stimulus details.
(A) Environmental light intensity measured in lux across one day (April 2, 2015) in Baltimore, Maryland, USA. The light meter used is unable to measure light intensities below 1 lux, indicated with the gray box. Dotted lines refer to the meteorological sunrise and sunset. Data is fit with a hand-drawn curve for ease of visualization. (B) Mice are unanesthetized and restrained by hand under a light bulb with a broad spectrum similar to sunlight (C). Spectral power is normalized to the most highly represented wavelength in sunlight. Breaking down the fraction of light into 50 nm bins for each light source, the daylight bulbs are very similar to sunlight across all wavelengths (D), while incandescent bulbs lack short wavelengths and are enriched in long wavelengths. Pupils are continuously recorded in darkness and light using an infrared video camera. DOI: http://dx.doi.org/10.7554/eLife.15392.004
Figure 1—figure supplement 2.
Figure 1—figure supplement 2.. Negative-feedback model of PLR decay.
(A) Diagram displaying how the negative feedback model works (7 s light in example) (See Online Methods for step-by-step explanation). The model assumes that packets of light information are discrete and are relayed to the PLR circuit to result in pupil constriction at later timepoints. We determined the kinetics of light information relay using a 1-s light pulse-chase. Then, we simply modulate the relative light intensity reaching the retina based on assuming continuous 1-s packets of information. At each new 1-s interval, the model samples the assumed pupil sizes currently driven by each previous packet of light information, uses the maximum value as the current pupil size, and then reduces the stimulus intensity using that pupil size. We then use this new intensity to determine constriction caused at that time. This iterates every second. (B) Putative kinetics of feedback’s impact on PLR at several light intensities (0.0001, 0.001, 0.01, 0.1, 1, 10, 100, 1000, and 10,000 lux). (C) Magnitude of PLR decay caused by feedback as modeled with (D) EC50. Note that our model predicts minor PLR decay as a result of PLR feedback. (E) Experimental investigation of feedback’s role in PLR decay. Atropine was applied to the left eye to inhibit pupil constriction and thus feedback. No enhancement of sustained PLR of the right eye was observed (paired two-tailed t-test). DOI: http://dx.doi.org/10.7554/eLife.15392.005
Figure 2.
Figure 2.. Transient input to ipRGCs is mediated by rods.
(A) Diagram of ipRGC behavioral circuit. (B) Intensity-response curves of the PLR in each of the photoreceptor mutant mouse lines (mean ± SD): wildtype (n = 6), Rod KO (Gnat1-/- n = 6), Melanopsin KO (Opn4-/- n = 8), and Cone KO (Gnat2-/- n = 7). Representative pupil images for each mouse line at 10 lux. (C) Gene schematic comparison of endogenous mouse M-cone allele and human red cone knock-in allele as well as the spectral sensitivity shift observed. Notice that cones are more sensitive to red light in Red cone KI line. (D) The PLR to red light (626-nm LED) is identical in mice with cones that are more sensitive to red light (Red cone KI, n = 6) compared to littermate WT (n = 5), mean ± SD. (E) Removing rod function abolishes the PLR in response to red light (626-nm LED), even in mice with cones with enhanced sensitivity to red light. WT n = 7, Red cone KI (Opn1mwred) n = 8, Rod KO (Gnat1-/-)- n = 8, Red cone KI; Rod KO (Gnat1-/-; Opn1mwred) n = 4. Light intensity is 14.3 log photons/cm2/s. (F) Intensity-response curves in mutant mice with each photoreceptor isolated (Rod-only: Cnga3-/-; Opn4-/- n = 6)(Cone-only: (Gnat1-/-; Opn4-/- n = 6)(Mel.-only: Gnat1-/-; Gnat2-/- n = 7) Data is mean ± SD, statistical significance determined using a one-way ANOVA with Sidak’s post-test. (right) Representative pupil images at 100 lux. (G) Kinetics of transient pupil constriction (100 lux) in mice with only rod, cone, or melanopsin function, same genotypes and number of animals as in F. Traces of individual mice are shown behind curve-fits. One-phase decays were fit to all except cone-only which was fit with a two-phase decay due to its rapid pupil decay within 30 s. Melanopsin-only kinetic fit was offset from 0 by 3 s to account for delay in constriction. See also Figure 2—figure supplements 1–5. DOI: http://dx.doi.org/10.7554/eLife.15392.006
Figure 2—figure supplement 1.
Figure 2—figure supplement 1.. Dark-adapted pupil sizes of photoreceptor mutant mouse lines used.
Dark-adapted pupil sizes of all mouse lines used for photoreceptor investigation. Pupil size was recorded before light onset and pupil area (mm2) is reported. No statistical difference was found for any genotype compared to wildtype (p>0.05 for all comparisons). Statistical significance was determined by one-way ANOVA followed by Sidak’s post-test. DOI: http://dx.doi.org/10.7554/eLife.15392.007
Figure 2—figure supplement 2.
Figure 2—figure supplement 2.. Rods are required for the transient phase of the PLR.
(A) Diagram of the retina labeling the photoreceptors. For experiments in BD, WT n = 14, Opn4-/- n = 8, Cnga3-/- n = 4, Gnat2-/- n = 7, Cone-DTA n = 7, Gnat1-/- n = 6, Rod-DTA n = 9. (B) Kinetics of rapid constriction in response to dim light (10 lux). Rod KO mice are the only photoreceptor mutants to display a deficit. Cone and Mel. KO mice are identical to wildtype. (C) Intensity-response curves of the PLR in each of the photoreceptor mutant mouse lines (mean ± SD). The bar on top of the figure denotes the estimated sensitivities of rods and cones. (D) Rod mutant animals are the only mutants that display a sensitivity (EC50) deficit compared to WT (p<0.0001). In fact, Cone-DTA mice are moderately more sensitive than WT (*p=0.011). Points indicate individual mice, line indicates mean. Statistical significance determined using a one-way ANOVA with Sidak’s post-test. DOI: http://dx.doi.org/10.7554/eLife.15392.008
Figure 2—figure supplement 3.
Figure 2—figure supplement 3.. Melanopsin is not required for transient PLR in response to environmentally relevant overhead light.
Transient PLR determined under 3 different experimental light conditions. (Left) Blue (474-nm) LED light presented to contralateral eye (1.9 × 1016 photons/cm2/s). (Middle) White halogen light presented to contralateral eye (27.58 W/m2). (Right) 1000 lux white compact fluorescent light presented overhead to both eyes (4.4 W/m2). Line represents mean and points are individual mice. Statistical significance determined by one-way ANOVA followed by Sidak’s post-test. No difference observed when light presented overhead. Control (Opn4+/-) n = 7 and Opn4-/- n = 9. DOI: http://dx.doi.org/10.7554/eLife.15392.009
Figure 2—figure supplement 4.
Figure 2—figure supplement 4.. Rod input to the transient PLR is influenced by cones.
(A) Cartoon representation of a cone and a diagram of its phototransduction cascade. Different aspects of this cascade are disrupted in the various ‘rod-only’ lines we use. (B) Multiple mouse lines with rods as the only functional photoreceptors. For the experiments in C and D: WT n = 6, Rod-only type 1 (RO1: Cnga3-/-; Opn4-/-) n = 6, Rod-only type 2 (RO2: Gnat2-/-; Opn4-/-) n = 8, Rod-only type 3 (RO3: Cone-DTA; Opn4-/-) n = 5. (C) Intensity-response curve of the PLR in all of the rod-only lines, which are all similar to wild-type at all light intensities (mean ± SD). At 1000 lux, only RO2s are statistically different from wildtype (p=0.006 by one-way ANOVA with Sidak‘s post-test). (D) Sensitivity (EC50) in each of the mutant lines. No statistical differences were observed between the mouse lines (compared to WT, RO1 p=0.956, RO2 p=0.340, RO3 p=0.141 using a one-way ANOVA with Sidak’s post-test), although the RO2 line had more variability and trended toward lower sensitivity. (E and F) Kinetic comparison of rod-only lines at dim (E) and bright (F) light intensities. RO1 and RO3 lines are identical to wildtype under both light intensities, however, RO2 mice display PLR decay within 30s. All statistics are one-way ANOVA with Sidak’s post-test, line indicates mean. DOI: http://dx.doi.org/10.7554/eLife.15392.010
Figure 2—figure supplement 5.
Figure 2—figure supplement 5.. Melanopsin can drive rapid constriction at high light intensities.
Multiple mouse lines with ipRGCs as the only functional photoreceptors (melanopsin-only) or a mouse line with cones as the only functional photoreceptors (cone-only) were tested. For the experiments in A and B: WT n = 9, Gnat1-/-n = 10, Melanopsin-only type 1 (MO1: Gnat1-/-; Cnga3-/-) n = 7, Melanopsin-only type 2 (MO2: Gnat1-/-; Gnat2-/-) n = 9, Melanopsin-only type 3 (MO3: Rod-DTA; Cone-DTA) n = 6, Cone-only (Gnat1-/-; Opn4-/-) n = 6. (A) Intensity-response curve of the PLR in all of the melanopsin-only lines and in the cone-only mouse line (mean ± SD). (B) EC50 in each of the lines. All mutant lines are less sensitive than WT (p<0.0001) by >2 log units. Cone-only mice are additionally less sensitive than Rod KO mice (p<0.0001), but no melanopsin-only line is significantly different from Rod KO (Compared to RKO: MO1 p=0.201, MO2 p=0.625, MO3 p=0.591). All statistics are one-way ANOVA with Sidak’s post-test, line indicates mean. DOI: http://dx.doi.org/10.7554/eLife.15392.011
Figure 3.
Figure 3.. Glutamaterigic output provides precise and rapid transient signaling.
(A) Diagram of ipRGC behavioral circuit. (B) Intensity-response curves of the PLR in each of the neurotransmitter mutant mouse lines (Wildtype n = 6) (ipRGC glu. KO: Opn4Cre/+ ; Slc17a6fl/fl n = 4) (ipRGC PACAP KO: Opn4Cre/+ ;Adcyap1fl/- n = 6)(mean ± SD). (C) Sensitivity (EC50) in each of the mutant lines. Statistical significance determined by one-way ANOVA with Sidak’s post-test. (D) Kinetics of transient pupil constriction (1000 lux) in mice lacking glutamatergic or PACAPergic neurotransmission. Traces of individual mice are shown behind one-phase decay curve-fits. Half-lives: Wildtype (1.1 s), ipRGC glu. KO (4.8 s), ipRGC PACAP KO (1.1 s). (E) Representative pupil images at 5 s and 30 s post-illumination (1000 lux). Figure 3—figure supplements 1–3. DOI: http://dx.doi.org/10.7554/eLife.15392.013
Figure 3—figure supplement 1.
Figure 3—figure supplement 1.. Dark-adapted pupil sizes of neurotransmitter mutant lines used.
Dark-adapted pupil sizes of all mouse lines used for neurotransmitter investigation. Pupil size was recorded before light onset and pupil area (mm2) is reported. ipRGC glutamate KO mice are the only line used which display a significant difference in dark-adapted pupil size suggesting that glutamatergic signaling is important for setting pupil size in darkness (p=0.0001). Statistical significance was determined by one-way ANOVA followed by Sidak’s post-test. DOI: http://dx.doi.org/10.7554/eLife.15392.014
Figure 3—figure supplement 2.
Figure 3—figure supplement 2.. Description of conditional PACAP allele.
Schematic of the conditional PACAP allele (Adcyap1lox). Boxes indicate exons (1–5). Grey indicates UTR while black indicates protein coding sequence. A single FRT site remains after removal of selection cassette. LoxP sites flank exon 2. Cre-mediated excision results in a frameshift and production of a truncated protein. See Materials and methods for further information of allele generation and confirmation. A more detailed description of the generation and use of the allele will appear in a manuscript that is in preparation (Ross and Lowell, unpublished). DOI: http://dx.doi.org/10.7554/eLife.15392.015
Figure 3—figure supplement 3.
Figure 3—figure supplement 3.. PACAP can drive significant constriction within 30s of high light onset.
Transient constriction was monitored in neurotransmitter mutant mice under high light (5000 lux). Data from each mouse is shown with the mean (black bar). ipRGC glutamate KO mice (Opn4Cre/+ ; Slc17a6fl/fl: n = 4) display a significant reduction in transient phase pupil constriction compared to wildtype (n = 6)(p<0.0001) while ipRGC PACAP KO (Opn4Cre/+;Adcyap1fl/-: n = 6) and PACAP KO (n = 4) mice are indistinguishable from wildtype (p>0.999). Statistical signficance determined via one-way ANOVA followed by Sidak’s post-test. DOI: http://dx.doi.org/10.7554/eLife.15392.016
Figure 4.
Figure 4.. Melanopsin/rod synergy supports PLR under persistent conditions.
(A) Diagram of ipRGC behavioral circuit. (B) Intensity-response curves for wildtype and melanopsin knockout mice (Opn4-/-): transient (dotted lines for reference) and sustained (60 min: solid lines) (WT n = 6, Opn4-/- n = 12). (right) Representative pupil images under 1000 lux persistent light. (C) 60-min time course of pupil constriction under constant light (1000 lux). Data fit with a one-phase association curve (WT n = 5, Opn4-/- n = 7). (D) Sustained pupil constriction monitored every 5 min for 1 hr in melanopsin knockout mice (Opn4Cre/Cre) expressing the Gq-coupled DREADD (hM3D) specifically in ipRGCs (AAV2-hSyn-DIO-hM3D(Gq)-mCherry). CNO injection IP (blue) caused robust constriction within 5–10 min that was sustained for 60 min, whereas PBS injection (black) did not. CNO data is fit with a one-phase association curve and PBS data is fit with a linear regression (n = 6, mean ± SD). (E) (top) Diagram showing viral eye injection in only one eye. (bottom) Confocal microscope images of an Opn4Cre/Creretina injected with AAV2-CMV-DIO-mRuby-P2A-Melanopsin-FLAG showing infection and expression (mRuby, top; anti-OPN4, bottom). Scale bar = 50 µm. (F) Successful rescue of pupil constriction by virally restored melanopsin expression in a single eye of adult mice (WT n = 6, Mel. KO n = 12, Mel.-Rescue n = 4). (right) Representative pupil images of Mel. KO and Mel.-Rescue mice at 1000 lux. (G) PLR intensity-response curves of Wildtype (n = 6), Mel.-only (Rod-DTA; Cone-DTA n = 8), Cone KO (Cnga3-/-n = 4), and Rod KO (Rod-DTA n = 5) mice (mean ± SD). Melanopsin is sufficient at high light (≥1000 lux), however, rods are required at lower light intensities. Cone KO mice are similar to wildtype. (top) Representative pupil images at 1000 lux. See also Figure 4—figure supplement 1–4. DOI: http://dx.doi.org/10.7554/eLife.15392.018
Figure 4—figure supplement 1.
Figure 4—figure supplement 1.. Melanopsin is required for sustained constriction across the day.
(A) Sustained constriction at 10,000 lux (WT n = 6, only 1 is plotted due to inability to see extremely small pupils in very bright light, Mel. KO n = 6). (B) Time course of pupil constriction under 12 hr of constant light corresponding to circadian day (room lighting = 350 lux) using wildtype (n = 3) and melanopsin knockout mice (n = 4) (line is smoothed mean). DOI: http://dx.doi.org/10.7554/eLife.15392.019
Figure 4—figure supplement 2.
Figure 4—figure supplement 2.. Viral infection and expression is specific to ipRGCs.
(A) Schematic of the method to activate exclusively ipRGCs using an exogenous GPCR (hM3D(Gq)) and its ligand (CNO). (B) Confocal microscope image showing infection of ipRGCs observed by mCherry expression following administration of a Cre-dependent AAV injected into the vitreous of melanopsin-Cre knockout mice (Opn4Cre/Cre). (C–E) Confirmation of ipRGC-specific expression of melanopsin from AAV-DIO-mRuby-P2A-Melanopsin-FLAG viral injections. Opn4Cre/+ mice were used to colocalize viral (C) mRuby with (D) endogenous and exogenous melanopsin expression. (E) We observe specific expression of mRuby in a significant portion of ipRGCs, although some ipRGCs lack mRuby staining, presumably due to lack of infectivity (arrows show mRuby-negative ipRGCs). Scale bars = 50 μm. (F) Quantification of fraction of ipRGCs (melanopsin-antibody) which are mRuby-positive. Quantification shown for three mice (A single 20x field was quantified for each mouse). Approximately 90% of melanopsin-positive cells express mRuby. DOI: http://dx.doi.org/10.7554/eLife.15392.020
Figure 4—figure supplement 3.
Figure 4—figure supplement 3.. Rods, but not cones, contribute to sustained PLR sensitivity.
(A) PLR intensity-response curves of wildtype and mice with only melanopsin phototransduction intact (‘melanopsin-only’: Gnat1-/-; Gnat2-/- n = 4, Gnat1-/-; Cnga3-/- n = 4, Rod-DTA; Cone-DTA n = 8) (mean ± SD). (B) Sustained PLR intensity-response curves of wildtype (n = 11) and rod mutant mice (Gnat1-/- n = 5, Rod-DTA n = 5) (mean ± SD). (C) Sustained PLR intensity-responses of wildtype and cone mutant mice (‘cone mutants’: Gnat2-/- (n = 4), Cnga3-/-(n = 4), Cone-DTA (n = 4)). (D) Sustained EC50 for wildtype and cone mutant, rod mutant and melanopsin-only mice (line = mean). All rod mutant and melanopsin-only mouse lines display significnt loss of sensitivity (p<0.0001). Two of three cone mutant mouse lines were not significantly different from wildtype (Cnga3-/-p=0.57, Cone-DTA p>0.999), though Gnat2-/- displayed a 0.69 log-unit decrease in sustained PLR EC50 (Gnat2-/-P = 0.004). Additionally, all rod mutant lines were similar to their corresponding melanopsin-only line (p>0.706) while all cone mutant lines were significantly more sensitive than their corresponding melanopsin-only line (p≤0.0001). Statistical significance determined via one-way ANOVA with Sidak’s post-test. DOI: http://dx.doi.org/10.7554/eLife.15392.021
Figure 4—figure supplement 4.
Figure 4—figure supplement 4.. Rods drive the residual sustained pupil constriction observed in the absence of melanopsin.
(A) Sustained PLR dose-responses for wildtype (n = 11), melanopsin knockout (Opn4-/-, n = 12) and mice with only rod phototransduction intact (‘rod-only’: Cnga3-/-; Opn4-/- n = 4) (mean ± SD). (right) Scatter plot of 1000 lux sustained PLR. Melanopsin knockout and ‘rod-only’ mice not statistically different by one-way ANOVA with Sidak’s post-test (p=0.983) (line indicates mean). (B) Sustained PLR intensity-responses for wildtype (n = 11), melanopsin knockout (Opn4-/- n = 12) and mice with only cone phototransduction intact (‘cone-only’: Opn4-/-; Gnat1-/-, n = 6, mean ± SD). (right) Scatter plot of 1000 lux sustained PLR. Melanopsin knockout and ‘cone-only’ mice are statistically different by one-way ANOVA followed by Sidak’s post-test. DOI: http://dx.doi.org/10.7554/eLife.15392.022
Figure 5.
Figure 5.. PACAP is essential for the sustained PLR.
(A) Diagram of ipRGC behavioral circuit. (B) PLR intensity-response curves of sustained constriction in mice lacking glutamatergic or PACAPergic neurotransmission (WT n = 6, ipRGC glu. KO n = 4, ipRGC PACAP KO n = 6)(mean ± SD). Both mutants display deficits at 10, 100, and 1000 lux as compared to wildtype (wildtype v. ipRGC Glu. KO: 10 and 100 lux p<0.0001, 1000 lux p=0.0004 by two-way ANOVA with Sidak’s post-test)(wildtype v. ipRGC PACAP KO: 10, 100, and 1000 lux p<0.0001 by two-way ANOVA with Sidak’s post-test). (C) Representative pupil images of sustained constriction at 1000 lux. (D) Comparison of transient and sustained constriction under high light (1000 lux). ipRGC glu. KO mice (red) show an increase in pupil constriction with time whereas ipRGC PACAP KOs (blue) display a significant loss of constriction over time (ipRGC glu. KO transient v. sustained p<0.0001, ipRGC PACAP KO transient v. sustained p=0.0003, wildtype transient v. sustained p=0.9921 by one-way ANOVA with Sidak’s post-test). (E) Pupil constriction of neurotransmitter mutant mice after sustained 5000 lux light. Data from individual mice shown with mean (black bar). Statistical significance determined by one-way ANOVA with Sidak’s post-test. See also Figure 5—figure supplement 1. DOI: http://dx.doi.org/10.7554/eLife.15392.023
Figure 5—figure supplement 1.
Figure 5—figure supplement 1.. PACAP KO mice display similar PLR phenotypes to ipRGC-specific PACAP KO mice.
(A) Intensity-response curves of the transient PLR (30s light) in each of the neurotransmitter mutant mouse lines (Wildtype n = 6)(ipRGC glu. KO: Opn4Cre/+ ; Slc17a6fl/fl n = 4)(PACAP KO: Adcyap1-/- n = 4)(mean ± SD). (B) Sensitivity (EC50) in each of the mutant lines. Statistical significance determined by one-way ANOVA with Sidak’s post-test. (C) Comparison of transient and sustained (60 min. light) constriction under high light (1000 lux). ipRGC glu. KO mice (red) show an increase in pupil constriction with time whereas PACAP KOs (blue) display a significant loss of constriction over time. (D) PLR intensity-response curves of sustained constriction in mice lacking glutamatergic or PACAPergic neurotransmission (WT n = 6, ipRGC glu. KO n = 4, PACAP KO n = 4)(mean ± SD). Both mutants display similar deficits until 1000 lux where PACAP KO mice show a further deficit (PACAP KO v. ipRGC Glu. KO: p=0.0019 by one-way ANOVA with Sidak’s post-test). (right) Representative pupil images of sustained constriction at 1000 lux. (E) Pupil constriction of neurotransmitter mutant mice after sustained 5000 lux light. Data from individual mice shown with mean (black bar). Statistical significance determined by one-way ANOVA with Sidak’s post-test. (F) 60-min. time course of pupil constriction under constant light (1000 lux). Data fit with a one-phase association curve (WT n = 5, PACAP KO n = 4). (mean ± SD). DOI: http://dx.doi.org/10.7554/eLife.15392.024
Figure 6.
Figure 6.. Model of ipRGC circuit transitions.
(A and B) Heat maps of (A) transient and (B) sustained PLR as duration and intensity vary. Night, dawn/dusk, and daytime light intensities indicated by ticks on right side of plot. (top) Heat maps of individual photoreceptor contributions (grayscale). Black represents no contribution and degree of white represents increasing contribution. Each photoreceptor contribution heat map is a combination of necessity (individual photoreceptor transduction knockouts) and sufficiency (‘photoreceptor-only’) heat maps (for example: Input Contributionrod = Max(Necessityrod, Sufficiencyrod)). (middle) Rod (red), cone (green), melanopsin (blue) contributions are combined into a single heat map. (bottom) Color combination guide for reference when viewing heat map. (C and D) Same as above for neurotransmitter contributions to transient (C) and sustained (D) ipRGC signaling. Glutamatergic contribution is in green and PACAPergic contribution is in blue. See the Materials and methods section for details on heat map generation. Note that the axes are the same for the individual and combined heatmaps. See also Figure 6—figure supplement 1. DOI: http://dx.doi.org/10.7554/eLife.15392.026
Figure 6—figure supplement 1.
Figure 6—figure supplement 1.. Necessity/Sufficiency heat maps for photoreceptor input to pupil constriction.
Heat maps of necessity and sufficiency of each input (top: rods, cones, melanopsin) as stimulus duration and intensity vary. The necessity/sufficiency heat maps for a particular component were subsequently used to generate a photoreceptor contribution heat map (See Figure 6). Black indicates no necessity/sufficiency and white indicates full necessity/sufficiency. DOI: http://dx.doi.org/10.7554/eLife.15392.027

Similar articles

Cited by

References

    1. Alam NM, Altimus CM, Douglas RM, Hattar S, Prusky GT. Photoreceptor regulation of spatial visual behavior. Investigative Opthalmology & Visual Science. 2015;56:1842–1849. doi: 10.1167/iovs.14-15644. - DOI - PubMed
    1. Allen AE, Brown TM, Lucas RJ. A distinct contribution of short-wavelength-sensitive cones to light-evoked activity in the mouse pretectal olivary nucleus. Journal of Neuroscience. 2011;31:16833–16843. doi: 10.1523/JNEUROSCI.2505-11.2011. - DOI - PMC - PubMed
    1. Altimus CM, Guler AD, Villa KL, McNeill DS, LeGates TA, Hattar S. Rods-cones and melanopsin detect light and dark to modulate sleep independent of image formation. PNAS. 2008;105:19998–20003. doi: 10.1073/pnas.0808312105. - DOI - PMC - PubMed
    1. Altimus CM, Güler AD, Alam NM, Arman AC, Prusky GT, Sampath AP, Hattar S. Rod photoreceptors drive circadian photoentrainment across a wide range of light intensities. Nature Neuroscience. 2010;13:1107–1112. doi: 10.1038/nn.2617. - DOI - PMC - PubMed
    1. Armbruster BN, Li X, Pausch MH, Herlitze S, Roth BL. Evolving the lock to fit the key to create a family of G protein-coupled receptors potently activated by an inert ligand. PNAS. 2007;104:5163–5168. doi: 10.1073/pnas.0700293104. - DOI - PMC - PubMed

Publication types

MeSH terms

Substances

LinkOut - more resources