. 2016 Dec;34(12):1287-1291.
doi: 10.1038/nbt.3682. Epub 2016 Sep 26.

Modeling of RNA-seq fragment sequence bias reduces systematic errors in transcript abundance estimation

Affiliations

Modeling of RNA-seq fragment sequence bias reduces systematic errors in transcript abundance estimation

Michael I Love et al. Nat Biotechnol. 2016 Dec.

Abstract

We find that current computational methods for estimating transcript abundance from RNA-seq data can lead to hundreds of false-positive results. We show that these systematic errors stem largely from a failure to model fragment GC content bias. Sample-specific biases associated with fragment sequence features lead to misidentification of transcript isoforms. We introduce alpine, a method for estimating sample-specific bias-corrected transcript abundance. By incorporating fragment sequence features, alpine greatly increases the accuracy of transcript abundance estimates, enabling a fourfold reduction in the number of false positives for reported changes in expression compared with Cufflinks. Using simulated data, we also show that alpine retains the ability to discover true positives, similar to other approaches. The method is available as an R/Bioconductor package that includes data visualization tools useful for bias discovery.


Figures

Figure 1
Figure 1
Quantification of transcript abundance from RNA-seq experiments. (a) RNA-seq biases. (b) Ignoring fragment sequence bias impairs transcript abundance estimation when isoform-specific regions have GC content or sequence features that lead to under-representation of fragments, resulting in false positives of predicted expression of isoforms that are lowly or not expressed.
Figure 1
Figure 1
Quantification of transcript abundance from RNA-seq experiments. (a) RNA-seq biases. (b) Ignoring fragment sequence bias impairs transcript abundance estimation when isoform-specific regions have GC content or sequence features that lead to under-representation of fragments, resulting in false positives of predicted expression of isoforms that are lowly or not expressed.
Figure 2
Figure 2
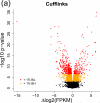
Problems with current transcript abundance estimation methods. (a) Volcano plot of a comparison of Cufflinks transcript estimates from center 1 against center 2, with 2,510 transcripts reported differentially expressed at a target FDR of 1% and 515 with family-wise error rate (FWER) of 1% using a more conservative Bonferroni correction. (b) Densities of GC content of isoform-specific regions from genes with two isoforms when one or more reported differential expression, compared to GC content of random exons. (c) Sashimi plot for GEUVADIS samples in a region of the USF2 gene containing the alternative exon distinguishing two isoforms, with the GC content of each exon listed below the gene model. Samples from center 1 had a drop-out in coverage on the high GC exons, including the alternative exon. The curved lines in the Sashimi plot represent RNA-seq reads spanning exon-exon junctions with numbers indicating number of supporting reads. (d) Cufflinks FPKM estimates for the two isoforms of USF2 where technical artifacts in coverage lead to discordant estimates of abundance across center. (e) Curves fit by alpine estimating dependence of fragment rate on GC content after controlling for random hexamer priming bias of read starts (see main text and Supplementary Note).
Figure 2
Figure 2
Problems with current transcript abundance estimation methods. (a) Volcano plot of a comparison of Cufflinks transcript estimates from center 1 against center 2, with 2,510 transcripts reported differentially expressed at a target FDR of 1% and 515 with family-wise error rate (FWER) of 1% using a more conservative Bonferroni correction. (b) Densities of GC content of isoform-specific regions from genes with two isoforms when one or more reported differential expression, compared to GC content of random exons. (c) Sashimi plot for GEUVADIS samples in a region of the USF2 gene containing the alternative exon distinguishing two isoforms, with the GC content of each exon listed below the gene model. Samples from center 1 had a drop-out in coverage on the high GC exons, including the alternative exon. The curved lines in the Sashimi plot represent RNA-seq reads spanning exon-exon junctions with numbers indicating number of supporting reads. (d) Cufflinks FPKM estimates for the two isoforms of USF2 where technical artifacts in coverage lead to discordant estimates of abundance across center. (e) Curves fit by alpine estimating dependence of fragment rate on GC content after controlling for random hexamer priming bias of read starts (see main text and Supplementary Note).
Figure 3
Figure 3
Modeling and correcting fragment sequence bias. (a) Boxplot comparing reduction in mean squared error (MSE) in predicting coverage for different bias models for all 8 samples and 64 transcripts (n=512). The models are “read start”: the Cufflinks VLMM for read starts, the mseq model for read starts, “GC”: a model using fragment GC content, “GC+str”: as in “GC” plus additional terms for stretches of high GC, “all”: the VLMM for read starts in addition to the terms in “GC+str”. The models including fragment GC doubled the reduction in MSE as the read start models. (b) Predicted coverage plots for bias models on GenBank BC011380 (raw coverage in blue, test-set predicted coverage in black). (c) and (d) Volcano plots of differential transcript expression across centers for genes with two isoforms (orange: Benjamini-Hochberg adjusted p values less than 1%; red: Bonferroni FWER rate less than 1%). (e) and (f) FPKM estimates for two isoforms of BASP1 across center. (g) ROC curves for a simulation of a confounded design, with fragment sequence bias drawn from 30 GEUVADIS samples. The “gold” ROC curve indicates the sensitivity and specificity using the true underlying fragment counts, without fragment sequence bias and with known transcript assignment for fragments (h) The partial area under the curve (AUC) for panel (g), considering false positive rate in [0, 0.2], scaled to take values between 0 and 1.
Figure 3
Figure 3
Modeling and correcting fragment sequence bias. (a) Boxplot comparing reduction in mean squared error (MSE) in predicting coverage for different bias models for all 8 samples and 64 transcripts (n=512). The models are “read start”: the Cufflinks VLMM for read starts, the mseq model for read starts, “GC”: a model using fragment GC content, “GC+str”: as in “GC” plus additional terms for stretches of high GC, “all”: the VLMM for read starts in addition to the terms in “GC+str”. The models including fragment GC doubled the reduction in MSE as the read start models. (b) Predicted coverage plots for bias models on GenBank BC011380 (raw coverage in blue, test-set predicted coverage in black). (c) and (d) Volcano plots of differential transcript expression across centers for genes with two isoforms (orange: Benjamini-Hochberg adjusted p values less than 1%; red: Bonferroni FWER rate less than 1%). (e) and (f) FPKM estimates for two isoforms of BASP1 across center. (g) ROC curves for a simulation of a confounded design, with fragment sequence bias drawn from 30 GEUVADIS samples. The “gold” ROC curve indicates the sensitivity and specificity using the true underlying fragment counts, without fragment sequence bias and with known transcript assignment for fragments (h) The partial area under the curve (AUC) for panel (g), considering false positive rate in [0, 0.2], scaled to take values between 0 and 1.

References

    1. Trapnell Cole, Williams Brian A., Pertea Geo, Mortazavi Ali, Kwan Gordon, van Baren Marijke J., Salzberg Steven L., Wold Barbara J., Pachter Lior. Transcript assembly and quantification by RNA-seq reveals unannotated transcripts and isoform switching during cell differentiation. Nat Biotechnol. 2010;28(5):511–515. - PMC - PubMed
    1. Li Bo, Ruotti Victor, Stewart Ron M., Thomson James A., Dewey Colin N. RNA-seq gene expression estimation with read mapping uncertainty. Bioinformatics. 2010;26(4):493–500. - PMC - PubMed
    1. 't Hoen Peter A. C., Friedlander Marc R., Almlof Jonas, Sammeth Michael, Pulyakhina Irina, Anvar Seyed Y., Laros Jeroen F. J., Buermans Henk P. J., Karlberg Olof, Brannvall Mathias, van Ommen Gert-Jan B., Estivill Xavier, Guigo Roderic, Syvanen Ann-Christine, Gut Ivo G., Dermitzakis Emmanouil T., Antonarakis Stylianos E., Brazma Alvis, Flicek Paul, Schreiber Stefan, Rosenstiel Philip, Meitinger Thomas, Strom Tim M., Lehrach Hans, Sudbrak Ralf, Carracedo Angel, 't Hoen Peter A. C., Pulyakhina Irina, Anvar Seyed Y., Laros Jeroen F. J., Buermans Henk P. J., van Iterson Maarten, Friedlander Marc R., Monlong Jean, Lizano Esther, Bertier Gabrielle, Ferreira Pedro G., Sammeth Michael, Almlof Jonas, Karlberg Olof, Brannvall Mathias, Ribeca Paolo, Griebel Thasso, Beltran Sergi, Gut Marta, Kahlem Katja, Lappalainen Tuuli, Giger Thomas, Ongen Halit, Padioleau Ismael, Kilpinen Helena, Gonzalez-Porta Mar, Kurbatova Natalja, Tikhonov Andrew, Greger Liliana, Barann Matthias, Esser Daniela, Hasler Robert, Wieland Thomas, Schwarzmayr Thomas, Sultan Marc, Amstislavskiy Vyacheslav, den Dunnen Johan T., van Ommen Gert-Jan B., Gut Ivo G., Guigo Roderic, Estivill Xavier, Syvanen Ann-Christine, Dermitzakis Emmanouil T., Lappalainen Tuuli. Reproducibility of high-throughput mRNA and small RNA sequencing across laboratories. Nat Biotechnol. 2013;31(11):1015–1022. - PubMed
    1. Su Zhenqiang, Labaj Pawel P., Li Sheng, Thierry-Mieg Jean, Thierry-Mieg Danielle, Shi Wei, Wang Charles, Schroth Gary P., Setterquist Robert A., Thompson John F., Jones Wendell D., Xiao Wenzhong, Xu Weihong, Jensen Roderick V., Kelly Reagan, Xu Joshua, Conesa Ana, Furlanello Cesare, Gao Hanlin, Hong Huixiao, Jafari Nadereh, Letovsky Stan, Liao Yang, Lu Fei, Oakeley Edward J., Peng Zhiyu, Praul Craig A., Santoyo-Lopez Javier, Scherer Andreas, Shi Tieliu, Smyth Gordon K., Staedtler Frank, Sykacek Peter, Tan Xin-Xing, Aubrey Thompson E, Vandesompele Jo, Wang May D., Wang Jian, Wolfinger Russell D., Zavadil Jiri, Auerbach Scott S., Bao Wenjun, Binder Hans, Blomquist Thomas, Brilliant Murray H., Bushel Pierre R., Cai Weimin, Catalano Jennifer G., Chang Ching-Wei, Chen Tao, Chen Geng, Chen Rong, Chierici Marco, Chu Tzu-Ming, Clevert Djork-Arne, Deng Youping, Derti Adnan, Devanarayan Viswanath, Dong Zirui, Dopazo Joaquin, Du Tingting, Fang Hong, Fang Yongxiang, Fasold Mario, Fernandez Anita, Fischer Matthias, Furio-Tari Pedro, Fuscoe James C., Caimet Florian, Gaj Stan, Gandara Jorge, Gao Huan, Ge Weigong, Gondo Yoichi, Gong Binsheng, Gong Meihua, Gong Zhuolin, Green Bridgett, Guo Chao, Guo Lei, Guo Li-Wu, Hadfield James, Hellemans Jan, Hochreiter Sepp, Jia Meiwen, Jian Min, Johnson Charles D., Kay Suzanne, Kleinjans Jos, Lababidi Samir, Levy Shawn, Li Quan-Zhen, Li Li, Li Li, Li Peng, Li Yan, Li Haiqing, Li Jianying, Li Shiyong, Lin Simon M., Lopez Francisco J., Lu Xin, Luo Heng, Ma Xiwen, Meehan Joseph, Megherbi Dalila B., Mei Nan, Mu Bing, Ning Baitang, Pandey Akhilesh, Perez-Florido Javier, Perkins Roger G., Peters Ryan, Phan John H., Pirooznia Mehdi, Qian Feng, Qing Tao, Rainbow Lucille, Rocca-Serra Philippe, Sambourg Laure, Sansone Susanna-Assunta, Schwartz Scott, Shah Ruchir, Shen Jie, Smith Todd M., Stegle Oliver, Stralis-Pavese Nancy, Stupka Elia, Suzuki Yutaka, Szkotnicki Lee T., Tinning Matthew, Tu Bimeng, van Delft Joost, Vela-Boza Alicia, Venturini Elisa, Walker Stephen J., Wan Liqing, Wang Wei, Wang Jinhui, Wang Jun, Wieben Eric D., Willey James C., Wu Po-Yen, Xuan Jiekun, Yang Yong, Ye Zhan, Yin Ye, Yu Ying, Yuan Yate-Ching, Zhang John, Zhang Ke K., Zhang Wenqian, Zhang Wenwei, Zhang Yanyan, Zhao Chen, Zheng Yuanting, Zhou Yiming, Zumbo Paul, Tong Weida, Kreil David P., Mason Christopher E., Shi Leming. A comprehensive assessment of RNA-seq accuracy, reproducibility and information content by the sequencing quality control consortium. Nat Biotechnol. 2014;32(9):903–914. - PMC - PubMed
    1. Li Sheng, Labaj Pawel P., Zumbo Paul, Sykacek Peter, Shi Wei, Shi Leming, Phan John, Wu Po-Yen, Wang May, Wang Charles, Thierry-Mieg Danielle, Thierry-Mieg Jean, Kreil David P., Mason Christopher E. Detecting and correcting systematic variation in large-scale RNA sequencing data. Nat Biotechnol. 2014;32(9):888–895. - PMC - PubMed