. 2016 Nov 1;126(11):4103-4118.
doi: 10.1172/JCI87492. Epub 2016 Sep 26.

Mast cell desensitization inhibits calcium flux and aberrantly remodels actin

Mast cell desensitization inhibits calcium flux and aberrantly remodels actin

W X Gladys Ang et al. J Clin Invest. .

Abstract

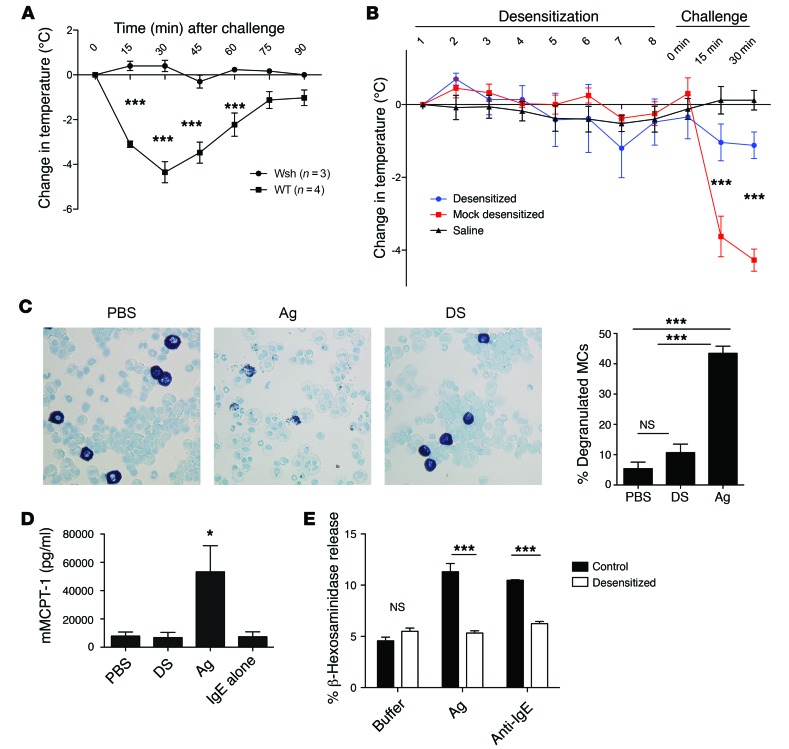
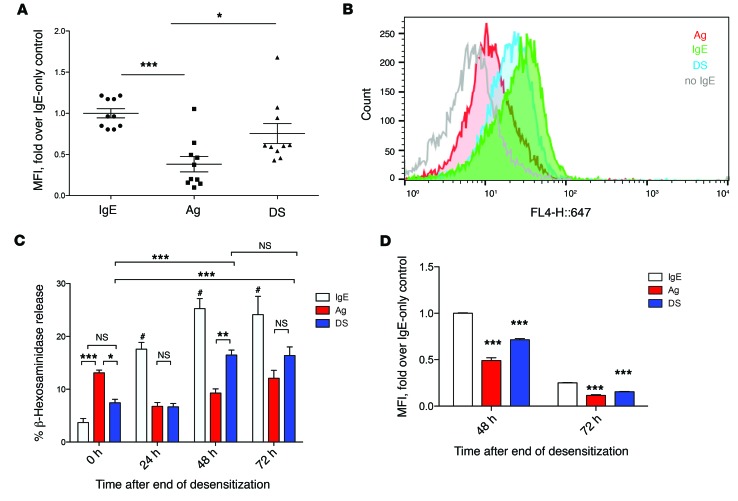
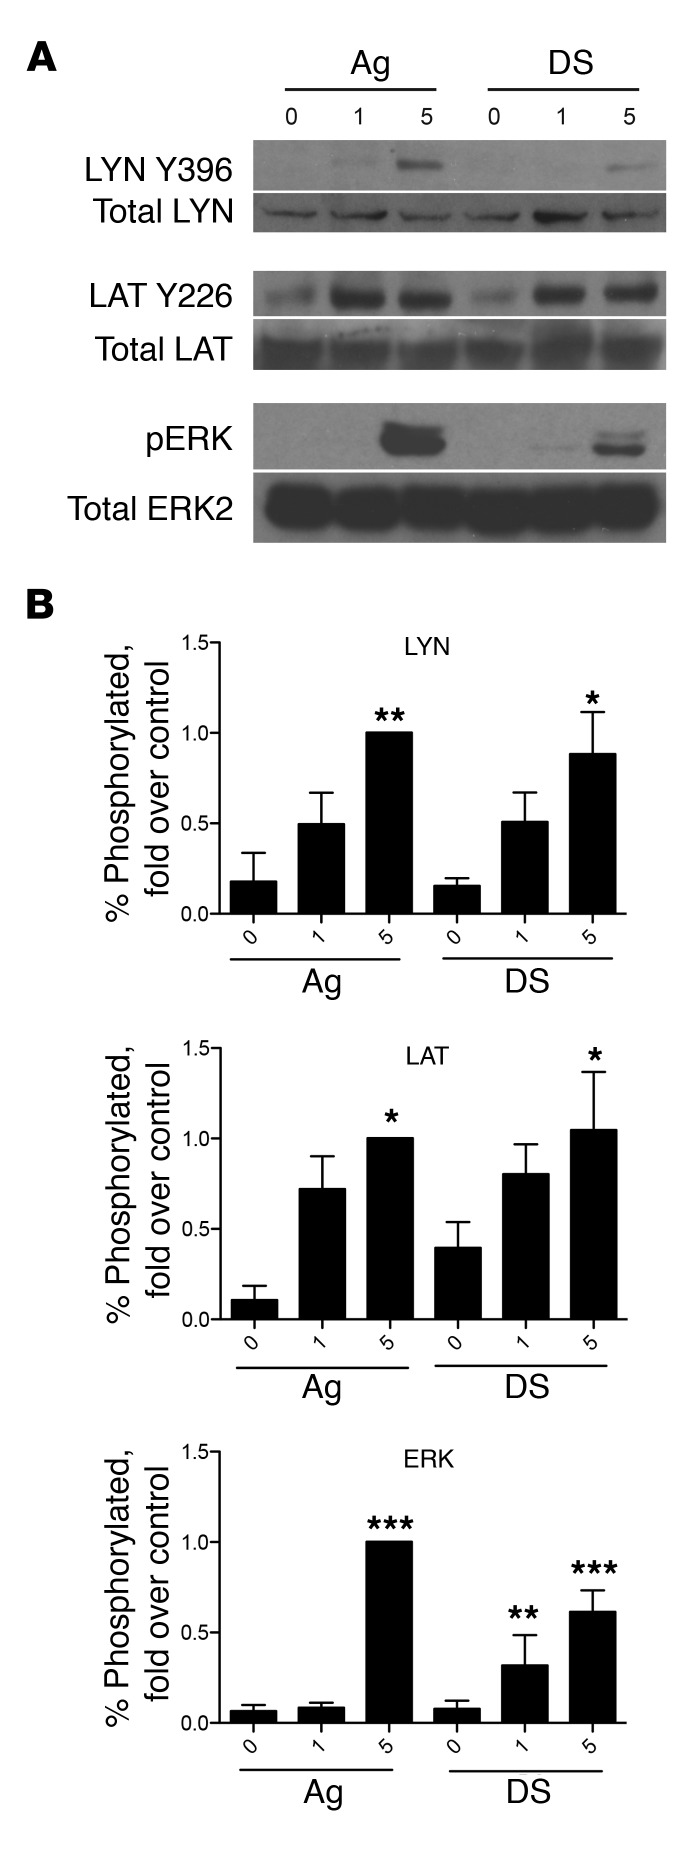
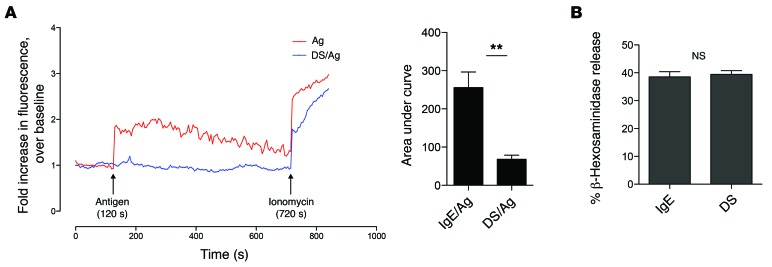
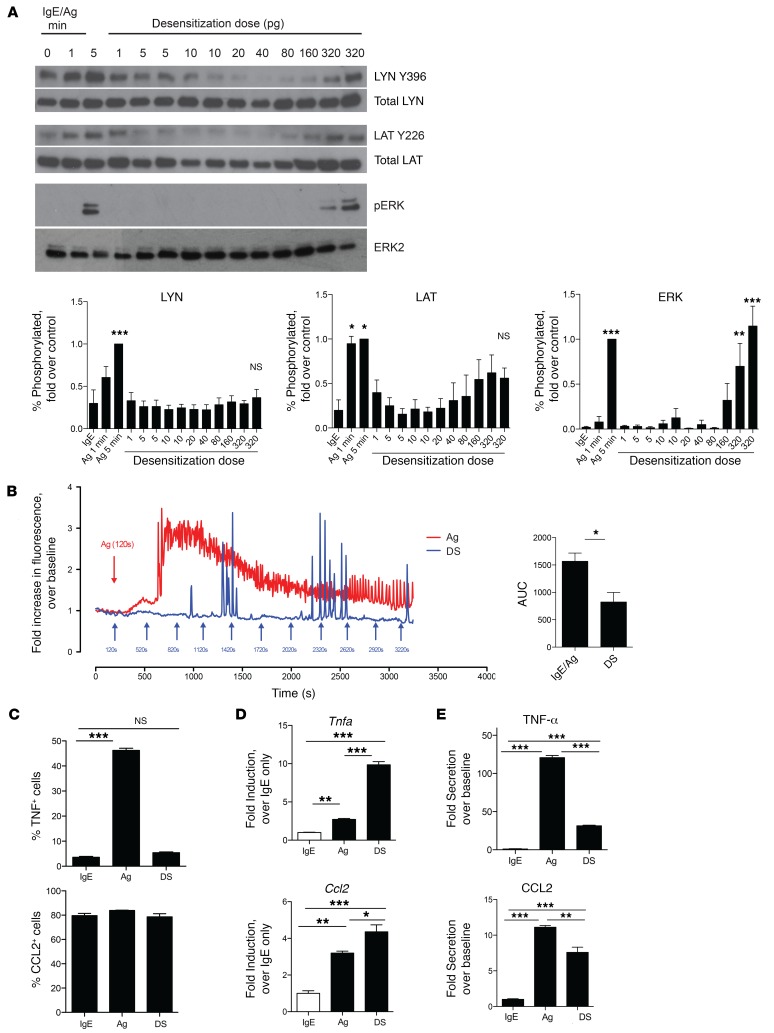
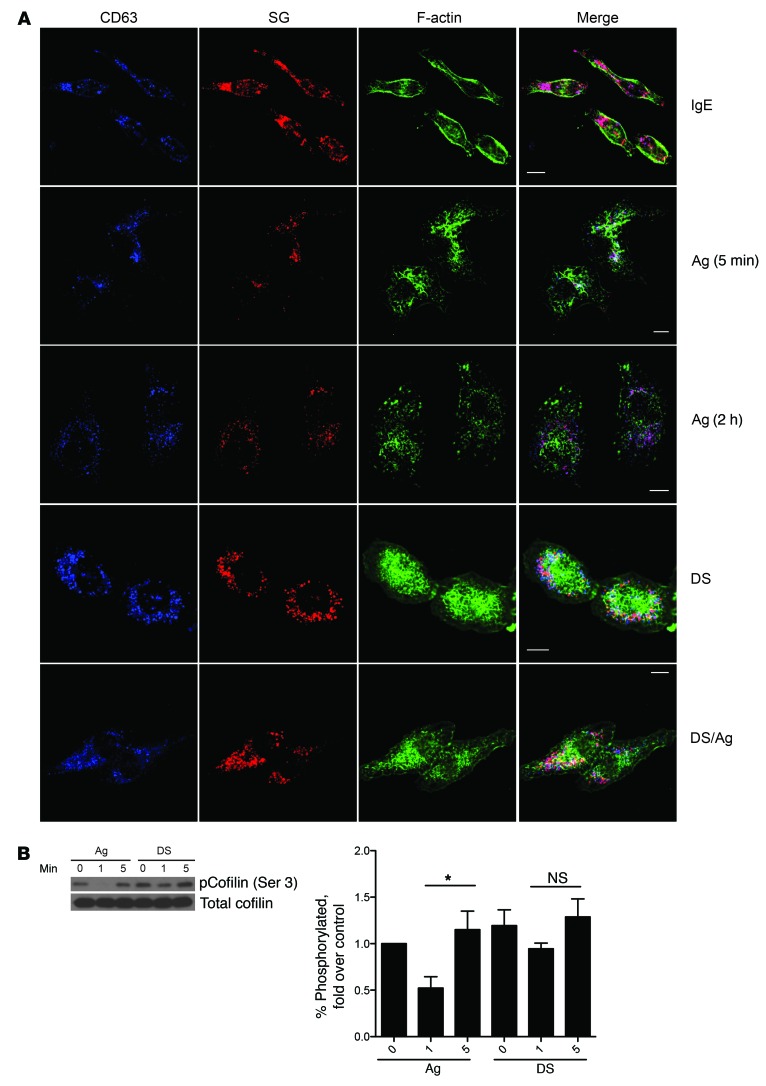
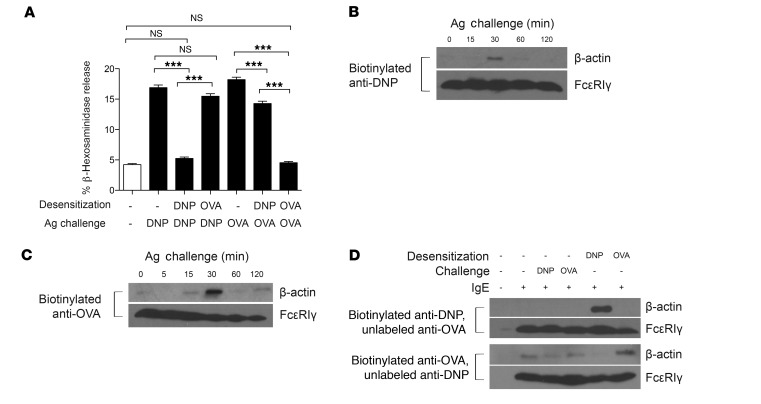
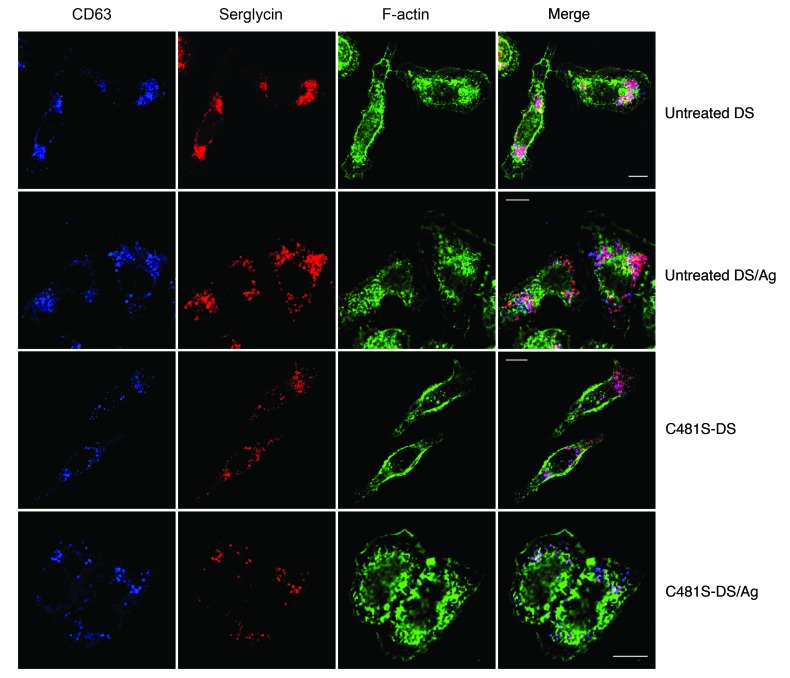
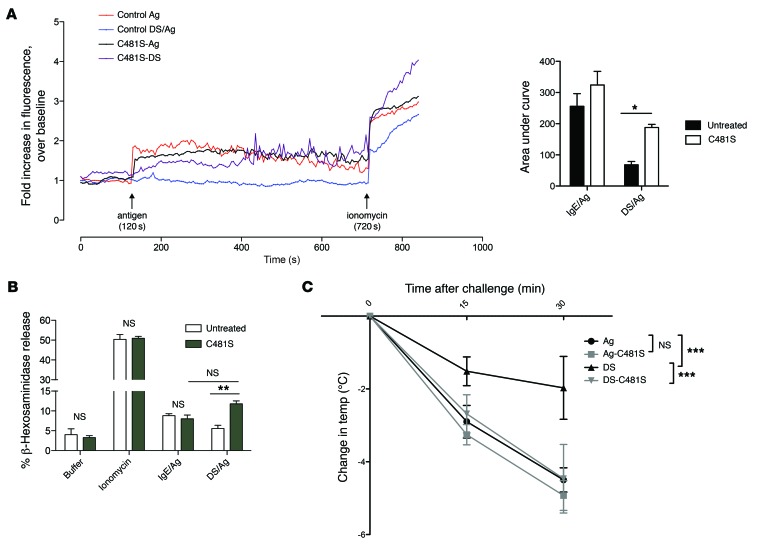
Rush desensitization (DS) is a widely used and effective clinical strategy for the rapid inhibition of IgE-mediated anaphylactic responses. However, the cellular targets and underlying mechanisms behind this process remain unclear. Recent studies have implicated mast cells (MCs) as the primary target cells for DS. Here, we developed a murine model of passive anaphylaxis with demonstrated MC involvement and an in vitro assay to evaluate the effect of DS on MCs. In contrast with previous reports, we determined that functional IgE remains on the cell surface of desensitized MCs following DS. Despite notable reductions in MC degranulation following DS, the high-affinity IgE receptor FcεRI was still capable of transducing signals in desensitized MCs. Additionally, we found that displacement of the actin cytoskeleton and its continued association with FcεRI impede the capacity of desensitized MCs to evoke the calcium response that is essential for MC degranulation. Together, these findings suggest that reduced degranulation responses in desensitized MCs arise from aberrant actin remodeling, providing insights that may lead to improvement of DS treatments for anaphylactic responses.


Figures

Figure 1
Figure 1. In vivo and in vitro models of desensitization.
(AD) Mice were sensitized i.p. with 10 μg IgE and challenged i.p. with 500 μg TNP-OVA. Temperatures were measured rectally and expressed as change in initial temperature. (A) MC-deficient Wsh mice and WT mice were challenged with Ag and monitored for 90 minutes (n = 3–4). (B) Mice were orally desensitized or mock treated for 8 doses, each spaced 30 minutes apart. Thirty minutes after the last dose, mice were challenged with Ag and rectal temperatures recorded every 15 minutes. Mice were given saline throughout (n = 5). (C) Peritoneal lavage was obtained at the end of desensitization or equivalent period of i.p. Ag challenge or PBS treatment (n = 4–5 per group). Lavage was cytospun and stained with toluidine blue, and the percentage of degranulated MCs was counted in 5 random fields per cytospin. Representative images at ×40 magnification are shown. (D) Mice were bled at the end of desensitization or Ag challenge as in B and serum analyzed via ELISA for MCPT-1 (n = 5). 5 × 10⁵ IgE-sensitized BMMCs in triplicate were desensitized or control treated, then challenged with buffer, 10 ng/ml Ag, or 0.5 μg/ml anti-IgE. β-Hexosaminidase release was measured and expressed as a percentage of total. Data were analyzed via repeated-measures ANOVA (A and B), 1-way ANOVA (C and D), or 2-way ANOVA (E). Error bars represent SEM. *P < 0.05, ***P < 0.001.
Figure 2
Figure 2. Complete depletion of surface IgE does not occur with desensitization.
(A) IgE-sensitized mice were desensitized (DS), challenged with antigen (Ag), or injected with PBS (IgE). At the end of desensitization, mice were sacrificed for peritoneal lavage. Lavage cells were incubated with A647-labeled TNP-OVA for 1 hour on ice, then washed 5 times with PBS before fixation and assay via FACS. Data were expressed as fold median fluorescence intensity (MFI) over IgE alone. Data are combined from 2 experiments (n = 10). (B) 5 × 10⁵ IgE-sensitized BMMCs per sample in quintuplicate were desensitized (blue), Ag challenged (red), or untreated (green), then labeled with A647–TNP-OVA as in A. BMMCs without IgE were also incubated with labeled TNP-OVA as control (gray). A histogram representative of at least 3 experiments is shown. (C) 5 × 10⁵ BMMCs per sample of IgE-alone (IgE), Ag-challenged (Ag), or desensitized (DS) cells were washed 3 times in PBS before resuspension in 500 μl RPMI without IgE. Zero to 72 hours later, cells were collected and challenged with 10 ng/ml Ag. Degranulation was measured using a β-hexosaminidase assay. (D) Control (IgE), Ag-challenged (Ag), or desensitized (DS) cells were incubated for 0 or 48 hours before being assayed for surface staining of IgE via FACS. Data are representative of at least 3 independent experiments. Data were analyzed via 1-way (A) or 2-way (C and D) ANOVA. Error bars indicate SEM. *P < 0.05, **P < 0.01, ***P < 0.001, #P < 0.001 compared with all other groups.
Figure 3
Figure 3. Desensitized cells have signaling responses to Ag.
(A) 2 × 10⁶ BMMCs per sample were sensitized with IgE, desensitized (DS), or left untreated (Ag) before challenge with Ag for 0, 1, or 5 minutes. Cells were directly lysed in 4× Laemmli buffer for SDS-PAGE and immunoblotted for phospho- and total LYN, LAT, and ERK. Representative blots from 4 experiments are shown. (B) Densitometry was performed on blots from 4–5 experiments. Data were expressed as percentage of phosphorylated protein compared with total, then normalized to the positive control (5 minutes Ag activation). Data were analyzed via 1-way ANOVA and represent SEM. *P < 0.05, **P < 0.01, ***P < 0.001 compared with IgE group.
Figure 4
Figure 4. Calcium mobilization is inhibited in desensitized cells.
(A) IgE-sensitized BMMCs were left untreated (blue) or desensitized (red). After labeling with Fluo-4, cells were challenged with Ag (arrow) for 5 minutes. Responsiveness was confirmed by addition of ionomycin. Fluorescence was normalized to baseline. A representative graph is shown. AUC analyses were averaged from at least 4 independent experiments. (B) 5 × 10⁵ BMMCs per sample in triplicate were desensitized or control treated before addition of 1 μg/ml ionomycin. Degranulation was measured via β-hexosaminidase assay. Data were analyzed via 2-tailed Student’s t test. Error bars represent SEM. **P < 0.01.
Figure 5
Figure 5. Signal transduction but no calcium mobilization during RDS.
(A) 2 × 10⁶ BMMCs per sample were sensitized with IgE before Ag challenge for 0, 1, or 5 minutes (first 3 lanes) or desensitized (lanes 4–14), with samples collected 1 minute after each dose was added. Samples were immunoblotted for phospho- and total LYN, LAT, and ERK. Blots are representative of at least 3 experiments. For densitometry, data were expressed as percentage of phosphorylated protein compared with total, then normalized to the positive control (5 minutes Ag). Data were analyzed via 1-way ANOVA with comparisons with IgE (Dunnett’s post-test). (B) BMMCs were adhered to Cell-Tak–coated (Corning) glass-bottomed plates for calcium imaging. Cells were stimulated with Ag or desensitized (DS), with successive doses added every 5 minutes (arrows). AUC analyses were averaged from 4–5 independent experiments. (CE) 5 × 10⁵ IgE-sensitized BMMCs per sample in triplicate were desensitized (DS), antigen challenged (Ag), or untreated (IgE). (C) BMMCs were incubated with brefeldin A for 8 hours before intracellular staining for FACS. (D) RNA was isolated from cell pellets for cDNA preparation. Quantitative RT-PCR was performed using primers for Ccl2 and Tnfa and normalized to Actb expression. (E) Cell supernatants after 24 hours were analyzed for CCL2 and TNF-α secretion. Data were expressed as fold over IgE-only controls. Data were analyzed via 1-way ANOVA (A and CE) or Student’s t test (B). Data represent SEM. *P < 0.05, **P < 0.01, ***P < 0.001.
Figure 6
Figure 6. Distinct actin reorganization in desensitized cells.
(A) Serglycin (SG)–mCherry (red) RBL-2H3 cells were plated on coverslips before desensitization and/or challenge with Ag for 5 minutes followed by fixation and staining for CD63 (blue) and F-actin (green). Images are representative of at least 3 independent experiments. Scale bars: 10 μm. (B) 2 × 10⁶ BMMCs per sample were desensitized (DS) or untreated (Ag) before challenge with Ag for 0, 1, or 5 minutes. Lysates were immunoblotted for phosphorylated and total cofilin. Blots represent at least 4 experiments. Densitometry data were expressed as percentage phosphorylated protein compared with total, then normalized to control (IgE). Data were analyzed via 1-way ANOVA. Data represent SEM. *P < 0.05.
Figure 7
Figure 7. Antigen specificity of desensitization.
(A) RBL-2H3 cells were sensitized with a 1:5 ratio of anti-DNP to anti-OVA IgE, then desensitized to DNP-HSA or OVA before challenge with DNP-HSA (10 ng/ml) or OVA (1 μg/ml). Data were analyzed via 1-way ANOVA and are representative of at least 3 independent experiments. (B and C) 107 BMMCs per sample were sensitized with biotinylated IgE, then challenged with Ag for the indicated times. Lysates were immunoprecipitated with streptavidin beads and blotted for β-actin and FcεRIγ. (D) 107 BMMCs per sample were sensitized with a mixture of biotinylated and unbiotinylated IgE, then desensitized or challenged with Ag for the same amount of time (~2 hours). Lysates were then immunoprecipitated with streptavidin beads and blotted for β-actin and FcεRIγ. Data represent SEM. ***P < 0.001.
Figure 8
Figure 8. Manipulation of the actin cytoskeleton reverses actin changes caused by desensitization.
IgE-sensitized serglycin-mCherry (red) RBL-2H3 cells were plated onto covered coverslips and desensitized, then treated with control or 20 μg/ml SptPC481S-TAT for 45 minutes before challenge with Ag for 5 minutes followed by fixation and staining for CD63 (blue) and F-actin (green). Images are representative of 3 independent experiments. Scale bars: 10 μm.
Figure 9
Figure 9. Manipulation of the actin cytoskeleton reverses desensitization in vitro and in vivo.
(A) Control (C481S-Ag) or desensitized (C481S-DS) BMMCs were treated with SptPC481S-TAT (C481S-Ag, C481S-DS) or buffer (control Ag, control DS/Ag) for 30 minutes before being loaded with Fluo-4. After measurement of baseline fluorescence for 2 minutes, cells were activated with 10 ng/ml Ag and ionomycin. A representative graph is shown. AUC was averaged from 4–5 independent experiments. (B) Control (IgE/Ag, buffer, and ionomycin) or desensitized (DS/Ag) BMMCs were treated with 10 μg SptPC481S-TAT (C481S) or untreated before challenge with Ag, buffer, or ionomycin for β-hexosaminidase assay. Data are representative of at least 3 independent experiments. (C) IgE-sensitized mice were orally desensitized (DS, DS-C481S) or given PBS (Ag, Ag-C481S). Mice were then injected with 50 μg SptPC481S-TAT (Ag-C481S, DS-C481S) or equal volume PBS (Ag, DS). One hour later, mice were challenged i.p. with 500 μg Ag. Rectal temperatures were measured every 15 minutes for 30 minutes. Results were pooled from 2 independent experiments (n = 10). Data were analyzed via 2-way ANOVA (A and B) and repeated-measures ANOVA (C). Data represent SEM. *P < 0.05, **P < 0.01, ***P < 0.001.

Similar articles

Cited by

References

    1. Simons FE. 9. Anaphylaxis. J Allergy Clin Immunol. 2008;121(2 suppl):S402–S407. - PubMed
    1. Cernadas JR, et al. General considerations on rapid desensitization for drug hypersensitivity - a consensus statement. Allergy. 2010;65(11):1357–1366. doi: 10.1111/j.1398-9995.2010.02441.x. - DOI - PubMed
    1. Mirakian R, et al. Management of allergy to penicillins and other beta-lactams. Clin Exp Allergy. 2015;45(2):300–327. doi: 10.1111/cea.12468. - DOI - PubMed
    1. Castells M. Rapid desensitization of hypersensitivity reactions to chemotherapy agents. Curr Drug Saf. 2006;1(3):243–251. doi: 10.2174/157488606777934413. - DOI - PubMed
    1. Land MH, Kim EH, Burks AW. Oral desensitization for food hypersensitivity. Immunol Allergy Clin North Am. 2011;31(2):367–376. - PMC - PubMed

Publication types