. 2016 Sep 27;19(10):1280-5.
doi: 10.1038/nn.4382.

Value, search, persistence and model updating in anterior cingulate cortex

Affiliations

Value, search, persistence and model updating in anterior cingulate cortex

Nils Kolling et al. Nat Neurosci. .

Abstract

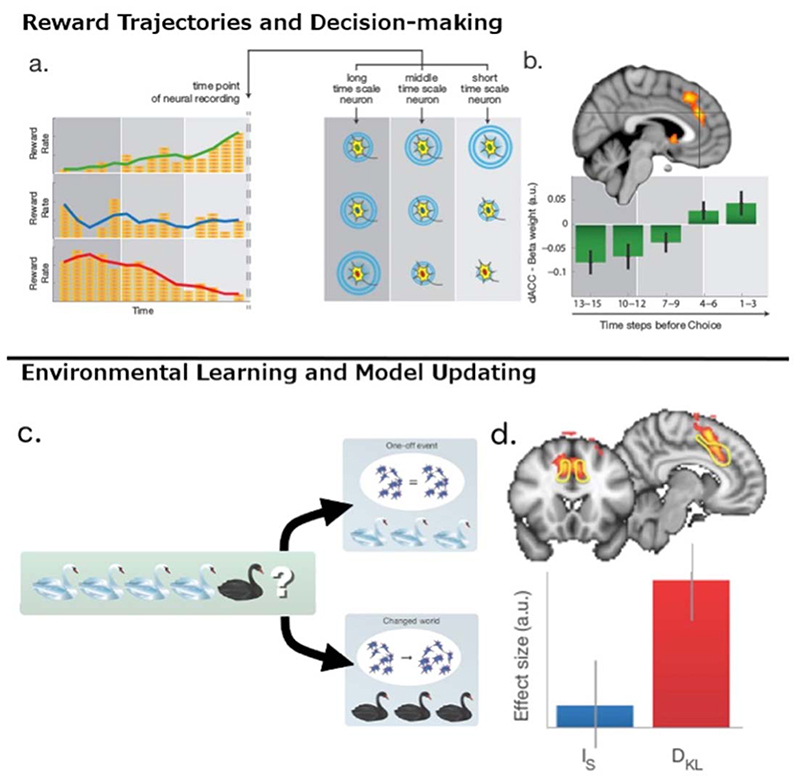
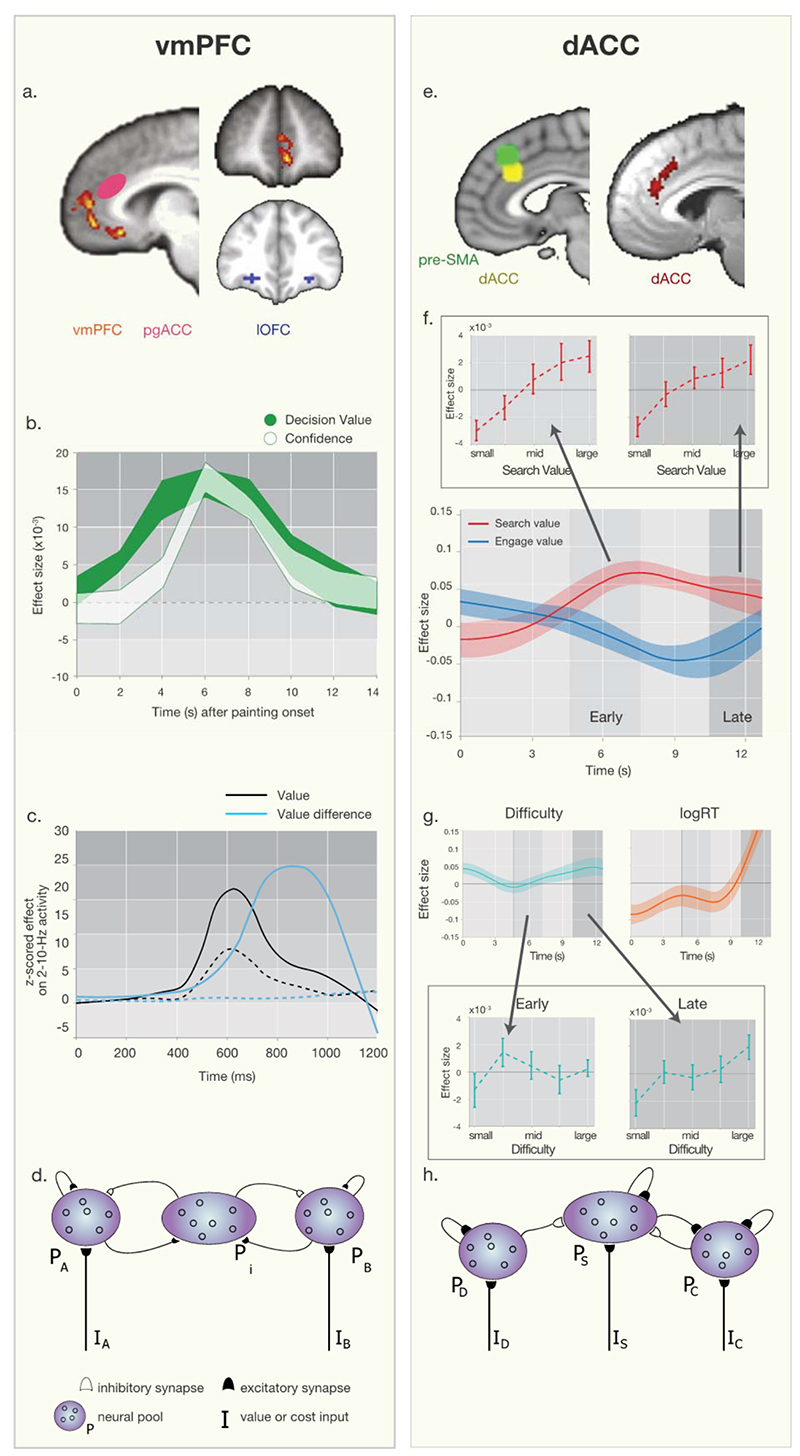
Dorsal anterior cingulate cortex (dACC) carries a wealth of value-related information necessary for regulating behavioral flexibility and persistence. It signals error and reward events informing decisions about switching or staying with current behavior. During decision-making, it encodes the average value of exploring alternative choices (search value), even after controlling for response selection difficulty, and during learning, it encodes the degree to which internal models of the environment and current task must be updated. dACC value signals are derived in part from the history of recent reward integrated simultaneously over multiple time scales, thereby enabling comparison of experience over the recent and extended past. Such ACC signals may instigate attentionally demanding and difficult processes such as behavioral change via interactions with prefrontal cortex. However, the signal in dACC that instigates behavioral change need not itself be a conflict or difficulty signal.


Figures

Figure 1
Figure 1. Comparing dACC and pgACC in humans and macaques.
(a) Every brain region has a distinctive “fingerprint” of connections. To compare brain areas in humans and macaques we first identify the fingerprint of the human area. This is estimated from its fMRI-derived resting state activity correlations with other brain areas (left). There is strong positive coupling with the area marked on the circumference when the green line is close to the circumference. The fingerprint can then be compared with fingerprints of every frontal area in the macaque. The best matching fingerprint from the other species is shown in red on the right. Comparison of fingerprints suggests (b) dACC and (c) pgACC similarities in humans and macaques. In each case task-related human brain activity is shown on the left. Activity in dACC activity from Behrens and colleagues is shown in b. Panel c shows activity in pgACC covarying with participants’ general willingness to forage amongst alternative choices despite costs recorded by Kolling and colleagues (far left) and activity recorded by McGuire and Kable (to its right) also in pgACC and adjacent dorsomedial prefrontal cortex that is related to moment-to-moment variation in the value of persisting in a choice through a time delay. The anatomical names used by the two sets of authors differed but the activations’ proximity highlight the fact that it is the same region that is active in both studies. In each case the center shows fingerprints for the same areas based on a set of 23 key brain regions for the human (green) and best matching macaque area (red). On the right heat maps show the strength of fingerprint correspondence for all voxels in the macaque frontal lobe (red indicates strong correspondence and arrows indicate peak correspondence). DACC and pgACC are associated with different patterns of resting state connectivity but in each case corresponding areas are found in the macaque.
Figure 2
Figure 2. The derivation of value signals in dACC and the presence of model updating signals in dACC.
(a) Deriving value signals from the history of past rewards in macaque and human dACC over multiple time scales. (left) The value of a choice can be estimated from the history of I rewards associated with it. A choice may be associated first with high value (many coins, red line), low value (green), or medium value (blue). Changes in reward rates over time mean that red and green option values reverse over time. (right) The activity of neurons in macaque dACC reflects the history of rewards received over different time scales allowing the simultaneous representation of value estimates over different time periods,. A neuron sensitive to reward over longer time scales will be more active, all other things being equal, when a choice is initially associated with high levels of reward (bottom) than low levels (top). A neuron sensitive to short term reward histories, all other things being equal, will be more active when recent experience has been good (top) rather than bad (bottom). (b) Human dACC also reflects reward history over different time scales simultaneously. The relative weight and sign assigned to more recent and more distant reward history suggest a comparison that effectively allows for the projection of future expected reward trajectories (has reward been encountered more frequently recently than over the longer term average) that could guide decisions to keep with a default or to change. (c) DACC is active when internal models are updated not just when task difficulty increases because surprising events occur. Imagine a naturalist who has only ever observed white swans. On first visiting a new country they come across a black swan for the first time. Should they treat this new swan as an outlier and continue to expect that the next swan they see will be white as usual? Alternatively should they update their model of the new environment and expect to see more black swans? In the first case it may be difficult to know how to respond to the surprising new event but the neural representation of the environment remains constant. In the second case the neural representation is reconfigured. (d) Whole-brain cluster-corrected fMRI analysis indicated a region spanning dACC and adjacent pre-SMA in which there was a significant effect of model updating (contrast shows all voxels with a parametric effect of DKL). The ROI denoted by the yellow line is the dACC region of interest analysed in the lower part of the panel to show mean effect size for surprise (IS) and updating (DKL) (error bars are SEM). Adapted from.
Figure 3
Figure 3. Comparing vmPFC and dACC values signals and decision-making processes.
Both vmPFC (left column) and dACC (right column) are anatomically distinct from adjacent areas. In both areas multiple signals are present but can be explained in relation to biophysically plausible neural network models. (a) Whole brain cluster’corrected value difference (chosen’unchosen option value) signal in vmPFC (orange) is anatomically distinct from reward activity in more lateral OFC (blue on coronal section) and pgACC (sometimes also called “vmPFC”, magenta oval on sagittal section). (b) fMRI time course analysis reveals vmPFC activity reflects both decision value (green) and confidence (white) [adopted from]. (c) MEG recordings show vmPFC activity first reflects the sum of the values (black) of the possible choices and then the difference (blue) in the choices’ values (solid lines are correct trials, dashed lines are errors; adapted from) but these different signals can be explained by (d) a neural network model. PA and PB are two pools of neurons in which activity is a function of the value of options A and B respectively. There are recurrent excitatory connections within both pools but between pools interactions are inhibitory and mediated by pool PI. The inhibitory interneurons instantiate a competitive “value comparison” process that leaves a single pool in an attractor state and a decision is made. (e) Left panel shows yellow dACC ROI from which signals were extracted. The region it is anatomically distinct from the location of difficulty effects in or near pre’SMA (green). Right panel shows the whole brain cluster’corrected effect of search value in dACC in red, even after controlling for difficulty and log(RT) (peak MNI,x=‘4mm;y=36mm;z=26mm). (f) fMRI timecourse analysis of dACC reveals effects of search value (red) followed by engage value (blue) even after controlling for later effects of other factors (g) such as logRT (red) and difficulty (blue). Insets in panel f show the BOLD signal binned by different levels of search value illustrating a search value signal emerges early and is sustained until late in the trial but insets in panel g show that, using a similar binning approach, difficulty effects emerge only later. Arrows linking insets to timecourses indicate approximate time of binning analysis. (g) Network model of dACC explaining the sequence of activity in f. Here, similarly to the network model in d distinct neural populations receive different value input and interact with each other via mutual inhibition and excitation. However, we believe that compared to the symmetric representation of different option values in d, this network model of dACC, has a larger population that represents the value of the environment and is sensitive to environmental context and meta changes such as volatility (Referred to as Ps for a population that can represent search value). Due to dACC’s well established signals related to costs such as effort and pain, we believe such representations to interact with neural population here referred to as Pc (i.e. a population signaling costs). Furthermore, the value of sticking with a default option is also implemented here as PD (i.e. population signaling a pull or bias toward a default), as a self-sustaining neural population that inhibits populations representing the value of exploration or the overall environment Ps. Note however, that this inhibitory impact on dACC might not be implemented as a symmetric interaction and might originate from remote regions. Furthermore, as for panel d, one very important remaining question is how those neural population trigger appropriate responses after a decision has been reached. In this model population PS might simply initiate behavioral adaptation and exploratory behavior, as well as a mode in which there is increased plasticity, model updating, and learning.

Comment in

References

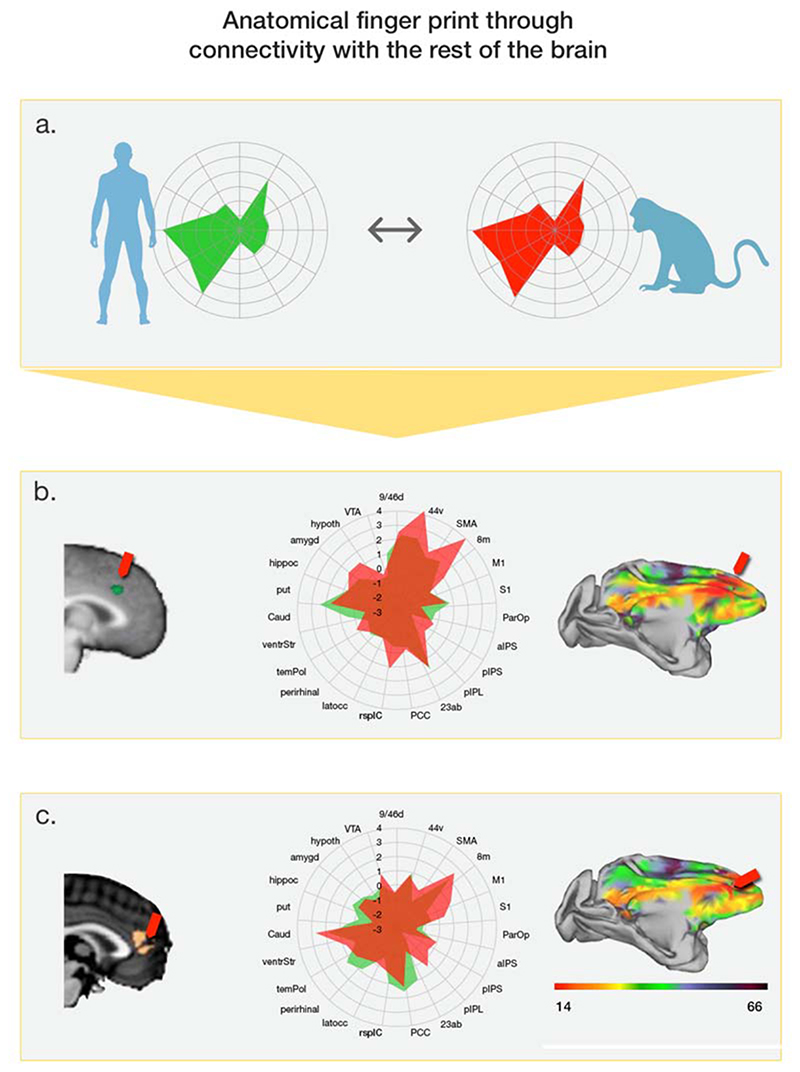
    1. Neubert FX, Mars RB, Sallet J, Rushworth MF. Connectivity reveals relationship of brain areas for reward-guided learning and decision making in human and monkey frontal cortex. Proceedings of the National Academy of Sciences of the United States of America. 2015 doi: 10.1073/pnas.1410767112. - DOI - PMC - PubMed
    1. Behrens TE, Fox P, Laird A, Smith SM. What is the most interesting part of the brain? Trends Cogn Sci. 2013;17:2–4. doi: 10.1016/j.tics.2012.10.010. - DOI - PMC - PubMed
    1. Kolling N, Behrens TE, Mars RB, Rushworth MF. Neural mechanisms of foraging. Science. 2012;336:95–98. doi: 10.1126/science.1216930. 336/6077/95 [pii] - DOI - PMC - PubMed
    1. Seo H, Lee D. Temporal filtering of reward signals in the dorsal anterior cingulate cortex during a mixed-strategy game. J Neurosci. 2007;27:8366–8377. - PMC - PubMed
    1. Wittmann M, et al. Predicting how your luck will change: decision making driven by multiple time-linked reward representations in anterior cingulate cortex. Nature Communications. 2016 - PMC - PubMed