Comparative Study
. 2016 Dec;40(8):732-743.
doi: 10.1002/gepi.21994. Epub 2016 Sep 26.

Validity of using ad hoc methods to analyze secondary traits in case-control association studies

Affiliations
Comparative Study

Validity of using ad hoc methods to analyze secondary traits in case-control association studies

Godwin Yung et al. Genet Epidemiol. 2016 Dec.

Abstract

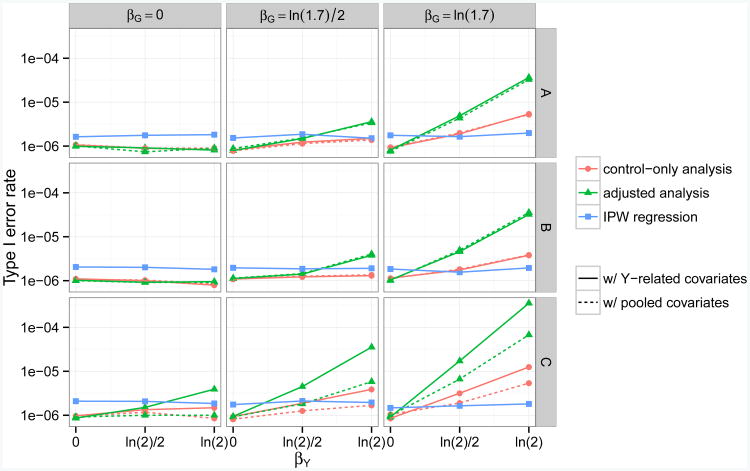
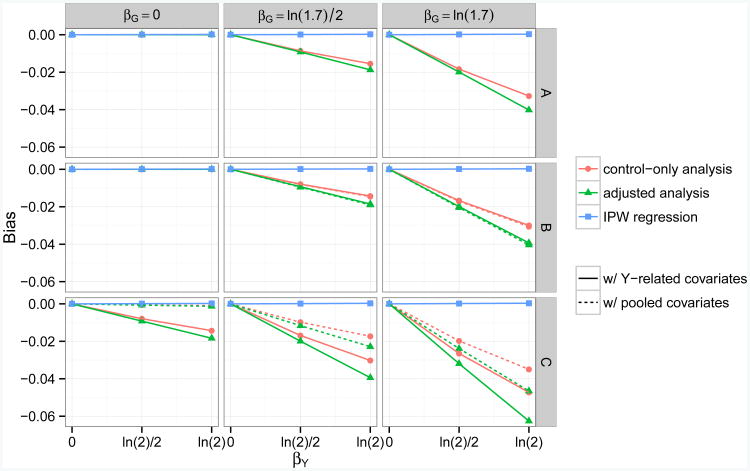
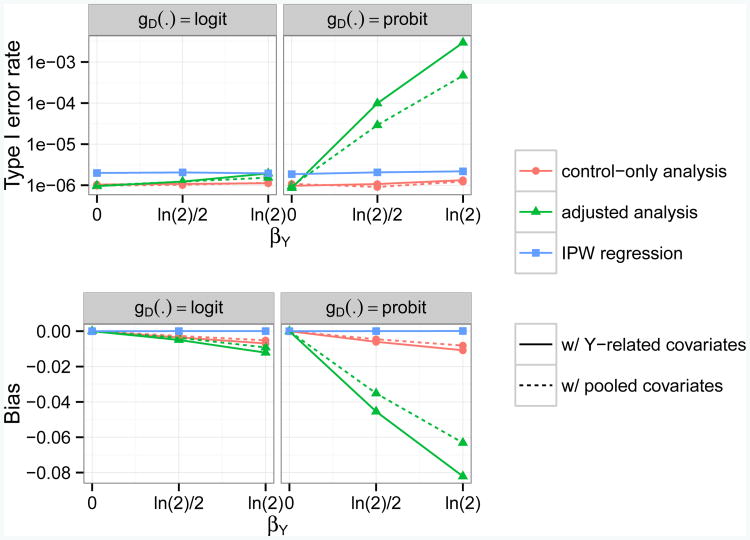
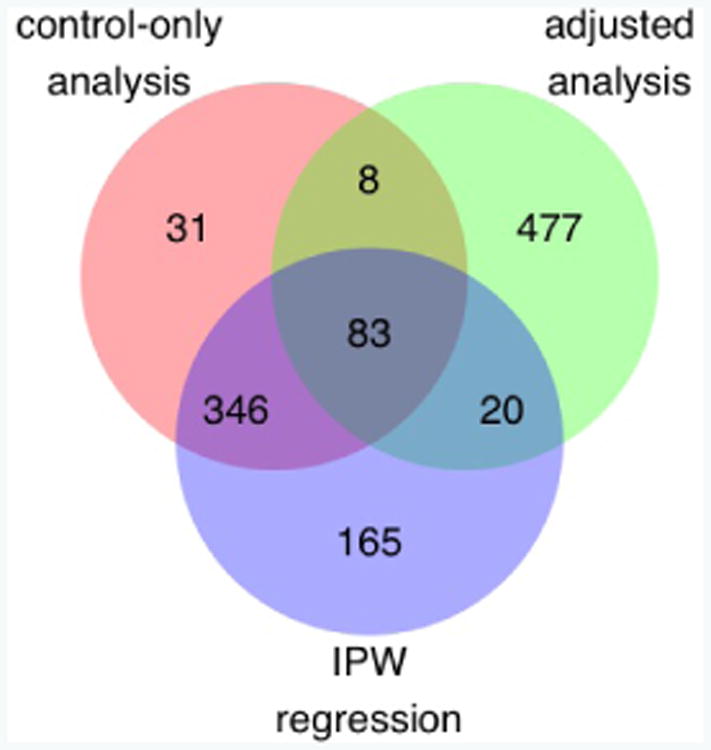
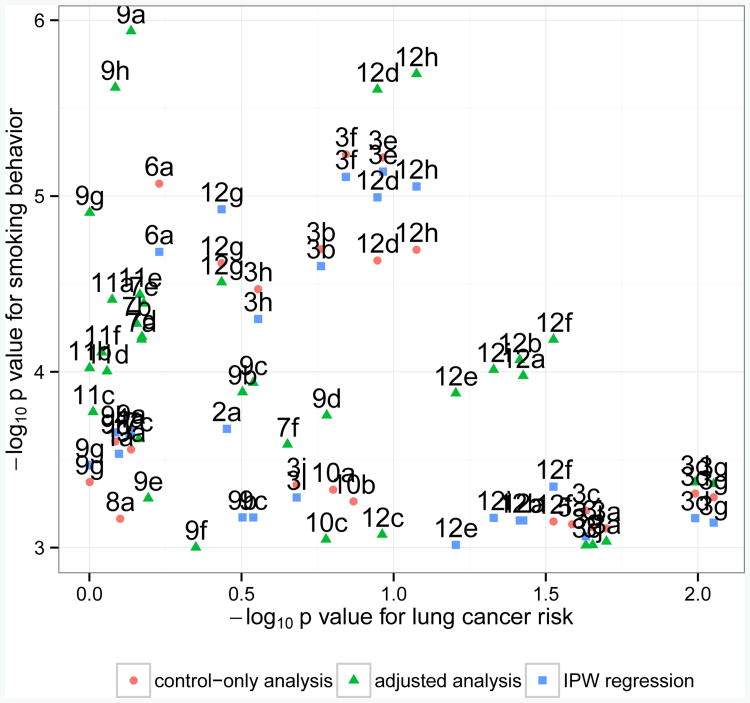
Case-control association studies often collect from their subjects information on secondary phenotypes. Reusing the data and studying the association between genes and secondary phenotypes provide an attractive and cost-effective approach that can lead to discovery of new genetic associations. A number of approaches have been proposed, including simple and computationally efficient ad hoc methods that ignore ascertainment or stratify on case-control status. Justification for these approaches relies on the assumption of no covariates and the correct specification of the primary disease model as a logistic model. Both might not be true in practice, for example, in the presence of population stratification or the primary disease model following a probit model. In this paper, we investigate the validity of ad hoc methods in the presence of covariates and possible disease model misspecification. We show that in taking an ad hoc approach, it may be desirable to include covariates that affect the primary disease in the secondary phenotype model, even though these covariates are not necessarily associated with the secondary phenotype. We also show that when the disease is rare, ad hoc methods can lead to severely biased estimation and inference if the true disease model follows a probit model instead of a logistic model. Our results are justified theoretically and via simulations. Applied to real data analysis of genetic associations with cigarette smoking, ad hoc methods collectively identified as highly significant (P<10-5) single nucleotide polymorphisms from over 10 genes, genes that were identified in previous studies of smoking cessation.

Keywords: SNPs; case-control sampling; genome-wide association studies; linear regression; logistic regression; secondary phenotypes.


Figures

Fig 1
Fig 1
Empirical type I error rates for testing genetic associations with a continuous secondary trait, at genome-wide α = 10−6 level and across scenarios with different combinations of βY, βG, γ1 and βZ1. Five methods (Analysis 2,4,6,8,9) are compared here. Each method takes either a control-only, adjusted, or IPW approach, and adjusts for covariates related to Y or covariates related to (Y, D). The disease is assumed to be common (10% prevalence) and to follow a logistic model. In row A, covariate Z1 is assumed to be associated with G but not with D (γ1 = ln 1.7, βZ1 = 0). In row B, Z1 is associated with D but not with G (γ1 = 0, βZ1 = ln 1.7). In row C, Z1 is a confounder of the association between G and D (γ1 = βZ1 = ln 1.7).
Fig 2
Fig 2
Empirical bias for the estimated genetic effect α̂G on a continuous secondary trait, across null scenarios (αG = 0) with different combinations of βY, βG, γ1 and βZ1. Five methods (Analysis 2,4,6,8,9) are compared here. Each method takes either a control-only, adjusted, or IPW approach, and adjusts for covariates related to Y or covariates related to (Y, D). The disease is assumed to be common (10% prevalence) and to follow a logistic model (gD(·) = logit). In row A, covariate Z1 is assumed to be associated with G, but not with D (γ1 = ln 1.7, βZ1 = 0). In row B, Z1 is associated with D, but not with G (γ1 = 0, βZ1 = ln 1.7). In row C, Z1 is a confounder of the association between G and D (γ1 = βZ1 = ln 1.7).
Fig 3
Fig 3
Empirical type I error rates and bias for testing and estimating genetic associations with a continuous secondary trait, at genome-wide α = 10−6 level and across null scenarios (αG = 0) with different combinations of βY and link function gD(·) for the disease model. Five methods (Analysis 2,4,6,8,9) are compared here. Each method takes either a control-only, adjusted, or IPW approach, and adjusts for covariates related to Y or covariates related to (Y, D). The disease is assumed to be rare (1% prevalence) and to follow either a logistic or probit model (gD(·) = logit or Φ−1). G is assumed to be associated with D (βG = ln 1.7). Z1 is assumed to be a confounder of the association between G and D (γ1 = βZ1 = ln 1.7). The scenarios with a logistic disease model (left column) are the same as the scenarios in the bottom right plots of Figures 1 and 2, except here the disease is not common but rather rare.
Fig 4
Fig 4
Top 50k SNPs from IPW regression. Observed difference between case-only and control-only estimates has a significant tendency to increase as the log odds-ratio of a genetic marker and lung cancer increases (slope of best fit line = 1.02, p < 10−15). Under the assumption of a rare disease with a logistic model, one would expect the best fit line to be y = 0.
Fig 5
Fig 5
Number of nominally significant SNPs (p < 10−3) from the control-only, adjusted, and IPW analysis of pack-years. p values from a 1-DF Wald test assuming an additive genetic model.
Fig 6
Fig 6
p values from the genome-wide association analysis of pack-years and lung cancer risk for nominally significant SNPs (p < 10−3) from twelve selected genes: (1) ARHGAP24, (2) C1orf95, (3) CDH18, (4) CDYL2, (5) DOK6, (6) FAM189A1, (7) HSD17B2, (8) KSR1, (9) NBEA, (10) PDE10A, (11) SLC9A2, and (12) TACR1. All genes have been identified in previous studies of smoking cessation. Here, we compare the results from the control-only, adjusted, and IPW analyses of pack-years. Results can be distinguished by gene (number), SNP (letter), and the secondary analysis applied (shape and color).

References

    1. Amemiya T. Qualitative response models: a survey. J Econ Lit. 1981;19:1483–1536.
    1. He J, Li H, Edmondson AC, Rader DJ, Li M. A gaussian copula approach for the analysis of secondary phenotypes in casecontrol genetic association studies. Biostatistics. 2012;13:497–508. - PMC - PubMed
    1. Jiang Y, Scott AJ, Wild CJ. Secondary analysis of case-control data. Stat Med. 2006;25:1323–1339. - PubMed
    1. Kenny EE, Pe'er I, Karban A, Ozelius L, Mitchell AA, Ng SM, Erazo M, Ostrer H, Abraham C, Abreu MT, et al. A genome-wide scan of Ashkenazi Jewish Crohns Disease suggests novel susceptibility loci. PLoS Genet. 2012;8 - PMC - PubMed
    1. Lee SH, Wray NR, Goddard ME, Visscher PM. Estimating missing heritability for disease from geneome-wide association studies. Am J Hum Genet. 2011;88:294–305. - PMC - PubMed

Publication types

Substances

LinkOut - more resources