. 2016 Nov;22(8):647-657.
doi: 10.1177/1753425916668243. Epub 2016 Sep 26.

Regulation of the IL-10-driven macrophage phenotype under incoherent stimuli

Affiliations

Regulation of the IL-10-driven macrophage phenotype under incoherent stimuli

Yishan Chuang et al. Innate Immun. 2016 Nov.

Abstract

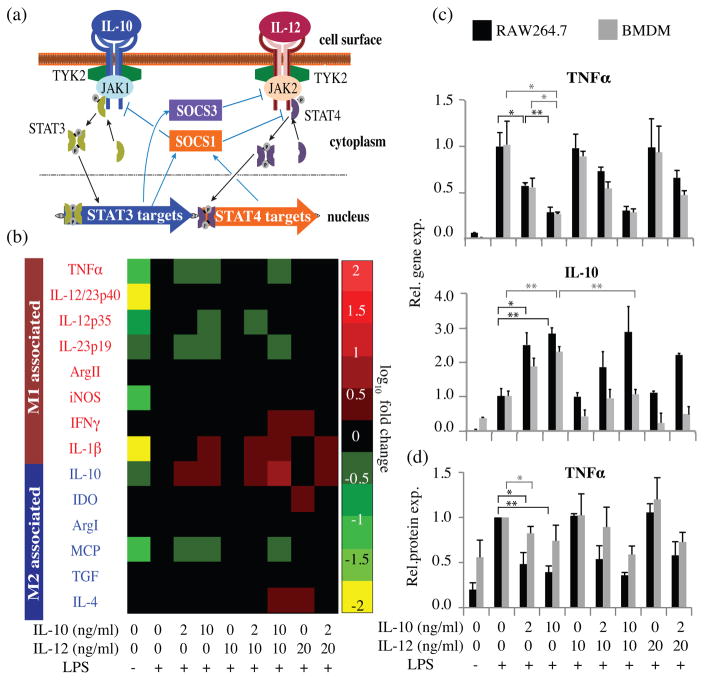
Macrophages are ubiquitous innate immune cells that play a central role in health and disease by adopting distinct phenotypes, which are broadly divided into classical inflammatory responses and alternative responses that promote immune suppression and wound healing. Although macrophages are attractive therapeutic targets, incomplete understanding of this functional choice limits clinical manipulation. While individual stimuli, pathways, and genes involved in macrophage functional responses have been identified, how macrophages evaluate complex in vivo milieus comprising multiple divergent stimuli remains poorly understood. Here, we used combinations of "incoherent" stimuli-those that individually promote distinct macrophage phenotypes-to elucidate how the immunosuppressive, IL-10-driven macrophage phenotype is induced, maintained, and modulated under such combinatorial stimuli. The IL-10-induced immunosuppressive phenotype was largely insensitive to co-administered IL-12, which has been reported to modulate macrophage phenotype, but maintaining the immunosuppressive phenotype required sustained exposure to IL-10. Our data implicate the intracellular protein, BCL3, as a key mediator of the IL-10-driven phenotype. Notably, co-administration of IFN-γ disrupted an IL-10-mediated positive feedback loop that may reinforce the immunosuppressive phenotype. This novel combinatorial perturbation approach thus generated new insights into macrophage decision making and local immune network function.

Keywords: Interleukin-10 (IL-10); macrophage polarization; macrophages; tumor-associated macrophages (TAM).


Figures

Figure 1
Figure 1. Dose dependent responses to incoherent stimuli IL-10 and IL-12
(a) Conceptual model of potential motifs of cross-talk and competition in the IL-10/IL-12 signaling network in macrophages. (b) RAW cells were treated with combinations of IL-10 and IL-12 for 12 h, activated with LPS for 3 h, and profiled by qPCR. Red text: genes typically annotated as M1, blue text: genes typically annotated as M2. Heat map colors indicate up-regulation or down-regulation vs. the LPS-only control as per the scale bar. All data, including non-responsive genes not shown here, are shown with error bars in Figure S3. (c) Comparative gene expression responses of RAW cells and BMDM to IL-10/IL-12 competition. Error bars represent +/−1 standard deviation, from biological triplicates. (d) Comparative intracellular TNFα protein expression by RAW cells and BMDM following IL-10/IL-12 competition, quantified by flow cytometry. Error bars represent +/−1 standard deviation, from three independent experiments. For additional statistical analysis of panels C–D, see Figure S4. (*p ≤ 0.05, **p ≤ 0.01, ***p ≤ 0.001)
Figure 2
Figure 2. Potential regulation of IL-10-dominated polarization
(a) SOCS1 and SOCS3 gene expression in response to 12 h of IL-10 and IL-12 treatment (+/− subsequent activation by LPS for 3 h). Experiments in panel (a) were conducted in biological triplicate in RAW cells; the left panel was normalized to the LPS-only control, and the right panel was normalized to the “no treatment” control. (b) SOCS1 and SOCS3 protein expression in response to IL-10/IL-12 treatment followed by 3 h activation with LPS (c) pSTAT4 protein expression post IL-12 exposure (d, e) pSTAT4 and SOCS3 protein expression after IL-10/IL-12 treatment (f) SOCS3 gene expression following IL-10/IL-12 treatment. Experiments in panel (f) were conducted in biological triplicate in RAW cells and normalized to the “no treatment” control. (g) RAW cells were treated with IL-10 and IL-12 for 15 h (+/− activation with LPS for the final 3 h) and harvested for qPCR analysis. Each data series was normalized to its own “no cytokine” control. For additional statistical analysis, see Figure S6. (*p ≤ 0.05, **p ≤ 0.01, ***p ≤ 0.001)
Figure 3
Figure 3. Maintenance of macrophage phenotype via sustained IL-10 exposure
(a) RAW cells (black) and BMDM (grey) were exposed to the various sequential treatment conditions described in the schematic at left. Cells were harvested 3 h after LPS activation for qPCR analysis. Error bars represent +/−1 standard deviation, from biological triplicates. (MC: Media change, *p ≤ 0.05, **p ≤ 0.01, ***p ≤ 0.001) (b) BCL3 gene expression was measured at various time points after IL-10 removal. Data were normalized to a no treatment control, shown by a grey bar spanning +/−1 standard deviation, from biological triplicates. (*p ≤ 0.05, **p ≤ 0.01, ***p ≤ 0.001)
Figure 4
Figure 4. Macrophage polarization in response to incoherent stimuli IL-10 and IFNγ
(a) RAW cells were treated with combinations of IL-10 and IFNγ for 12 h, activated with LPS for 3 h, and profiled by qPCR. Heat map is formatted as in Figure 1, and all data, including non-responsive genes not shown here, are reported with error bars in Figure S8. (b) Comparative gene expression for RAW cells and BMDM treated as in (a). Error bars represent +/−1 standard deviation, from biological triplicates. For additional statistical analyses, see Figure S9. (*p ≤ 0.05, **p ≤ 0.01, ***p ≤ 0.001)
Figure 5
Figure 5. Evaluating upstream regulation of the competition between incoherent stimuli IL-10 and IFNγ
(a) SOCS1 gene expression after 12 hours treatment with IL-10 and IFNγ followed by 3 hours of activation with LPS. Experiments were conduced in biological triplicate in RAW cells and normalized to the LPS only control. (b) SOCS1 protein expression and STAT3 phosphorylation following treatment with IL-10 and IFNγ without LPS activation.
Figure 6
Figure 6. Resolution of incoherent stimuli by multiscale networks
(a) Proposed multicellular network model by which IL-12 may indirectly promote an M1-like phenotype. (b) Proposed core intracellular regulatory network mediating resolution of IL-10/IFN γ-induced signaling. Dotted lines indicate potential mechanisms requiring further investigation (see Fig. S10 for additional detail).

References

    1. Mantovani A, Sica A, Sozzani S, Allavena P, Vecchi A, Locati M. The chemokine system in diverse forms of macrophage activation and polarization. Trends Immunol. 2004;25:677–86. - PubMed
    1. Porta C, Rimoldi M, Raes G, et al. Tolerance and M2 (alternative) macrophage polarization are related processes orchestrated by p50 nuclear factor kappaB. Proc Natl Acad Sci USA. 2009;106:14978–83. - PMC - PubMed
    1. Sica A, Larghi P, Mancino A, et al. Macrophage polarization in tumour progression. Semin Cancer Biol. 2008;18:349–55. - PubMed
    1. Lawrence T, Natoli G. Transcriptional regulation of macrophage polarization: enabling diversity with identity. Nat Rev Immunol. 2011;11:750–61. - PubMed
    1. Mosser DM, Edwards JP. Exploring the full spectrum of macrophage activation. Nat Rev Immunol. 2008;8:958–69. - PMC - PubMed

LinkOut - more resources