

Retrospective forecasting of the 2010-2014 Melbourne influenza seasons using multiple surveillance systems
- PMID: 27671159
- PMCID: PMC9507331
- DOI: 10.1017/S0950268816002053
Retrospective forecasting of the 2010-2014 Melbourne influenza seasons using multiple surveillance systems
Abstract
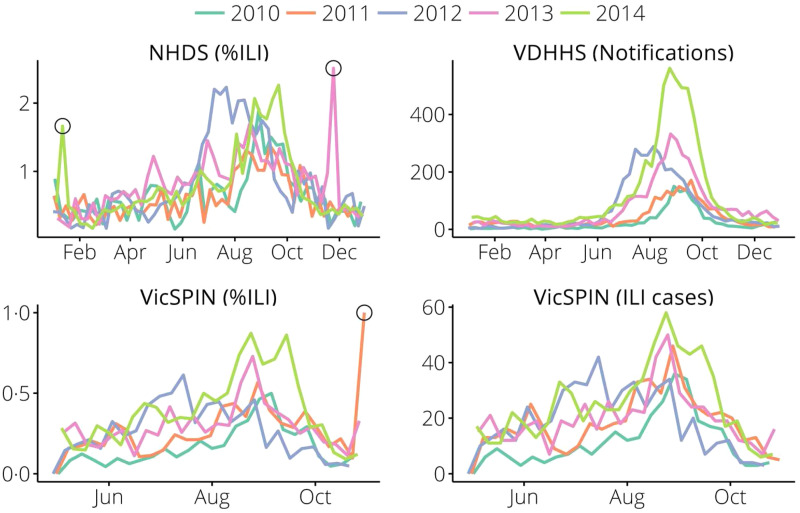
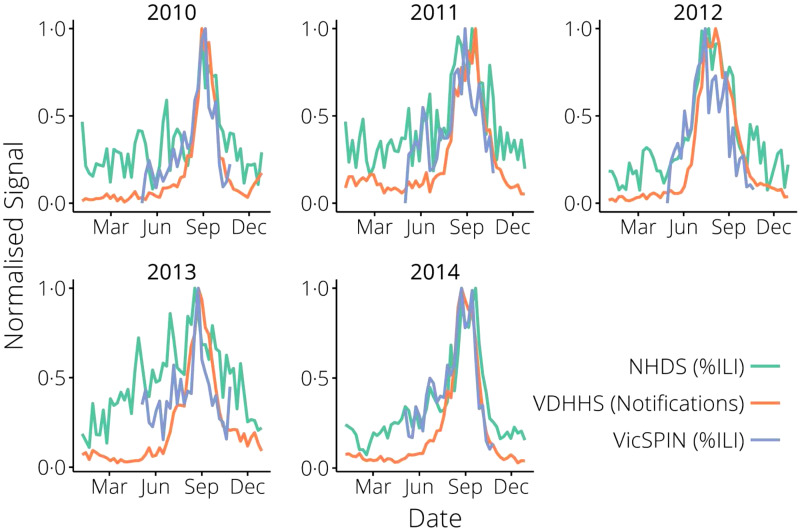
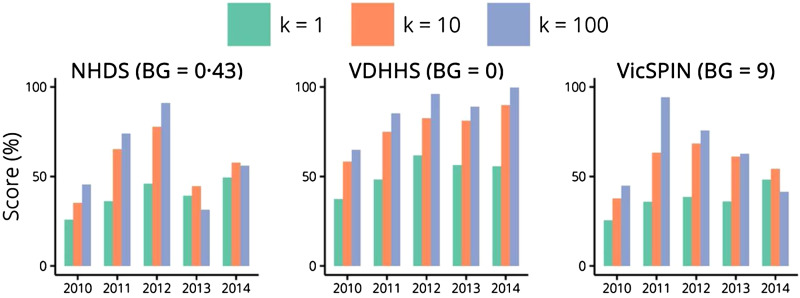
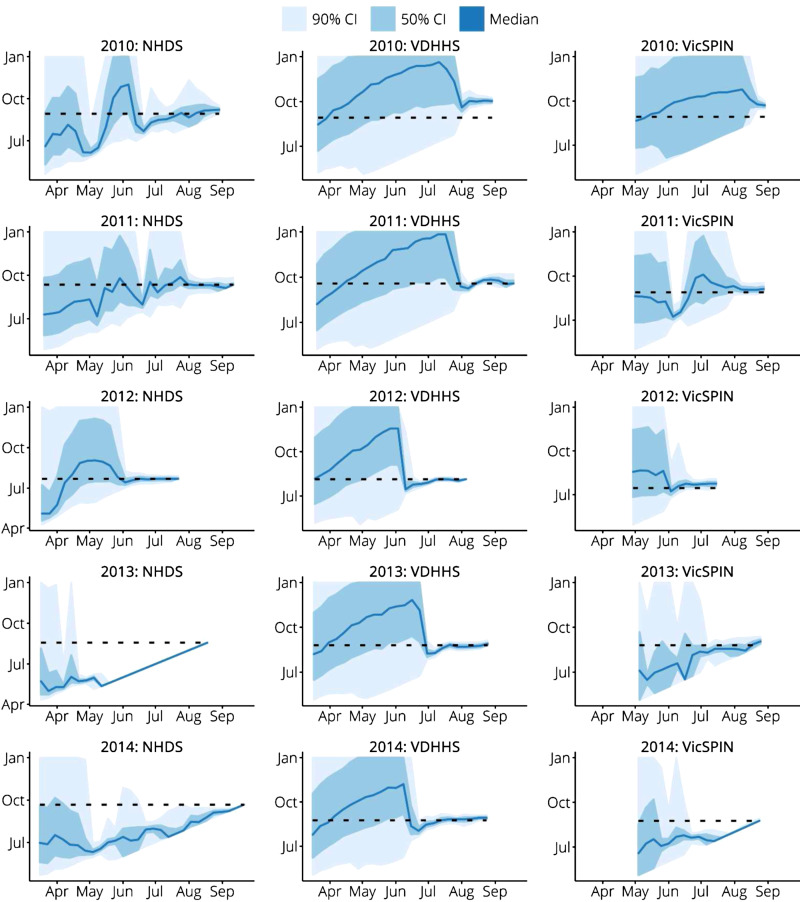
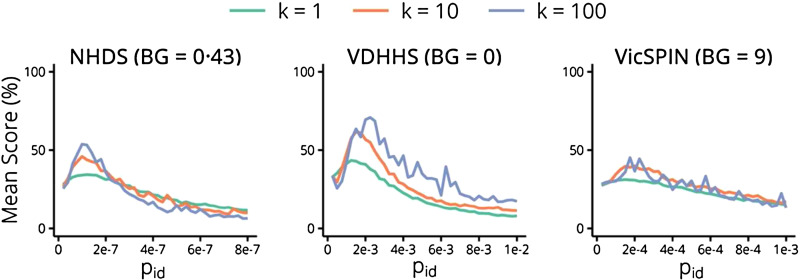
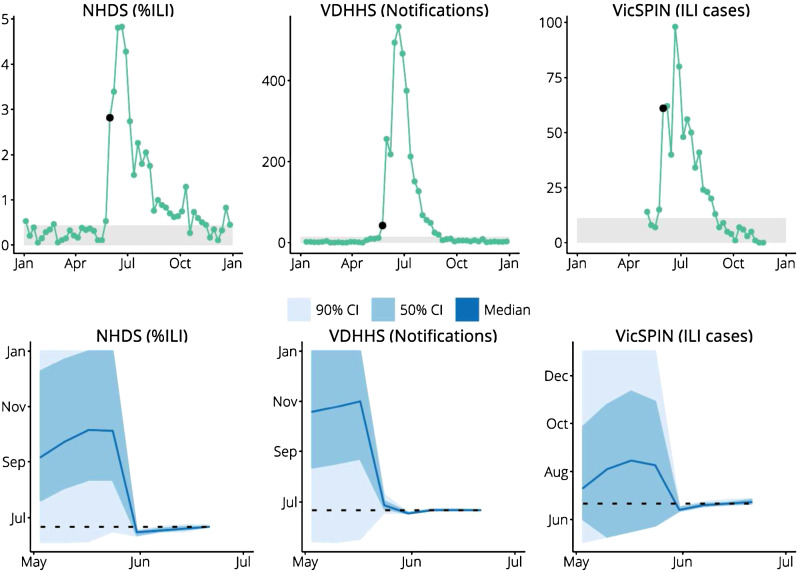
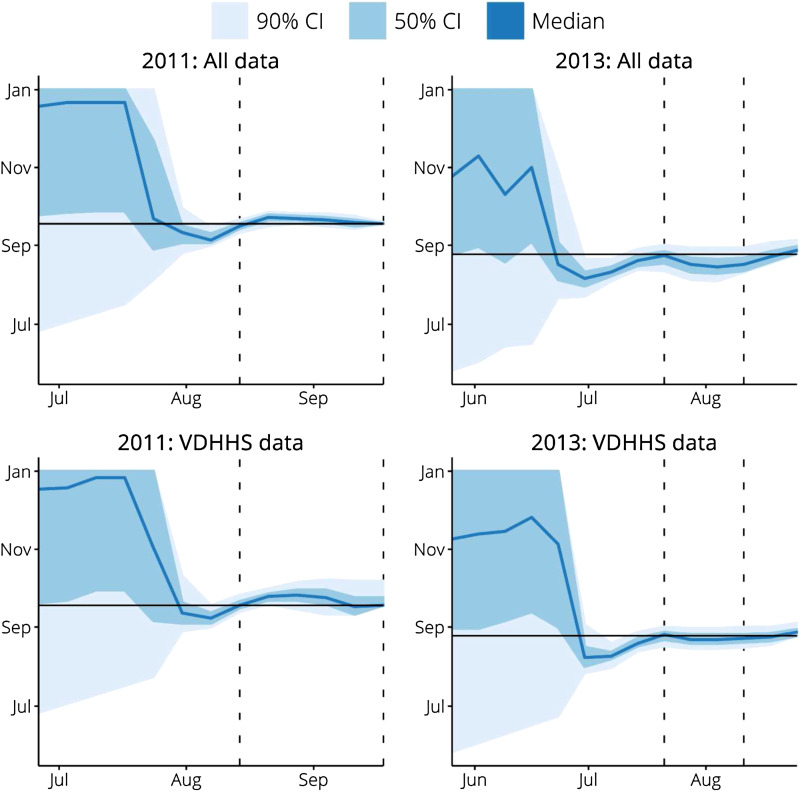
Accurate forecasting of seasonal influenza epidemics is of great concern to healthcare providers in temperate climates, since these epidemics vary substantially in their size, timing and duration from year to year, making it a challenge to deliver timely and proportionate responses. Previous studies have shown that Bayesian estimation techniques can accurately predict when an influenza epidemic will peak many weeks in advance, and we have previously tailored these methods for metropolitan Melbourne (Australia) and Google Flu Trends data. Here we extend these methods to clinical observation and laboratory-confirmation data for Melbourne, on the grounds that these data sources provide more accurate characterizations of influenza activity. We show that from each of these data sources we can accurately predict the timing of the epidemic peak 4-6 weeks in advance. We also show that making simultaneous use of multiple surveillance systems to improve forecast skill remains a fundamental challenge. Disparate systems provide complementary characterizations of disease activity, which may or may not be comparable, and it is unclear how a 'ground truth' for evaluating forecasts against these multiple characterizations might be defined. These findings are a significant step towards making optimal use of routine surveillance data for outbreak forecasting.
Keywords: Bayesian prediction; epidemic; forecasting; influenza.
Conflict of interest statement
None.
Figures
Similar articles
-
Forecasting influenza outbreak dynamics in Melbourne from Internet search query surveillance data.Influenza Other Respir Viruses. 2016 Jul;10(4):314-23. doi: 10.1111/irv.12376. Epub 2016 Mar 7. Influenza Other Respir Viruses. 2016. PMID: 26859411 Free PMC article.
-
Epidemic forecasts as a tool for public health: interpretation and (re)calibration.Aust N Z J Public Health. 2018 Feb;42(1):69-76. doi: 10.1111/1753-6405.12750. Epub 2017 Dec 27. Aust N Z J Public Health. 2018. PMID: 29281169
-
Multiscale influenza forecasting.Nat Commun. 2021 May 20;12(1):2991. doi: 10.1038/s41467-021-23234-5. Nat Commun. 2021. PMID: 34016992 Free PMC article.
-
Global patterns in monthly activity of influenza virus, respiratory syncytial virus, parainfluenza virus, and metapneumovirus: a systematic analysis.Lancet Glob Health. 2019 Aug;7(8):e1031-e1045. doi: 10.1016/S2214-109X(19)30264-5. Lancet Glob Health. 2019. PMID: 31303294
-
Epidemic Forecasting is Messier Than Weather Forecasting: The Role of Human Behavior and Internet Data Streams in Epidemic Forecast.J Infect Dis. 2016 Dec 1;214(suppl_4):S404-S408. doi: 10.1093/infdis/jiw375. J Infect Dis. 2016. PMID: 28830111 Free PMC article. Review.
Cited by
-
Development and validation of influenza forecasting for 64 temperate and tropical countries.PLoS Comput Biol. 2019 Feb 27;15(2):e1006742. doi: 10.1371/journal.pcbi.1006742. eCollection 2019 Feb. PLoS Comput Biol. 2019. PMID: 30811396 Free PMC article.
-
A Framework for Evaluating the Use of Surveillance Systems for Short-Term Influenza Forecasting.Influenza Other Respir Viruses. 2025 Aug;19(8):e70144. doi: 10.1111/irv.70144. Influenza Other Respir Viruses. 2025. PMID: 40730485 Free PMC article.
-
Jointly estimating epidemiological dynamics of Covid-19 from case and wastewater data in Aotearoa New Zealand.Commun Med (Lond). 2024 Jul 15;4(1):143. doi: 10.1038/s43856-024-00570-3. Commun Med (Lond). 2024. PMID: 39009723 Free PMC article.
-
Forecasting national and regional influenza-like illness for the USA.PLoS Comput Biol. 2019 May 23;15(5):e1007013. doi: 10.1371/journal.pcbi.1007013. eCollection 2019 May. PLoS Comput Biol. 2019. PMID: 31120881 Free PMC article.
-
Accurate influenza forecasts using type-specific incidence data for small geographic units.PLoS Comput Biol. 2021 Jul 29;17(7):e1009230. doi: 10.1371/journal.pcbi.1009230. eCollection 2021 Jul. PLoS Comput Biol. 2021. PMID: 34324487 Free PMC article.
References
-
- Lazer D, et al. The parable of Google Flu: traps in big data analysis. Science 2014; 343: 1203–1205. - PubMed
Publication types
MeSH terms
LinkOut - more resources
Full Text Sources
Other Literature Sources
Medical
