. 2017 May:115:98-111.
doi: 10.1016/j.ijpsycho.2016.09.010. Epub 2016 Sep 23.

Genome-wide association study of working memory brain activation

Affiliations

Genome-wide association study of working memory brain activation

Gabriëlla A M Blokland et al. Int J Psychophysiol. 2017 May.

Abstract

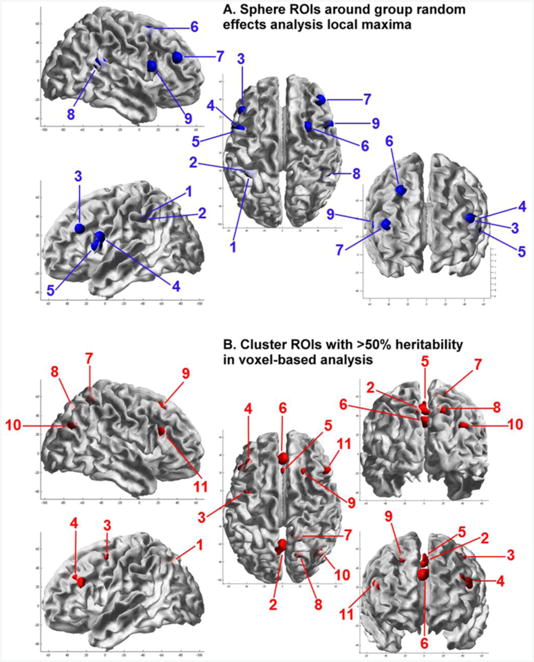
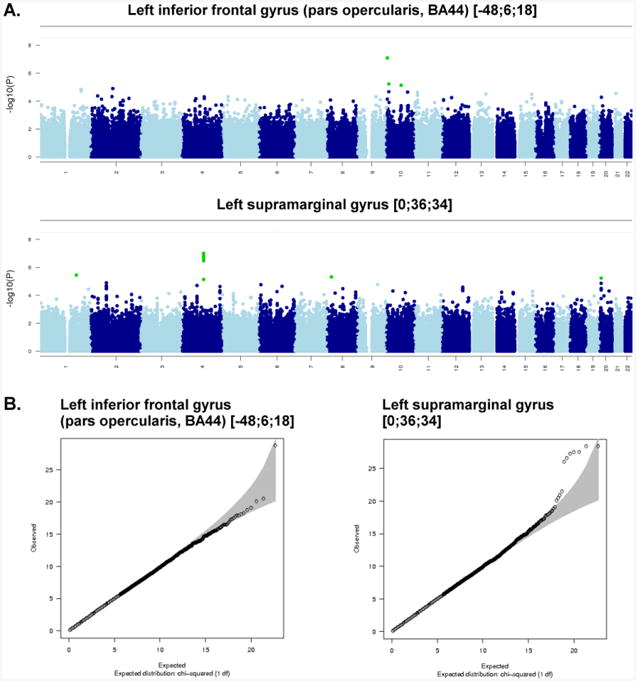
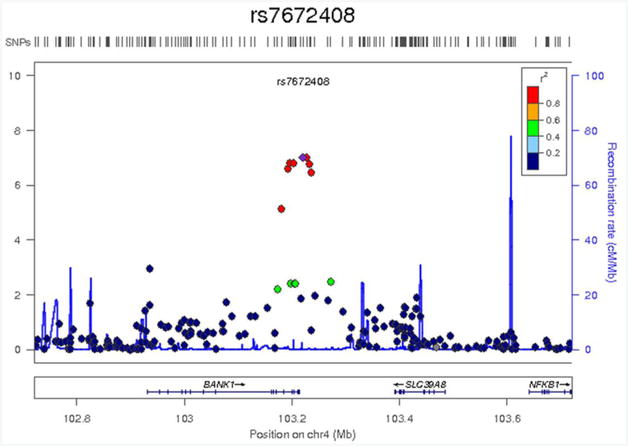
In a population-based genome-wide association (GWA) study of n-back working memory task-related brain activation, we extracted the average percent BOLD signal change (2-back minus 0-back) from 46 regions-of-interest (ROIs) in functional MRI scans from 863 healthy twins and siblings. ROIs were obtained by creating spheres around group random effects analysis local maxima, and by thresholding a voxel-based heritability map of working memory brain activation at 50%. Quality control for test-retest reliability and heritability of ROI measures yielded 20 reliable (r>0.7) and heritable (h2>20%) ROIs. For GWA analysis, the cohort was divided into a discovery (n=679) and replication (n=97) sample. No variants survived the stringent multiple-testing-corrected genome-wide significance threshold (p<4.5×10⁻⁹), or were replicated (p<0.0016), but several genes were identified that are worthy of further investigation. A search of 529,379 genomic markers resulted in discovery of 31 independent single nucleotide polymorphisms (SNPs) associated with BOLD signal change at a discovery level of p<1×10⁻⁵. Two SNPs (rs7917410 and rs7672408) were associated at a significance level of p<1×10⁻⁷. Only one, most strongly affecting BOLD signal change in the left supramarginal gyrus (R2=5.5%), had multiple SNPs associated at p<1×10⁻⁵ in linkage disequilibrium with it, all located in and around the BANK1 gene. BANK1 encodes a B-cell-specific scaffold protein and has been shown to negatively regulate CD40-mediated AKT activation. AKT is part of the dopamine-signaling pathway, suggesting a mechanism for the involvement of BANK1 in the BOLD response to working memory. Variants identified here may be relevant to (the susceptibility to) common disorders affecting brain function.

Keywords: BOLD signal; Functional MRI; Genome-wide association study; Region-of-interest; Working memory; n-back.


Figures

Figure 1
Figure 1
Localisation of (A) spherical regions of interest around group random effects analysis local maxima, and (B) cluster regions of interest with >50% heritability in voxel-based analysis. ROIs are displayed on the pial surface of the MNI template using the SRender Toolbox for SPM8, authored by John Ashburner. (A) Sphere ROIs: 1 = L IPL [−33; −45; 39]; 2 = L IPL [−39; −42; 39]; 3 = L IFG (PTr) [−45; 27; 27]; 4 = L IFG (POp; BA 44) [−48; 6; 18]; 5 = L IFG (POp) [−51; 9; 9]; 6 = R MFG [27; 9; 51]; 7 = R MFG [42; 39; 24]; 8 = R IPL [48; −42; 18]; 9 = R IFG (POp; BA 44) [51; 12; 15]. (B) Cluster ROIs: 1 = L SOG [−22; −67; 36]; 2 = L PCUN [−2; −64; 46]; 3 = L PCG [−40; −2; 52]; 4 = L IFG (PTr) [−43; 27; 26]; 5 = L SMA [0; 23; 51]; 6 = L SMG [0; 36; 34]; 7 = R PCUN [15; −51; 58]; 8 = R PCUN [19; −70; 46]; 9 = R SFG [22; 23; 50]; 10 = R IPL / MOG [42; −70; 30]; 11 = R IFG (PTr; BA 45) [48; 23; 22]. ROI abbreviations: AG, angular gyrus; BA, Brodmann area; IFG, inferior frontal gyrus; IPL, inferior parietal lobule; L, left; MFG, middle frontal gyrus; MNI, Montréal Neurological Institute; MOG, middle occipital gyrus; MTG, middle temporal gyrus; PCG, precentral gyrus; PCUN, precuneus; POp, pars opercularis; PTr, pars triangularis; R, right; SFG, superior frontal gyrus; SMA, supplementary motor area; SMG, superior medial gyrus; SOG, superior occipital gyrus; SPL, superior parietal lobule.
Figure 2
Figure 2
Manhattan plots (A) and Quantile-Quantile (Q-Q) plots (B) for the two region of interest BOLD measures with the strongest SNP associations: Left Inferior Frontal Gyrus (Pars Opercularis; BA 44) [−48; 6; 18], and Left Supramarginal Gyrus [0; 36; 34]. (A) Each point in the Manhattan plot is a SNP laid out across the human chromosomes from left to right, and the heights correspond to the strength of the association to working memory task-related cortical activation. The horizontal line on the Manhattan plots shows the genome-wide significance level, which has been corrected from the generic GWAS significance level (p<7.2×10⁻⁸) by estimating the number of independent variables in the data (Li and Ji, 2005; Nyholt, 2004). We estimated that the required significance level to account for multiple testing was p<1.9×10⁻⁹. (B) The Q-Q plot is used to assess the number and magnitude of observed associations compared with the expectations under no association. The nature of deviations from the identity line provide clues whether the observed associations are true associations or may be due to for example population stratification or cryptic relatedness.
Figure 3
Figure 3
Detailed view of the locus showing suggestive association (p = 9.9×10⁻⁸) with average BOLD percent signal change in the left supramarginal gyrus [0; 36; 34]. Genetic markers are represented as circles. Markers are placed at their position on chromosome 4 (x-axis) and graphed based on the −log10(p-values) of their association to the phenotype (y-axis). The level of linkage disequilibrium to the most associated SNP (rs7672408) is represented in colour using the CEU panel from HapMap Phase II. The location of genes is shown below the plots. Images were created using LocusZoom (http://csg.sph.umich.edu/locuszoom/).

Similar articles

Cited by

References

    1. Abecasis GR, Cherny SS, Cookson WO, Cardon LR. Merlin--rapid analysis of dense genetic maps using sparse gene flow trees. Nat Genet. 2002;30:97–101. - PubMed
    1. Aiba Y, Yamazaki T, Okada T, Gotoh K, Sanjo H, Ogata M, Kurosaki T. BANK negatively regulates Akt activation and subsequent B cell responses. Immunity. 2006;24:259–268. - PubMed
    1. Alimohamad H, Rajakumar N, Seah YH, Rushlow W. Antipsychotics alter the protein expression levels of beta-catenin and GSK-3 in the rat medial prefrontal cortex and striatum. Biol Psychiatry. 2005;57:533–542. - PubMed
    1. Annett M. A classification of hand preference by association analysis. Br J Psychol. 1970;61:303–321. - PubMed
    1. Arguello PA, Gogos JA. A signaling pathway AKTing up in schizophrenia. J Clin Invest. 2008;118:2018–2021. - PMC - PubMed

Publication types

MeSH terms

LinkOut - more resources