. 2016 Oct 18;113(42):11670-11675.
doi: 10.1073/pnas.1602311113. Epub 2016 Sep 26.

Multiplicity of morphologies in poly (l-lactide) bioresorbable vascular scaffolds

Affiliations

Multiplicity of morphologies in poly (l-lactide) bioresorbable vascular scaffolds

Artemis Ailianou et al. Proc Natl Acad Sci U S A. .

Abstract

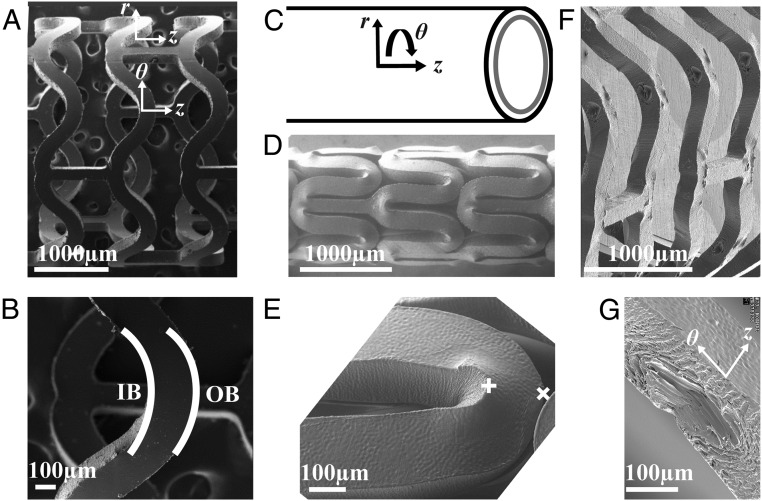
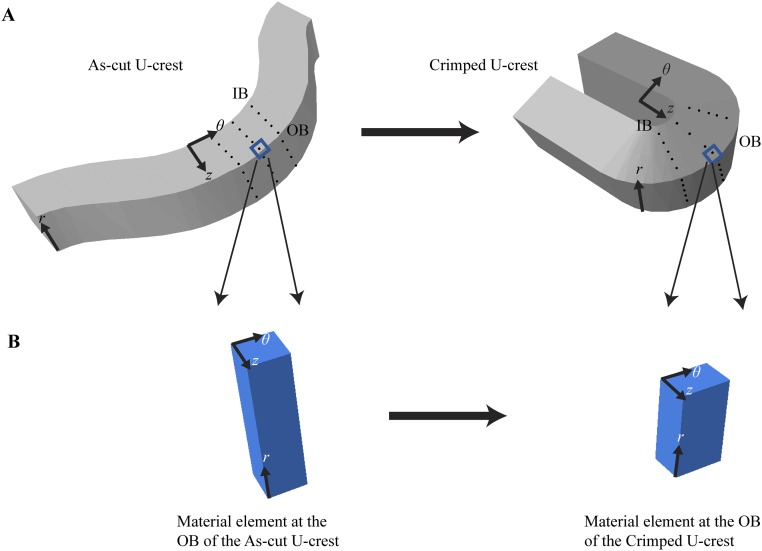
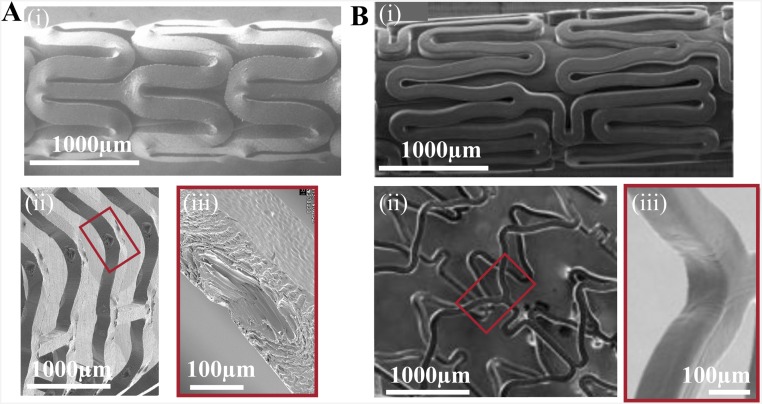
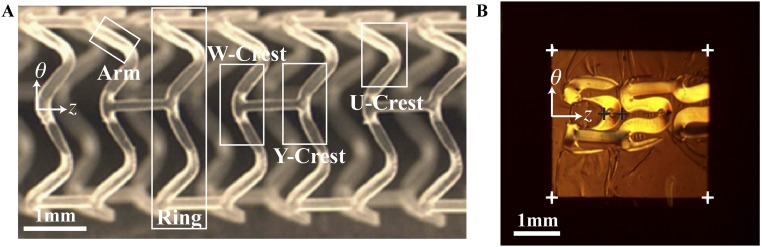
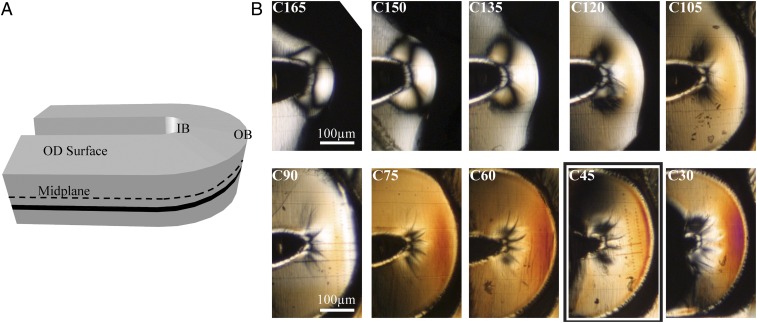
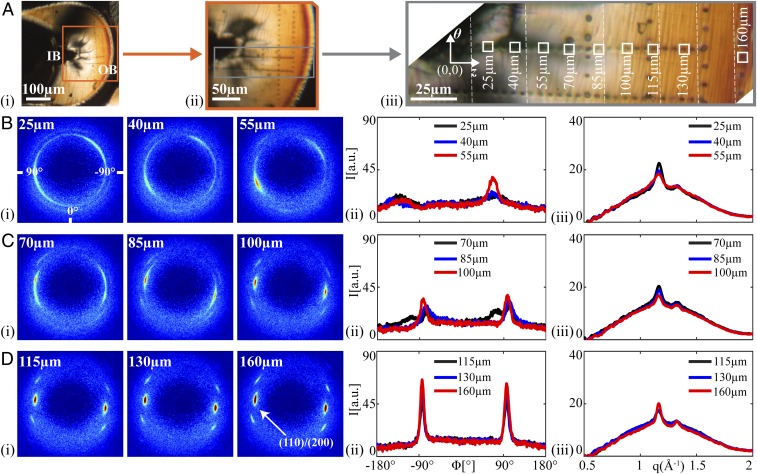
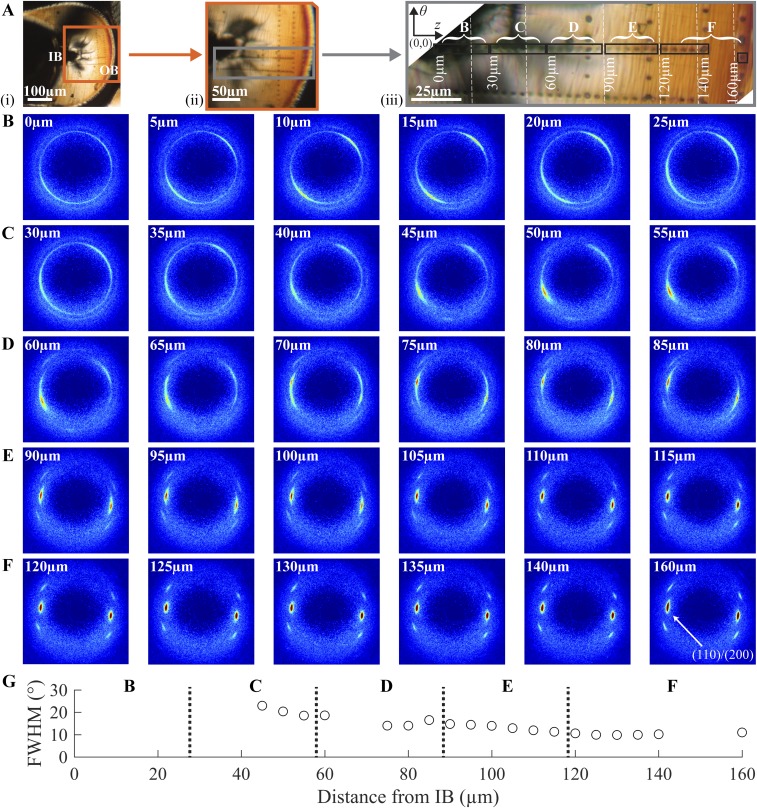
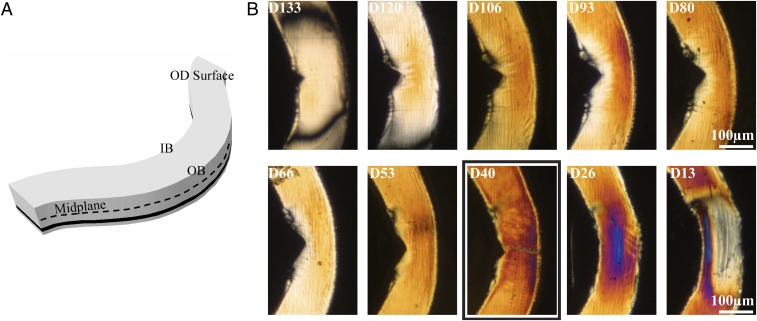
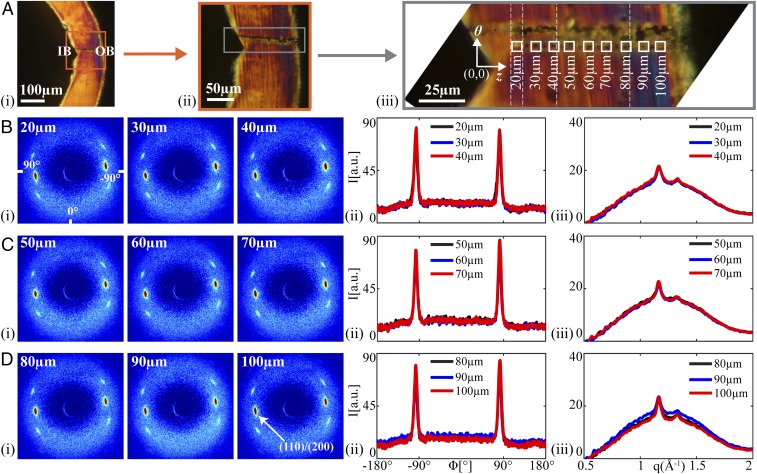
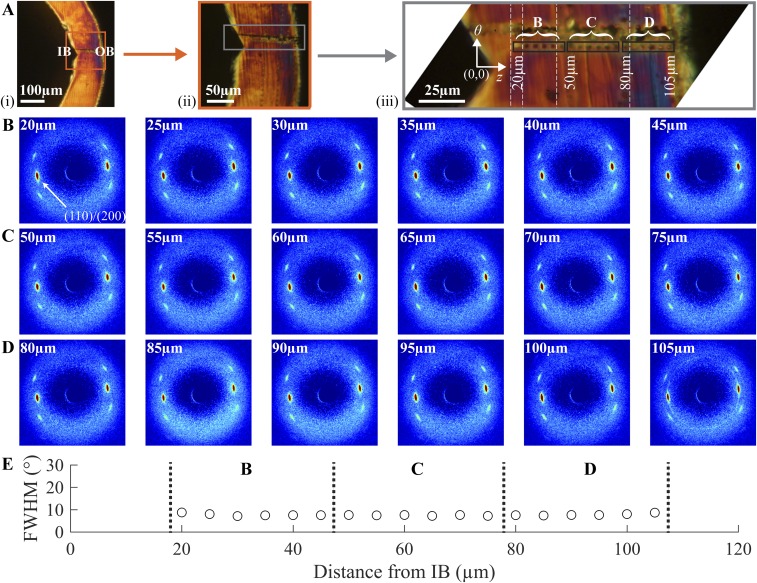
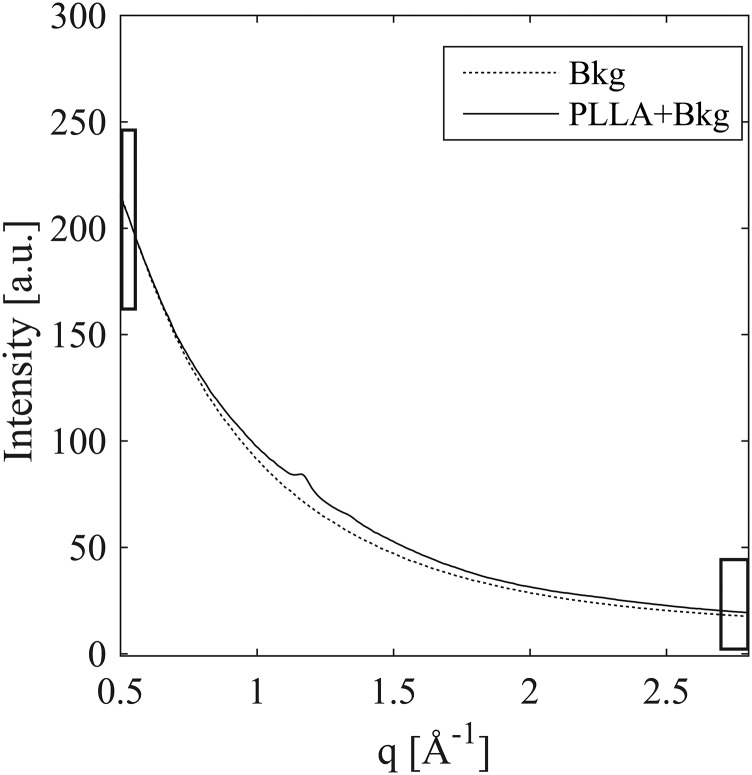
Poly(l-lactide) (PLLA) is the structural material of the first clinically approved bioresorbable vascular scaffold (BVS), a promising alternative to permanent metal stents for treatment of coronary heart disease. BVSs are transient implants that support the occluded artery for 6 mo and are completely resorbed in 2 y. Clinical trials of BVSs report restoration of arterial vasomotion and elimination of serious complications such as late stent thrombosis. It is remarkable that a scaffold made from PLLA, known as a brittle polymer, does not fracture when crimped onto a balloon catheter or during deployment in the artery. We used X-ray microdiffraction to discover how PLLA acquired ductile character and found that the crimping process creates localized regions of extreme anisotropy; PLLA chains in the scaffold change orientation from the hoop direction to the radial direction on micrometer-scale distances. This multiplicity of morphologies in the crimped scaffold works in tandem to enable a low-stress response during deployment, which avoids fracture of the PLLA hoops and leaves them with the strength needed to support the artery. Thus, the transformations of the semicrystalline PLLA microstructure during crimping explain the unexpected strength and ductility of the current BVS and point the way to thinner resorbable scaffolds in the future.

Keywords: coronary heart disease; ductility; microdiffraction; poly (l-lactide); structural transformation.


Conflict of interest statement

M.B.K. and J.P.O. are employees of Abbott Vascular. Funding for this research was provided by Abbott Vascular.

Figures

Fig. 1.
Fig. 1.
SEMs of the subassemblies (as-cut, crimped, and deployed) of a PLLA vascular scaffold. The expanded tube is laser-cut to create an (A) as-cut scaffold. (B) The U crest of an as-cut scaffold indicating the IB and OB. (C) Cylindrical coordinate system for the scaffold. (D) Crimped scaffold. (E) A U crest of a crimped scaffold in D. (F) Deployed scaffold. (G) Diamond-shaped voids present in a deployed U crest.
Fig. S1.
Fig. S1.
Estimating the strain field created during crimping. (A) Visualizing the strain field with an array of material points (black dots). (Left) As-cut U crest. (Right) Crimped U crest. (B) Estimating the elongation at the OB along the θ direction. (Left) An infinitesimally small volume element at the OB of the as-cut scaffold. (Right) The same volume element in the crimped state, here illustrated with the z dimension unchanged and showing that the r dimension decreases by 33% during crimping (based on unpublished SEM images).
Fig. S2.
Fig. S2.
Mechanical properties of expanded tubes (AD) and deployed scaffolds (EH) for groups given in Table S1. Apparent crystallinity (A) inferred from DSC thermograms (n = 15). Ultimate stress at fracture (B) and the elongation at break (C) for notched dog bone specimens laser-cut with long axis of the dog bone oriented along the hoop direction of the expanded tube (n = 15). Elongation at break (D) for notched dog bone specimens laser-cut with long axis of the dog bone oriented along the axial direction of the expanded tube (n = 15). Crimped scaffolds made from expanded tubes using identical laser-cutting and crimping conditions were tested to failure upon deployment. The radial strength (E) of scaffolds deployed to 3.5-mm diameter (n = 5) is measured under a compressive radial load that is increased until fracture occurs (MSI RX650 Radial Force Testing Instrument). Scaffolds were deliberately overdilated to evaluate the deployed diameter at fracture (F, n = 5). For specimens that survive to a deployed diameter greater than that of the expanded tube (3.5 mm), the number of cracks (G) and diamond-shaped voids (H) are presented (n = 5, except for group 5, for which only one scaffold survived to 3.5-mm diameter, so 40 represents a lower bound on cracks/scaffold). In addition to coauthors M.B.K. and J.P.O., the following Abbott technologists contributed to these experiments: Thierry Glauser, Vincent Gueriguian, Bethany Steichen, Manish Gada, and Lothar Kleiner. Figure adapted from ref. .
Fig. S3.
Fig. S3.
Influence of material properties on the crimped and deployed state of vascular implants. Scanning electron microscopy is used to compare a 150-µm PLLA scaffold (A) and an 80-µm cobalt–chromium (B) permanent stent (45, 46). The PLLA scaffold and Co–Cr stent are crimped (A and B, i) onto a balloon catheter and deployed (A and B, ii) to an outer diameter of 3.5 mm. The inner bends of deployed struts (A and B, iii) indicate that diamond-shaped voids are specific to PLLA scaffolds. [Fig. S3B, i–ii is reprinted with permission from ref. , and Fig. S3B, iii is reprinted with permission from ref. .]
Fig. S4.
Fig. S4.
Definition of terms and illustration of the part of the sample that was embedded in preparation for microtoming sections. (A) The scaffold is laser-cut to remove most of the material of the expanded PLLA tube, leaving the rings and struts that make up the scaffold. We chose to examine U crests because they capture the intense, local deformation that occurs during crimping (whereas the arms mainly reorient without deforming and struts neither reorient nor deform). The outline (34) indicates the typical size and orientation of the embedded specimen from which sections were cut. Fig. S4A reprinted with permission from ref. . (B) A section cut from a crimped scaffold (specifically C45; Figs. 2B and 3).
Fig. 2.
Fig. 2.
Variation in birefringence through the thickness of a crimped PLLA vascular scaffold. (A) Schematic of a U crest (Fig. 1E) indicating the OD surface, the midplane (black dotted line), and the position of a particular section (black band). (B) Cropped polarized light micrographs of sequential 15-μm-thick microtomed sections from the OD to the ID of a crimped U crest. Sections are labeled with C to denote “crimped” and the approximate distance in microns from the inner diameter of the scaffold (i.e., C30 was closest to the scaffold’s ID, and C165 was closest to its OD). A bold rectangle indicates the section analyzed in Fig. 3.
Fig. 3.
Fig. 3.
Structural characterization of a crimped U section (C45, bold rectangle in Fig. 2B). (A) Polarized light micrographs of C45 with increasing magnification from A, i, to provide context relative to the IB and OB, to (A, iii) a composite image (vertical dotted lines mark transitions between images) that shows positions of microdiffraction acquisitions (marked using the X-ray beam). Squares correspond to patterns shown in BD. Microdiffraction data acquired (B) close to the IB, (C) midway between the IB and OB, and (D) close to the OB: (BD, i) X-ray microdiffraction patterns, (BD, ii) azimuthal intensity distribution I(ϕ) at the (110)/(200) diffraction (identified in D, i, azimuthal coordinates in (B, i, averaged over q ∈ 1.08–1.24 Å−1), and (BD, iii) radial intensity distribution I(q) (azimuthally averaged).
Fig. S5.
Fig. S5.
Variation in morphology from the inner bend (IB) to the outer bend (OB) of the C45 crimped U section. (A) Polarized light images of the C45 crimped section (higher magnification image comprises multiple images stitched together at vertical white dashed lines). (BF) Diffraction patterns acquired at the positions of the corresponding burn marks in A. The (110)/(200) peaks are indicated in F (160 μm). (G) The azimuthal full width at half maximum (FWHM) for the (110)/(200) peaks of the diffraction patterns serves as a measure of the strength of orientation of the crystallites. Note that values are not given for patterns acquired near the IB, where the polymer chains tilt out of plane and the azimuthal spread becomes increasingly broad (B and C), making it difficult to identify distinct peaks.
Fig. 4.
Fig. 4.
Variation in birefringence through the thickness of a deployed PLLA vascular scaffold. (A) Schematic of a U crest (Fig. 1G) indicating the OD surface, the midplane (black dotted line), and the position of a particular section (black band). (B) Cropped polarized light micrographs of sequential 15-μm-thick microtomed sections from the OD to the ID of a deployed U crest. Sections are labeled with D to denote “deployed” and the approximate distance in microns from the inner diameter of the scaffold (i.e., D13 was closest to the ID of the scaffold, and D133 was closest to its OD). A bold rectangle indicates the section analyzed in Fig. 5.
Fig. 5.
Fig. 5.
Structural characterization of a deployed U section (D40; bold rectangle in Fig. 4B). (A) Polarized light micrographs of D40 with increasing magnification from A, i, to provide context relative to the IB and OB, to (A, iii) a composite image (vertical dotted lines mark transitions between images) that shows positions of microdiffraction acquisitions (marked using the X-ray beam). Squares correspond to patterns shown in BD. Microdiffraction data acquired (B) close to the IB, (C) midway between the IB and OB, and (D) close to the OB: (i) X-ray microdiffraction patterns, (ii) azimuthal intensity distribution I(ϕ) at the (110)/(200) diffraction (identified in D, i, azimuthal coordinates in B, i, averaged over q ∈ 1.08–1.24 Å−1), and (iii) radial intensity distribution I(q) (azimuthally averaged).
Fig. S6.
Fig. S6.
Variation in morphology from the inner bend (IB) to the outer bend (OB) of the D40 deployed U section. (A) Polarized light images of the D40 deployed section (higher magnification image comprises multiple images stitched together at vertical white dashed lines). (BD) Diffraction patterns acquired at the positions of the corresponding burn marks in A. The (110)/(200) peaks are indicated in B (20μm). (E) The azimuthal FWHM for the (110)/(200) peaks of the diffraction patterns serves as a measure of the strength of orientation of the crystallites.
Fig. S7.
Fig. S7.
Background scattering (dashed) compared with background plus a 15-μm-thick section of poly(l-lactide) (solid). The background and the sample scattering were acquired within 7 min of each other using a 30-s acquisition. The greatest difference between the two is at the (110)/(200) diffraction peak (less than 10%), and the PLLA contribution is negligible at both low-q (0.5 < q <0.55 Å−1) and high-q (2.7 < q <2.8 Å−1), indicated by black rectangles.
Fig. S8.
Fig. S8.
Variation in background scattering. Representative background scattering patterns acquired over a period of 39 h presented as (A) 2D images and (B) azimuthally averaged I(q) plots.
Fig. S9.
Fig. S9.
Deviation among background patterns at low q, despite using an internal standard for beam intensity presented as (A) 2D images and (B) azimuthally averaged I(q). Background patterns (Fig. S8) were analyzed in two groups (1–14 before the synchrotron beam going down and 15–20 afterward). The average of the patterns in a group was used as the background for that group. Normalization by the intensity in the q range 2.7–2.8 Å−1 before subtraction produced a near-zero residual only for q > 2.4 Å−1; at low q, the residual varied from +2% to −4% of the overall background. Relative to the maximum signal contributed by a single 30-s acquisition of a 15-μm PLLA section (its 110/200 peak), the low-q residual ranges from −40% to +25%, swamping out the variations among the PLLA patterns.
Fig. S10.
Fig. S10.
Schematic illustration of two-parameter background subtraction. (A) When the average of background patterns (Raw Bkg) is subtracted from the sample diffraction pattern (PLLA + Bkg), large disparities at q values at which sample plus background is known to be indistinguishable from the background [marked by rectangles (compare Fig. S7)] are observed. This disparity cannot be removed with simple scaling (Fig. S9). (B) The disparity can be removed by a two-parameter adjustment αB(q, Φ) + β of the background [Bkg(α & β)] (see Eq. S1 and text for formulae for α and β).
Fig. S11.
Fig. S11.
Validation of two-parameter background subtraction, for the same sets of background scattering patterns as in Fig. S8 and again using the average of the patterns in a group as the background B(q, Φ) for that group. The residuals after subtraction of αB(q, Φ) + β (see text for formulae for α and β) from representative individual background patterns are shown (A) as 2D images and (B) as azimuthally averaged I(q).
Fig. S12.
Fig. S12.
Effect of two-parameter background subtraction on PLLA intensity. Comparison of (A) the residual of a representative two-parameter subtraction of one background dataset from another and (B) the signal due to PLLA (from two 30-s acquisitions) isolated using two-parameter background subtraction.

References

    1. Nichols M, Townsend N, Scarborough P, Rayner M. Cardiovascular disease in Europe 2014: Epidemiological update. Eur Heart J. 2014;35(42):2950–2959. - PubMed
    1. Epstein AJ, Polsky D, Yang F, Yang L, Groeneveld PW. Coronary revascularization trends in the United States, 2001-2008. JAMA. 2011;305(17):1769–1776. - PMC - PubMed
    1. Ormiston JA, et al. A bioabsorbable everolimus-eluting coronary stent system for patients with single de-novo coronary artery lesions (ABSORB): A prospective open-label trial. Lancet. 2008;371(9616):899–907. - PubMed
    1. Wiebe J, Nef HM, Hamm CW. Current status of bioresorbable scaffolds in the treatment of coronary artery disease. J Am Coll Cardiol. 2014;64(23):2541–2551. - PubMed
    1. Stettler C, et al. Outcomes associated with drug-eluting and bare-metal stents: A collaborative network meta-analysis. Lancet. 2007;370(9591):937–948. - PubMed

Publication types

LinkOut - more resources