. 2017 Jan 25;45(2):619-630.
doi: 10.1093/nar/gkw855. Epub 2016 Sep 26.

Crosstalk between androgen and pro-inflammatory signaling remodels androgen receptor and NF-κB cistrome to reprogram the prostate cancer cell transcriptome

Affiliations

Crosstalk between androgen and pro-inflammatory signaling remodels androgen receptor and NF-κB cistrome to reprogram the prostate cancer cell transcriptome

Marjo Malinen et al. Nucleic Acids Res. .

Abstract

Inflammatory processes and androgen signaling are critical for the growth of prostate cancer (PC), the most common cancer among males in Western countries. To understand the importance of potential interplay between pro-inflammatory and androgen signaling for gene regulation, we have interrogated the crosstalk between androgen receptor (AR) and NF-κB, a key transcriptional mediator of inflammatory responses, by utilizing genome-wide chromatin immunoprecipitation sequencing and global run-on sequencing in PC cells. Co-stimulation of LNCaP cells with androgen and pro-inflammatory cytokine TNFα invoked a transcriptome which was very distinct from that induced by either stimulation alone. The altered transcriptome that included gene programs linked to cell migration and invasiveness was orchestrated by significant remodeling of NF-κB and AR cistrome and enhancer landscape. Although androgen multiplied the NF-κB cistrome and TNFα restrained the AR cistrome, there was no general reciprocal tethering of the AR to the NF-κB on chromatin. Instead, redistribution of FOXA1, PIAS1 and PIAS2 contributed to the exposure of latent NF-κB chromatin-binding sites and masking of AR chromatin-binding sites. Taken together, concomitant androgen and pro-inflammatory signaling significantly remodels especially the NF-κB cistrome, reprogramming the PC cell transcriptome in fashion that may contribute to the progression of PC.


Figures

Figure 1.
Figure 1.
Crosstalk between androgen and TNFα signaling is reflected in the chromatin binding of AR and p65. ChIP-seq was used to analyze the chromatin binding of the androgen receptor (AR) and the p65 (activating subunit of NF-κB) in LNCaP cells treated 2 h with DHT (100 nM), TNFα (1000 U/ml) or both (D+T). (A) Venn diagram showing overlap of ARBs in cells exposed to DHT or D+T. Heat map showing ChIP-seq signals of AR and p65 in DHT, TNFα, D+T or vehicle (DMSO, −) treatment and H3K4me1 and H3K27me3 histone marks (28) in androgen (R1881) and vehicle (−) treatment at ±2 kb window surrounding ARBs. ChIP-seq intensities are normalized to 107 reads and shown using false-color scale (intensity increases from darker to lighter colors). Line profiles show average ChIP-seq signal intensities at ±1 kb area surrounding the peak centers at ARBs unique to DHT (blue), D+T (purple) or shared between two peak populations (black). (B) Hierarchical clustering of enriched DNA-binding motifs of different ARB categories. Percentage of ARBs with motif is shown with shades of red. (C) Venn diagram showing overlap of p65Bs in cells exposed to TNFα or D+T. ChIP-seq signals in heat map are same as above shown at ±2 kb window surrounding p65Bs. Line profiles show average ChIP-seq signal intensities at ±1 kb area surrounding the peak centers of p65Bs shared between TNFα and D+T (black) or the ones unique to D+T (purple). (D) Hierarchical clustering of enriched DNA-binding motifs of different p65B categories. Percentage of motifs in p65Bs is shown with shades of red.
Figure 2.
Figure 2.
TNFα induces FOXA1 and PIAS1/2 binding at p65 chromatin-binding sites. Chromatin binding of the FOXA1 and the PIAS proteins was analyzed with ChIP-seq in LNCaP cells treated as in Figure 1. (A) False-color scale heat map (intensity increases from darker to lighter colors) of FOXA1 and PIAS1+2 ChIP-seq signal intensities at different ARB groups. Line profile showing FOXA1 and PIAS1+2 average ChIP-seq signals at ARBs unique to DHT (blue), unique to D+T (dashed purple line) or shared with both ARB groups (dashed black line). (B) Boxplot of FOXA1 (upper panel) and PIAS1+2 (lower panel) ChIP-seq signals in DHT (blue), TNFα (red), D+T (purple) and vehicle (white) conditions at ±100 bp region of different ARB groups. Statistically different groups are given unique labels (Kruskal–Wallis test, Dunn's post-test, P < 0.05). Whiskers in boxplot mark 10% and 90% of the data and the line represents the median. (C) Heat map of FOXA1 and PIAS1+2 at different p65B groups. Signals are the same as in A. Line profile of average FOXA1 and PIAS1+2 ChIP-seq signals at D+T unique (purple) or TNFα D+T shared (dashed black line) p65Bs. (D) Boxplot of FOXA1 (left) and PIAS1+2 (right) signals at different p65B groups. Color coding and analysis are the same as in B.
Figure 3.
Figure 3.
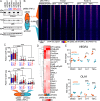
FOXA1 modulates chromatin binding of p65. The role of FOXA1 in p65 chromatin binding was analyzed in FOXA1 silenced cells (siFOXA1) and control siRNA transfected (siNON) cells treated with TNFα using ChIP-seq. (A) Immunoblotting of FOXA1 silenced (siFOXA1) and control (siNON) cells treated 2 h with DHT, TNFα, both (D+T) or vehicle (−) using anti-FOXA1, anti-p65, anti-AR and anti-tubulin antibodies. (B) Venn diagram showing overlap of p65Bs in TNFα-treated siNON and siFOXA1 cells and false-colored heat map showing ChIP-seq signal intensities of p65 (siNON and siFOXA1), FOXA1 (non-silenced) and PIAS1+2 (non-silenced) at ±2 kb window centered at p65Bs. (C) Boxplot of FOXA1 (upper panel) and PIAS1+2 (lower panel) signals in DHT (blue), TNFα (red), D+T (purple) or vehicle (white) treatments at different p65B groups. Whiskers in boxplot mark 10% and 90% of the data and the line represents the median. (D) Hierarchical clustering of DNA-binding motif occurrences in p65Bs unique to siNON or siFOXA1 or shared with two treatments. (E) Effect of FOXA1 depletion on the gene expression of VEGFA and OLA1 genes. RT-qPCR results of DHT-, TNFα-, D+T- or vehicle-treated siNON (orange) and siFOXA1 (light blue) transfected cells were normalized to GAPDH mRNA levels and fold changes were calculated in reference to siNON in vehicle treatment. Three biological replicates and the average value are shown. All significant changes between siNON and siFOXA1 pairs within a single treatment are marked with stars (one-way ANOVA; *P-value < 0.01, ***P-value < 0.001).
Figure 4.
Figure 4.
Interplay between androgen and TNFα signaling leads to a distinct enhancer activity landscape. GRO-seq was used to map transcription in LNCaP cells treated for 4 h with vehicle (black), DHT (blue), TNFα (red) or both (D+T, purple). (A) The visualization of AR and p65 ChIP-seq and GRO-seq (plus- and minus-strands) signals at two intergenic loci show DHT and TNFα-induced binding of AR and p65, and induction of bi-directional transcription. Numbers depict the maximum signals. (B) Boxplot of GRO-seq signals at control (−, white), DHT (D, blue), TNFα (T, red) and D+T (purple) treatment at different intergenic ARB groups (DHT unique, shared and D+T unique) ±2 kb from the center of ARBs. (C) Boxplot of GRO-seq signals in control (white), DHT (blue), TNFα (red) and D+T (purple) treatment at different intergenic p65B groups (D+T unique and TNFα shared) ±2 kb from the center of p65Bs. (D) Schematic presentation of transcription defined eRNA enhancers. Intergenic eRNA enhancers were defined as regions where two opposing ≥200-bp long intergenic transcripts are found <1 kb apart from each other. (E) Heat map of logarithmic fold changes (log2FC, ±2 kb) of eRNA enhancer in DHT, TNFα and D+T treatments compared to vehicle. Venn diagram showing overlap of up- (UP; log2FC > 0.5, FDR < 0.1) and downregulated (DOWN; log2FC < −0.5, FDR < 0.1) enhancer transcription. The table of Spearman's correlation coefficients of enhancer log2FC values (P-values <2.2 × 10⁻¹²). Boxplots of logarithmic fold change of enhancer-associated genes (log2FC; compared to vehicle) in DHT (blue), TNFα (red) or D+T (purple) treatments. Genes associated with eRNA enhancers that were upregulated (F) and downregulated (G) in DHT, TNFα or D+T treatment are shown. Genes associated with all eRNA enhancers (ALL) were not differentially transcribed in any of the treatments. In all boxplots, stars depict P-values (***P-value < 0.001, **P-value < 0.01, *P-value < 0.05, ns = non-significant) of Kruskal–Wallis/Dunn's multiple comparison tests. In gene associations in F and G, significance to equivalent treatment in ALL enhancers is shown. In all boxplots, line represents median and whiskers mark 10% and 90% of the data.
Figure 5.
Figure 5.
Prostate cancer cell transcriptome is reprogrammed by coactivation of AR and NF-κB. DHT, TNFα and D+T-induced changes in gene transcription were measured using GRO-seq and enrichment of differentially transcribed genes to biological processes was analyzed by Ingenuity Pathway Analysis. (A) Heat map of normalized transcription changes in 4 h DHT, TNFα or D+T treatments. Transcription of all treatments compared to vehicle was normalized between maximum and minimum values and all genes that were differentially transcribed in any treatment are shown (FDR < 0.01). (B) The table of correlation coefficients of differentially transcribed genes (Spearman's correlation; P-values <2.6 × 10⁻¹⁴). (C and D) Venn diagrams showing overlap of genes that were upregulated (C) or downregulated (D) in DHT (blue), TNFα (red) and D+T (purple) treatments. (E) Heat map of changes in activity of disease and biological function pathways. A core analysis was performed in Ingenuity Pathway Analysis tool with three distinct lists (DHT-, TNFα- and DHT+TNFα regulated genes). All upregulated (shades of red; Z-score > 2, P-value < 0.05) and downregulated (shades of green, Z-score < −2, P-value < 0.05) biological function pathways are shown in the right side panel and a blowup of selected pathways in the left panel (full list in Supplementary Table S1). Biological functions that were uniquely upregulated in D+T are in red and those most activated in D+T treatment are in orange.

Similar articles

Cited by

References

    1. Knudsen K.E., Scher H.I. Starving the addiction: New opportunities for durable suppression of AR signaling in prostate cancer. Clin. Cancer Res. 2009;15:4792–4798. - PMC - PubMed
    1. Vis A.N., Schroder F.H. Key targets of hormonal treatment of prostate cancer. part 2: the androgen receptor and 5alpha-reductase. BJU Int. 2009;104:1191–1197. - PubMed
    1. Shafi A.A., Yen A.E., Weigel N.L. Androgen receptors in hormone-dependent and castration-resistant prostate cancer. Pharmacol. Ther. 2013;140:223–238. - PubMed
    1. Oeckinghaus A., Ghosh S. The NF-kappaB family of transcription factors and its regulation. Cold Spring Harb. Perspect. Biol. 2009;1:a000034. - PMC - PubMed
    1. Mizokami A., Gotoh A., Yamada H., Keller E.T., Matsumoto T. Tumor necrosis factor-alpha represses androgen sensitivity in the LNCaP prostate cancer cell line. J. Urol. 2000;164:800–805. - PubMed

Publication types

MeSH terms