

Impact of Helicobacter pylori on the healing process of the gastric barrier
- PMID: 27672275
- PMCID: PMC5011668
- DOI: 10.3748/wjg.v22.i33.7536
Impact of Helicobacter pylori on the healing process of the gastric barrier
Abstract
Aim: To determine the impact of selected well defined Helicobacter pylori (H. pylori) antigens on gastric barrier cell turnover.
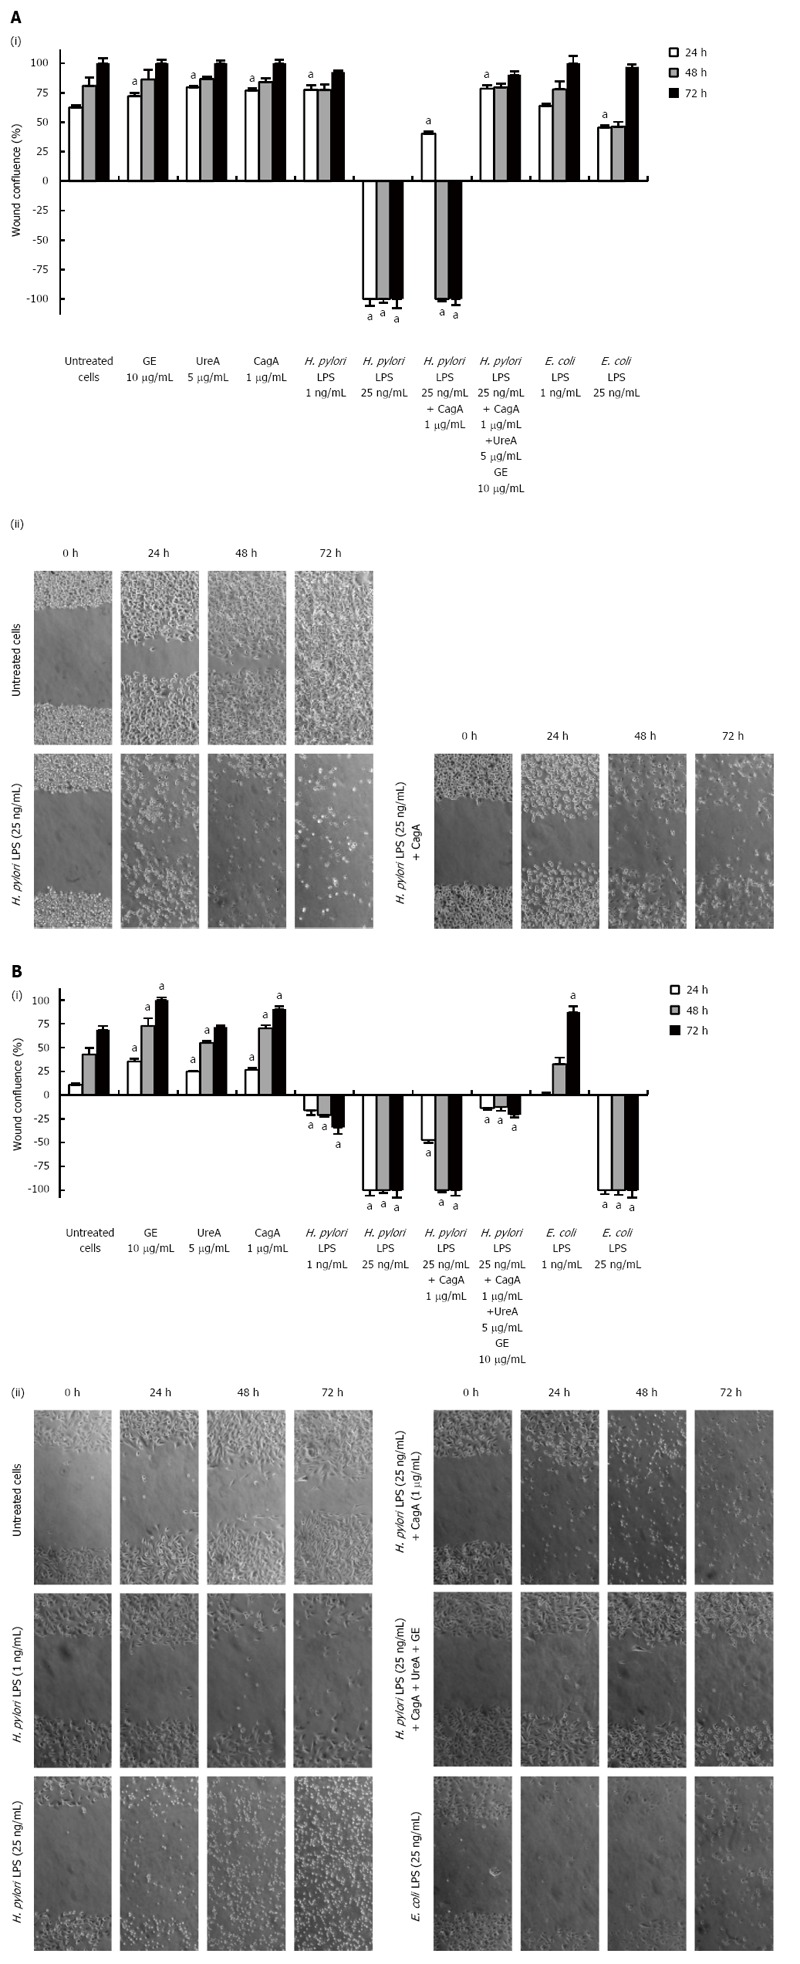
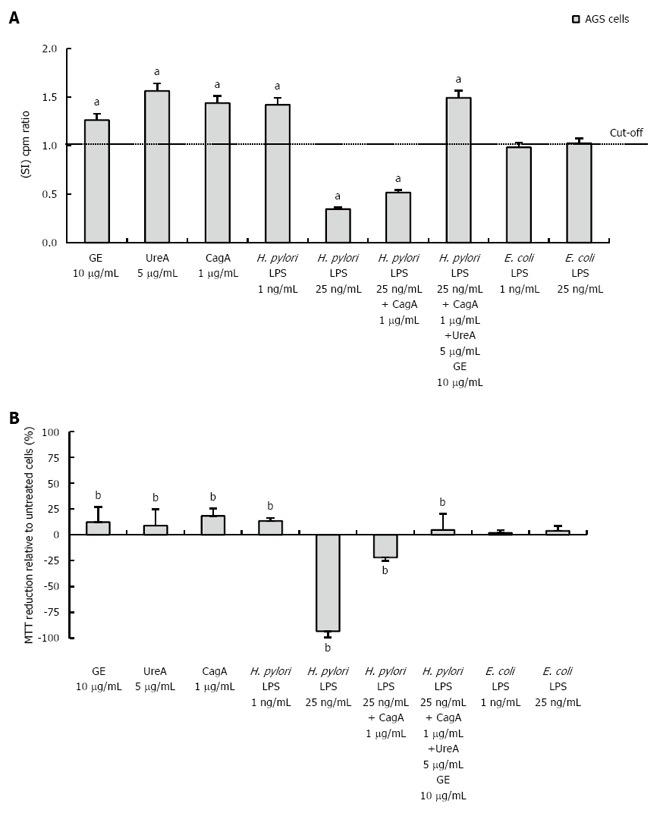
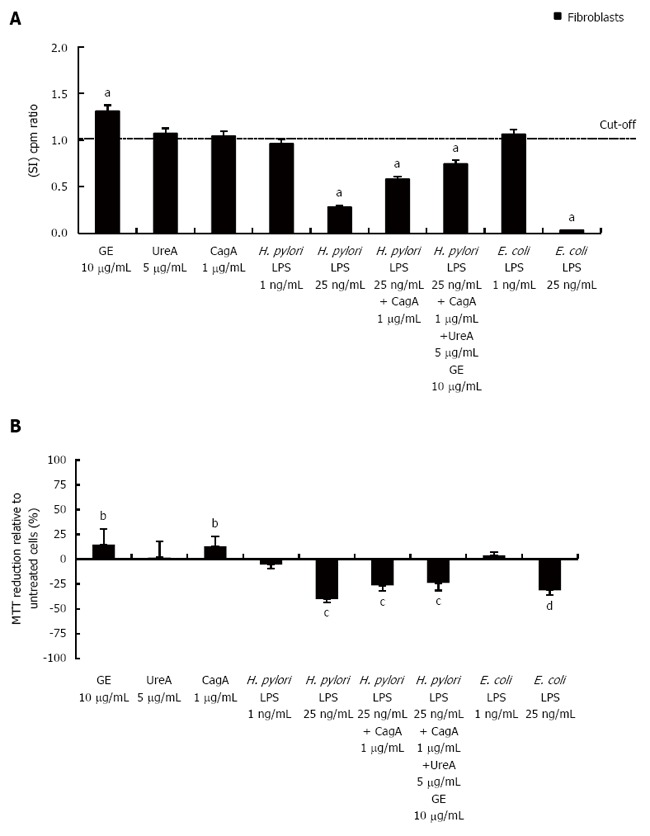
Methods: In this study, using two cellular models of gastric epithelial cells and fibroblasts, we have focused on exploring the effects of well defined H. pylori soluble components such as glycine acid extract antigenic complex (GE), subunit A of urease (UreA), cytotoxin associated gene A protein (CagA) and lipopolysaccharide (LPS) on cell turnover by comparing the wound healing capacity of the cells in terms of their proliferative and metabolic activity as well as cell cycle distribution. Toxic effects of H. pylori components have been assessed in an association with damage to cell nuclei and inhibition of signal transducer and activator of transcription 3 (STAT3) phosphorylation.
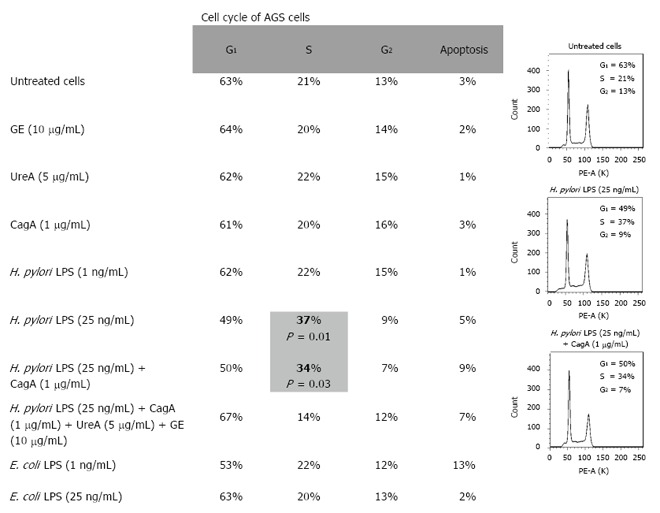
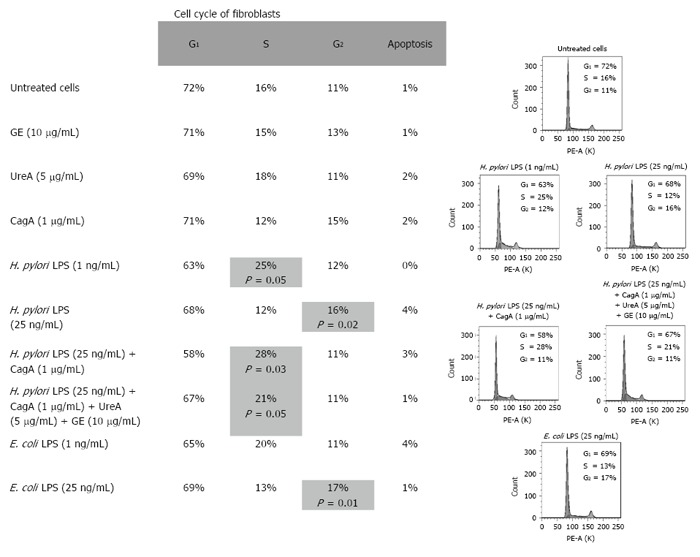
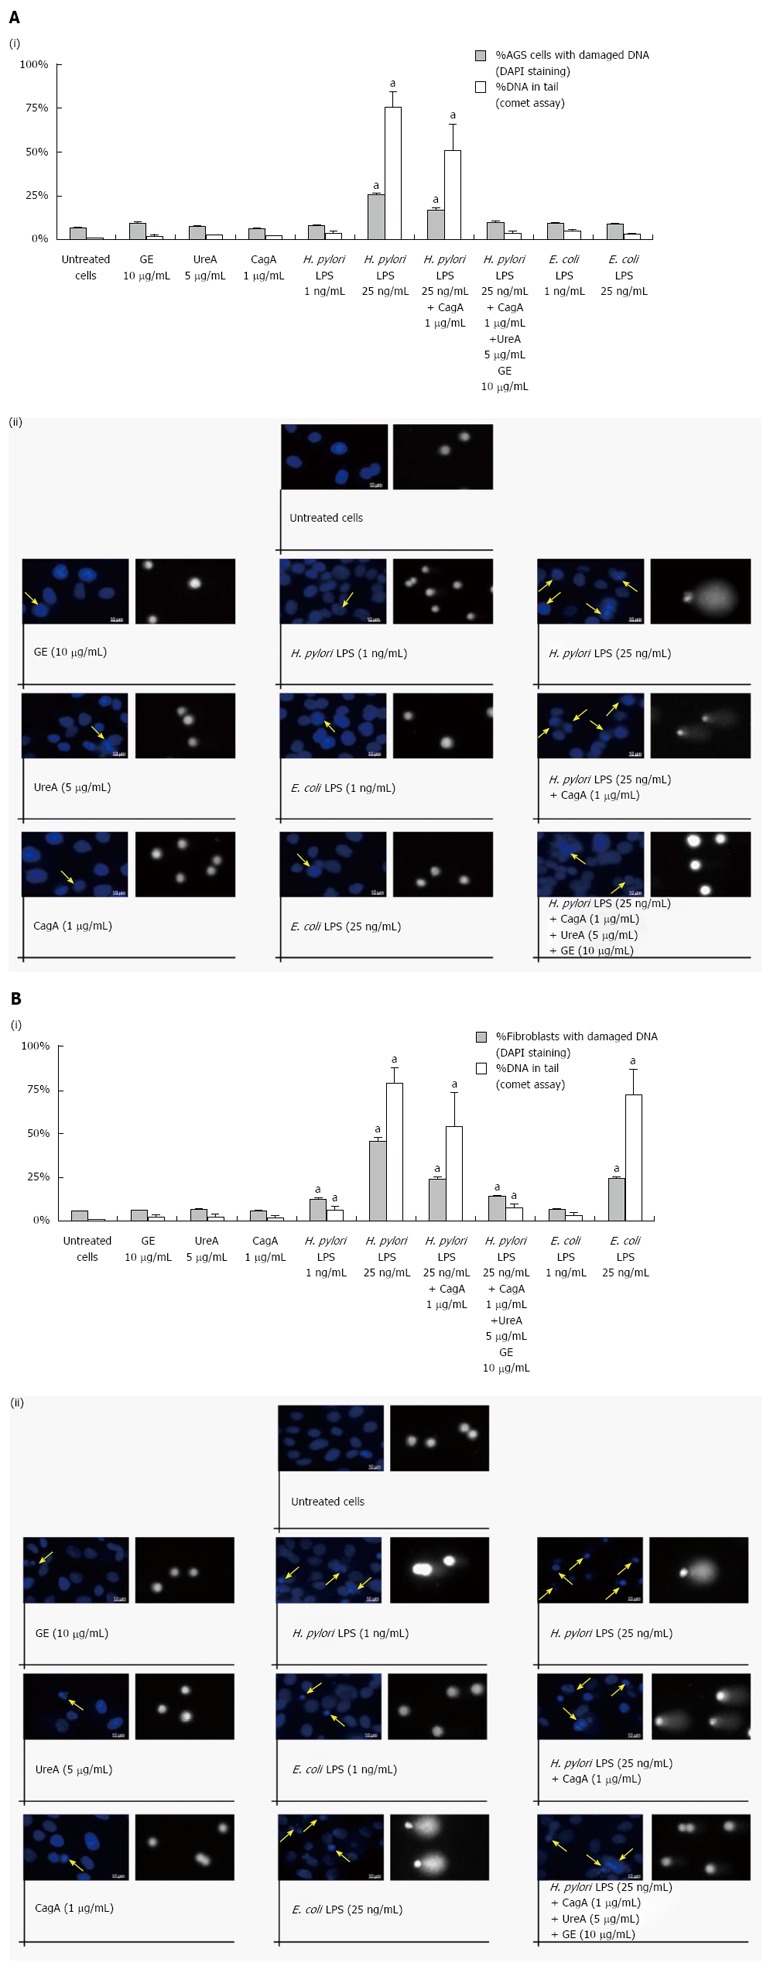
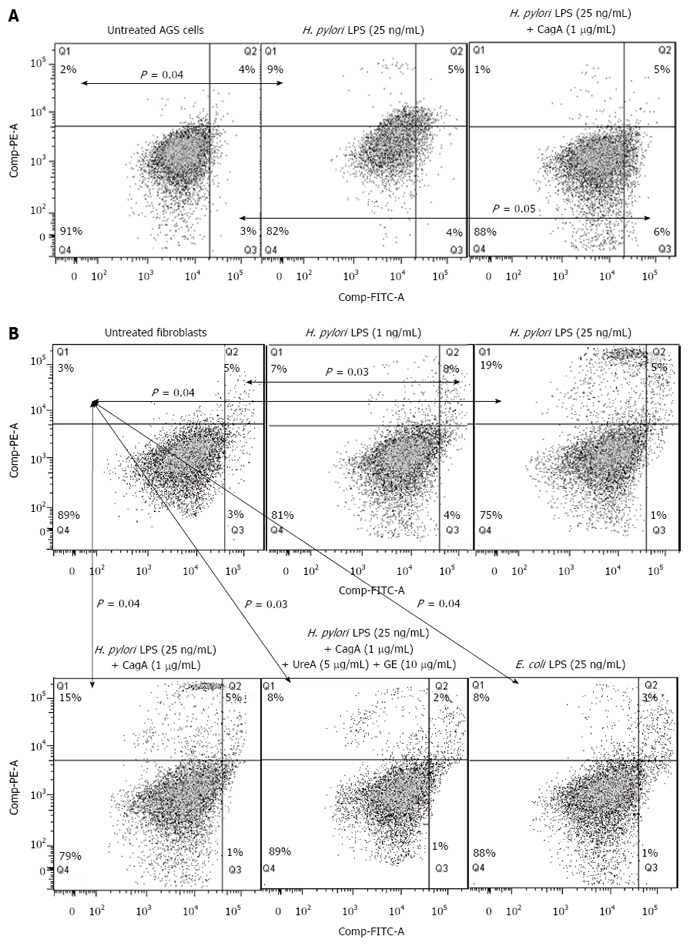
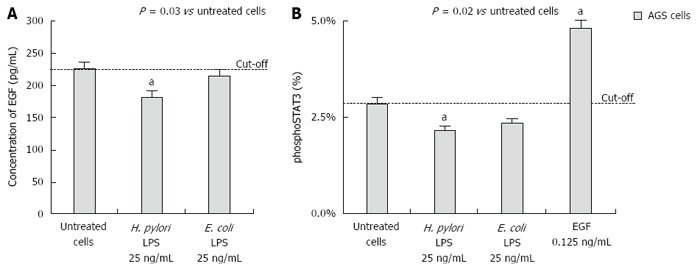
Results: We showed that H. pylori GE, CagA and UreA promoted regeneration of epithelial cells and fibroblasts, which is necessary for effective tissue healing. However, in vivo increased proliferative activity of these cells may constitute an increased risk of gastric neoplasia. In contrast, H. pylori LPS showed a dose-dependent influence on the process of wound healing. At a low concentration (1 ng/mL) H. pylori LPS accelerated of healing epithelial cells, which was linked to significantly enhanced cell proliferation and MTT reduction as well as lack of alterations in cell cycle and downregulation of epidermal growth factor (EGF) production as well as cell nuclei destruction. By comparison, H. pylori LPS at a high concentration (25 ng/mL) inhibited the process of wound repair, which was related to diminished proliferative activity of the cells, cell cycle arrest, destruction of cell nuclei and downregulation of the EGF/STAT3 signalling pathway.
Conclusion: In vivo H. pylori LPS driven effects might lead to the maintenance of chronic inflammatory response and pathological disorders on the level of the gastric mucosal barrier.
Keywords: Gastric barrier dysfunction; Helicobacter pylori; Wound healing.
Conflict of interest statement
Conflict-of-interest statement: The authors have no competing interests.
Figures
Similar articles
-
The effect of Helicobacter pylori infection and different H. pylori components on the proliferation and apoptosis of gastric epithelial cells and fibroblasts.PLoS One. 2019 Aug 7;14(8):e0220636. doi: 10.1371/journal.pone.0220636. eCollection 2019. PLoS One. 2019. PMID: 31390383 Free PMC article.
-
Helicobacter pylori CagA promotes the malignant transformation of gastric mucosal epithelial cells through the dysregulation of the miR-155/KLF4 signaling pathway.Mol Carcinog. 2019 Aug;58(8):1427-1437. doi: 10.1002/mc.23025. Epub 2019 Jun 4. Mol Carcinog. 2019. PMID: 31162747
-
Interaction of CagA with Crk plays an important role in Helicobacter pylori-induced loss of gastric epithelial cell adhesion.J Exp Med. 2005 Nov 7;202(9):1235-47. doi: 10.1084/jem.20051027. J Exp Med. 2005. PMID: 16275761 Free PMC article.
-
New acquisitions in Helicobacter pylori characteristics.Ital J Gastroenterol Hepatol. 1998 Oct;30 Suppl 3:S254-8. Ital J Gastroenterol Hepatol. 1998. PMID: 10077748 Review.
-
Helicobacter pylori virulence factor CagA promotes tumorigenesis of gastric cancer via multiple signaling pathways.Cell Commun Signal. 2015 Jul 11;13:30. doi: 10.1186/s12964-015-0111-0. Cell Commun Signal. 2015. PMID: 26160167 Free PMC article. Review.
Cited by
-
Activation of STAT3 signaling is mediated by TFF1 silencing in gastric neoplasia.Nat Commun. 2019 Jul 10;10(1):3039. doi: 10.1038/s41467-019-11011-4. Nat Commun. 2019. PMID: 31292446 Free PMC article.
-
Equilibria of complexes in the aqueous cobalt(II)-N-(2-hydroxybenzyl)phenylalanine system and their biological activity compared to analogous Schiff base structures.Comput Struct Biotechnol J. 2023 Jan 27;21:1312-1323. doi: 10.1016/j.csbj.2023.01.035. eCollection 2023. Comput Struct Biotechnol J. 2023. PMID: 36814724 Free PMC article.
-
Doxorubicin loaded polylactide nanoparticles functionalized histamine promote apoptosis of human gastric cancer cells AGS.Sci Rep. 2025 Apr 24;15(1):14243. doi: 10.1038/s41598-025-99004-w. Sci Rep. 2025. PMID: 40274948 Free PMC article.
-
Evaluating the presence of Mycoplasma hyorhinis, Fusobacterium nucleatum, and Helicobacter pylori in biopsies of patients with gastric cancer.Infect Agent Cancer. 2021 Dec 23;16(1):70. doi: 10.1186/s13027-021-00410-2. Infect Agent Cancer. 2021. PMID: 34949212 Free PMC article.
-
Helicobacter pylori Infection Acts Synergistically with a High-Fat Diet in the Development of a Proinflammatory and Potentially Proatherogenic Endothelial Cell Environment in an Experimental Model.Int J Mol Sci. 2021 Mar 25;22(7):3394. doi: 10.3390/ijms22073394. Int J Mol Sci. 2021. PMID: 33806236 Free PMC article.
References
-
- Henriksnäs J, Phillipson M, Storm M, Engstrand L, Soleimani M, Holm L. Impaired mucus-bicarbonate barrier in Helicobacter pylori-infected mice. Am J Physiol Gastrointest Liver Physiol. 2006;291:G396–G403. - PubMed
-
- Marshall BJ, Warren JR. Unidentified curved bacilli in the stomach of patients with gastritis and peptic ulceration. Lancet. 1984;1:1311–1315. - PubMed
MeSH terms
Substances
LinkOut - more resources
Full Text Sources
Other Literature Sources
Medical
Miscellaneous
