

Monitoring Error Rates In Illumina Sequencing
- PMID: 27672352
- PMCID: PMC5026502
- DOI: 10.7171/jbt.16-2704-002
Monitoring Error Rates In Illumina Sequencing
Abstract
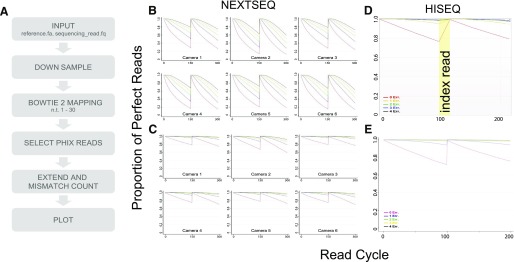
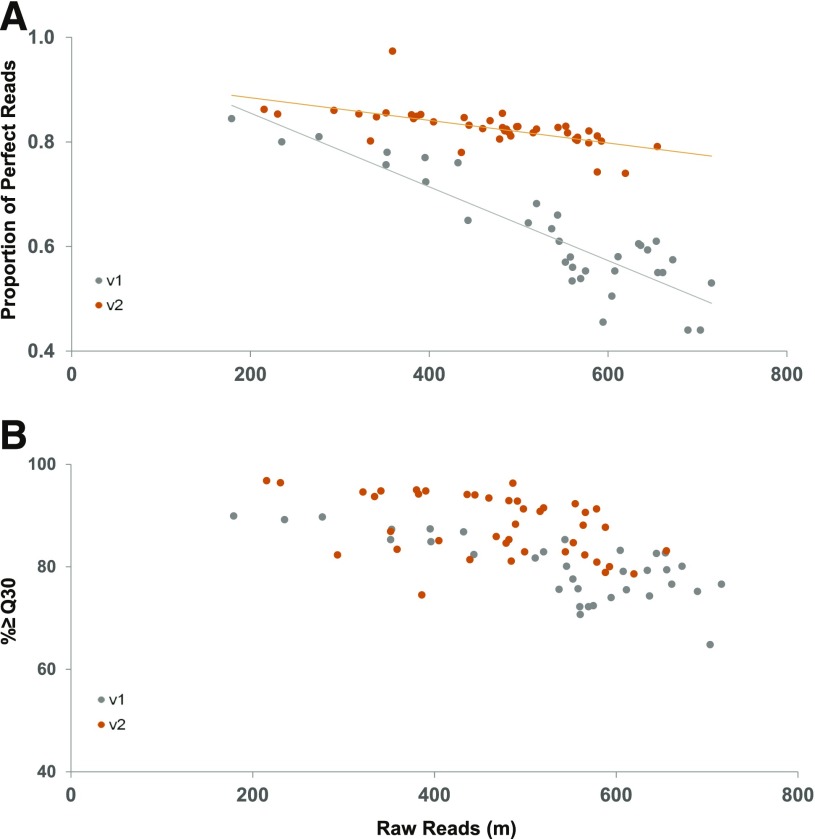
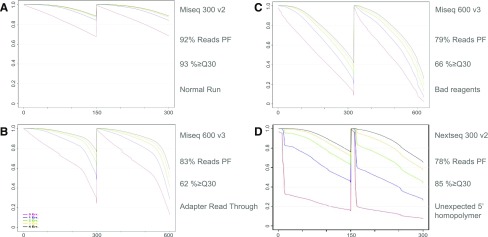
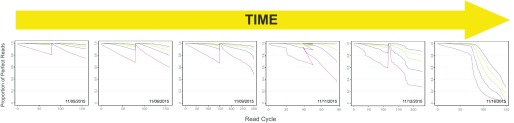
Guaranteeing high-quality next-generation sequencing data in a rapidly changing environment is an ongoing challenge. The introduction of the Illumina NextSeq 500 and the depreciation of specific metrics from Illumina's Sequencing Analysis Viewer (SAV; Illumina, San Diego, CA, USA) have made it more difficult to determine directly the baseline error rate of sequencing runs. To improve our ability to measure base quality, we have created an open-source tool to construct the Percent Perfect Reads (PPR) plot, previously provided by the Illumina sequencers. The PPR program is compatible with HiSeq 2000/2500, MiSeq, and NextSeq 500 instruments and provides an alternative to Illumina's quality value (Q) scores for determining run quality. Whereas Q scores are representative of run quality, they are often overestimated and are sourced from different look-up tables for each platform. The PPR's unique capabilities as a cross-instrument comparison device, as a troubleshooting tool, and as a tool for monitoring instrument performance can provide an increase in clarity over SAV metrics that is often crucial for maintaining instrument health. These capabilities are highlighted.
Keywords: bioinformatics; genomics; high-throughput DNA.
Figures
References
-
- Ewing B, Green P. Base-calling of automated sequencer traces using Phred. II. Error probabilities. Genome Res 1998;8:186–194. - PubMed
-
- Understanding Illumina Quality Scores. San Diego, CA: Illumina, Inc., 2014;Pub. No. 770-2012-058.
-
- Gordon A, Hannon GJ. FASTX-Toolkit Version 0.0.13 computer program 2010.
Publication types
MeSH terms
Grants and funding
LinkOut - more resources
Full Text Sources
Other Literature Sources