. 2016 Sep 19;4(9):apps.1600041.
doi: 10.3732/apps.1600041. eCollection 2016 Sep.

Small unmanned aerial vehicles (micro-UAVs, drones) in plant ecology

Affiliations

Small unmanned aerial vehicles (micro-UAVs, drones) in plant ecology

Mitchell B Cruzan et al. Appl Plant Sci. .

Abstract

Premise of the study: Low-elevation surveys with small aerial drones (micro-unmanned aerial vehicles [UAVs]) may be used for a wide variety of applications in plant ecology, including mapping vegetation over small- to medium-sized regions. We provide an overview of methods and procedures for conducting surveys and illustrate some of these applications.

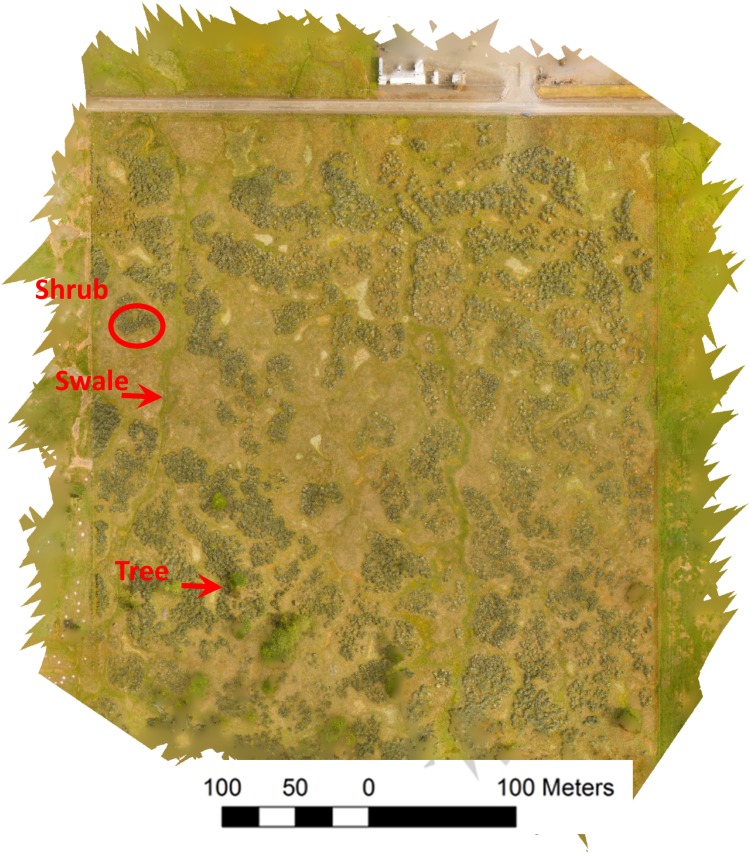
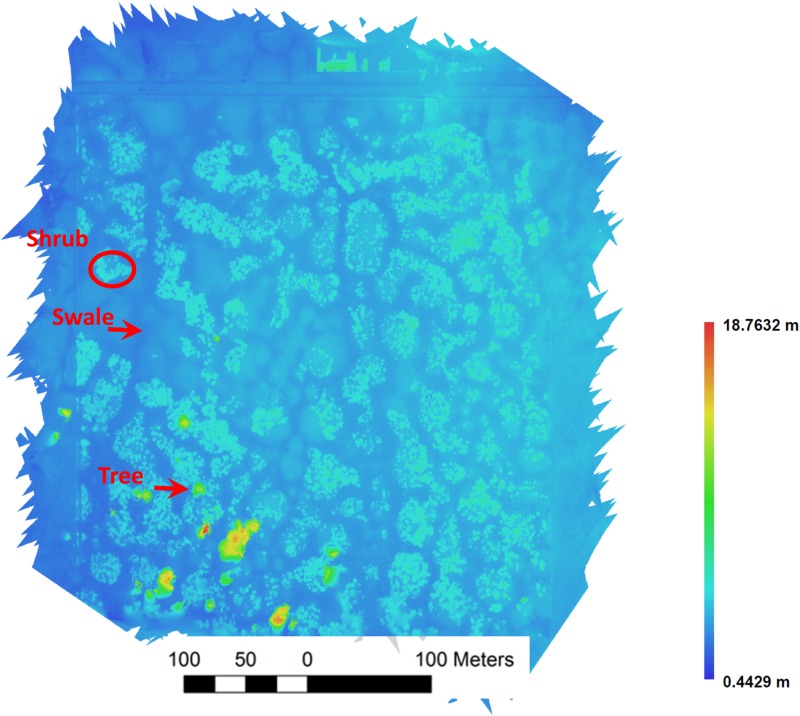
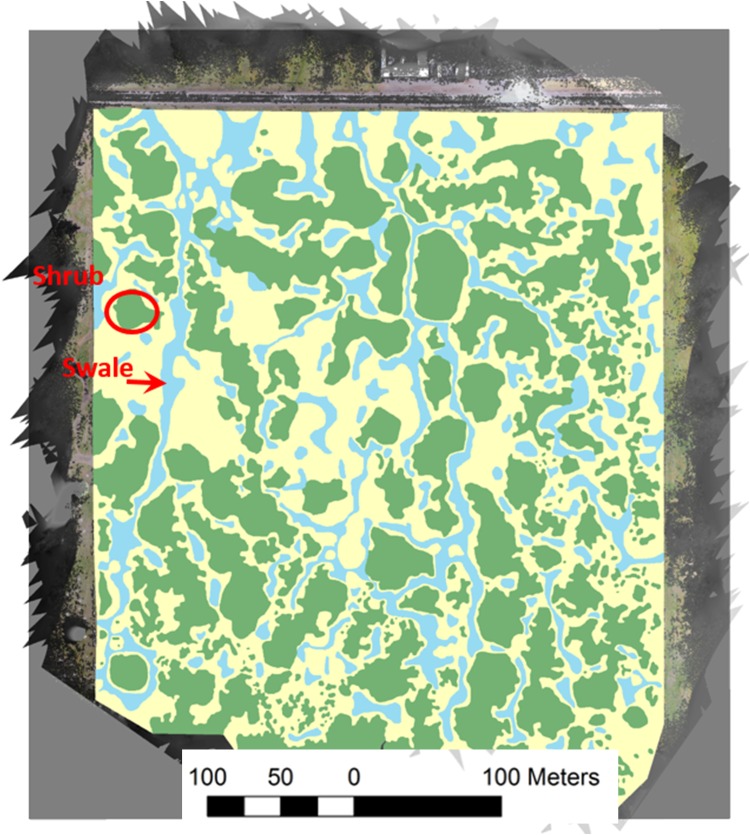
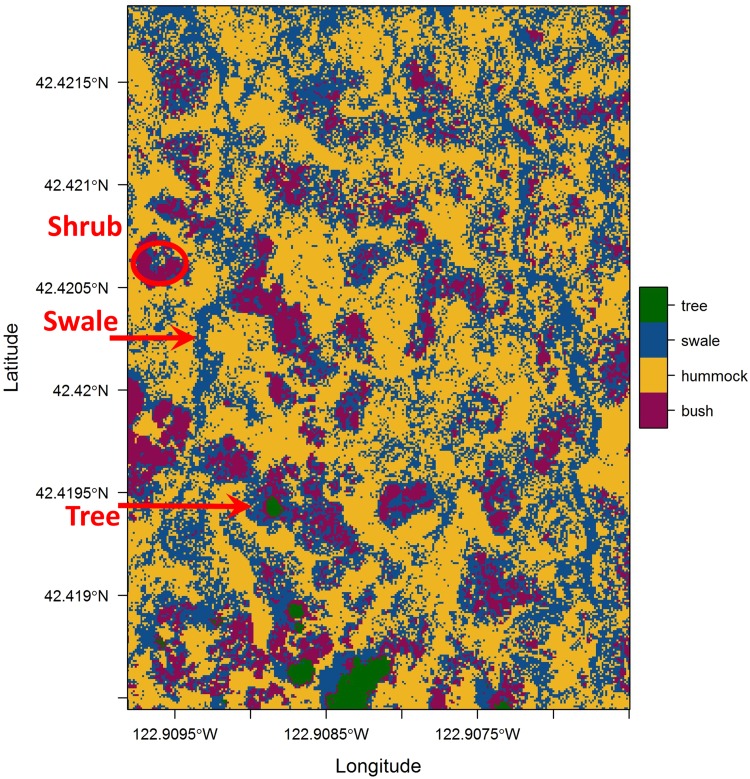
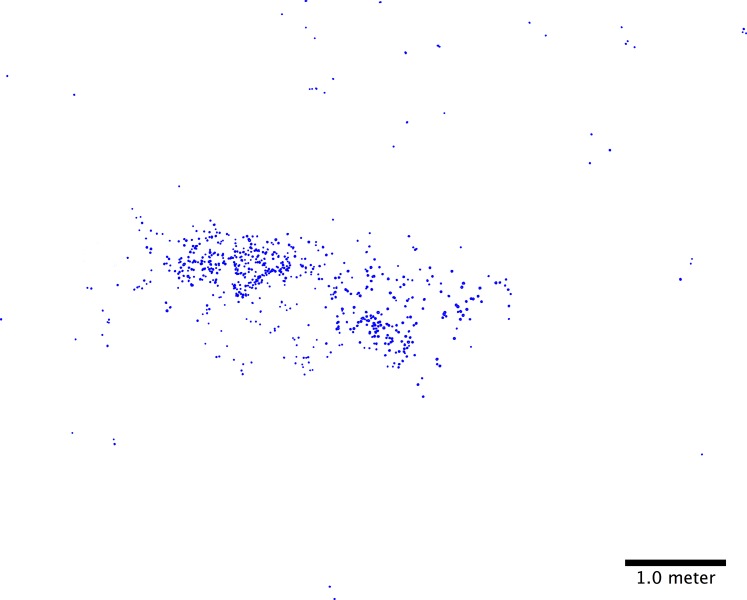
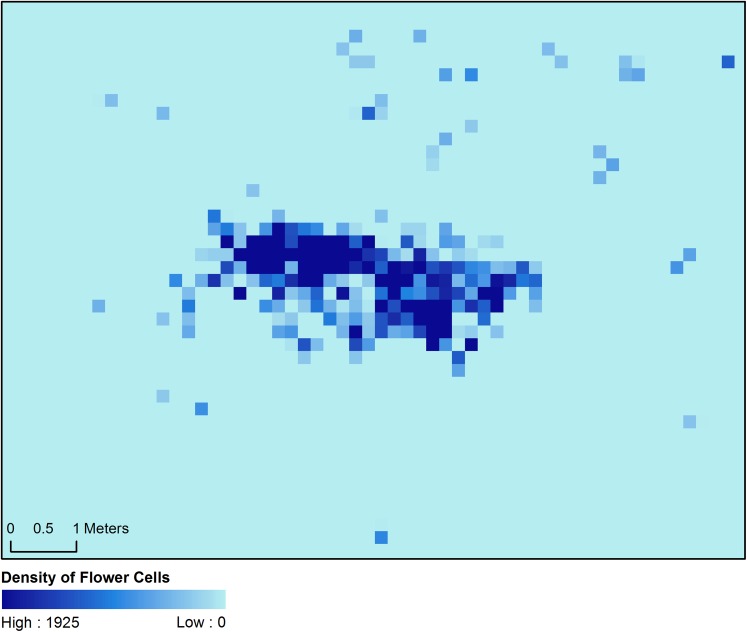
Methods: Aerial images were obtained by flying a small drone along transects over the area of interest. Images were used to create a composite image (orthomosaic) and a digital surface model (DSM). Vegetation classification was conducted manually and using an automated routine. Coverage of an individual species was estimated from aerial images.

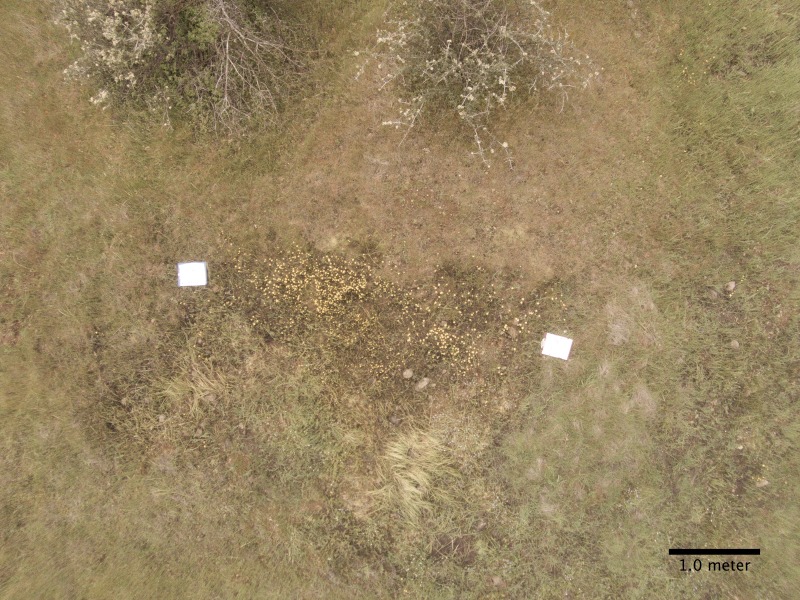
Results: We created a vegetation map for the entire region from the orthomosaic and DSM, and mapped the density of one species. Comparison of our manual and automated habitat classification confirmed that our mapping methods were accurate. A species with high contrast to the background matrix allowed adequate estimate of its coverage.

Discussion: The example surveys demonstrate that small aerial drones are capable of gathering large amounts of information on the distribution of vegetation and individual species with minimal impact to sensitive habitats. Low-elevation aerial surveys have potential for a wide range of applications in plant ecology.

Keywords: aerial drone (micro-UAV, UAS); aerial survey; digital elevation model (DEM); digital surface model (DSM); orthomosaic; vegetation mapping.


Figures

Fig. 1.
Fig. 1.
Considerations for using small aerial drones for vegetation surveys. A schematic of the predicted effects of aerial imaging density on shadowing (gaps) due to trees and shrubs for the orthomosaic and digital surface model (DSM) generated from aerial surveys. Lower densities of aerial images results in larger areas of image shadows around closely spaced shrubs or trees.
Fig. 2.
Fig. 2.
Considerations for using small aerial drones for vegetation surveys. The effects of the distance above shrub or tree elevation (dX, where d is the multiplier of canopy height, X) on shadowing for aerial images. Diminishing returns in shadow reduction is obtained for elevations greater than 2X.
Fig. 3.
Fig. 3.
Strategies for aerial surveys using small drones in rough terrain. Starting from the highest elevation, the entire area should be imaged at low density (thin arrow). Stratified surveys at each elevation are indicated by thicker arrows. Note that the elevation of each survey is constrained and that there is considerable overlap among surveys.
Fig. 4.
Fig. 4.
An orthomosaic of the vernal pool region of the Whetstone Savanna Preserve in southern Oregon generated from aerial images collected using a small drone (DJI Phantom 2 Vision+). To the north is a rural road and light industrial complex. There is a fence line along the west side that is evident as a linear disruption in the vegetation. Along the east side is an agricultural field, and to the south is oak savanna. Examples of shrub, swale (vernal pools), and trees are indicated. Hummocks are regions that generally border between swales and shrubs.
Fig. 5.
Fig. 5.
A DSM of the vernal pool region of the Whetstone Savanna Preserve in southern Oregon generated from aerial images collected using a small drone. The same examples of shrub, swale, and trees used in Fig. 4 are indicated. The heat map represents elevation of vegetation above the land surface across the prairie.
Fig. 6.
Fig. 6.
Results of a manual habitat classification based on the orthomosaic and DSM (Figs. 4 and 5, respectively). The same examples of shrub and swale used in Fig. 4 are indicated.
Fig. 7.
Fig. 7.
Results of an automated habitat classification based on the orthomosaic and DSM (Figs. 4 and 5, respectively). The same examples of shrub, swale, and trees used in Fig. 4 are indicated.
Fig. A1.
Fig. A1.
A lens distortion–corrected image taken at 8-m elevation using the DJI Phantom 2 Vision+ aerial drone.
Fig. A2.
Fig. A2.
The same image as Fig. A1 after pixels representing the distribution of Lasthenia californica flowers have been segregated.
Fig. A3.
Fig. A3.
A heat map of plant density generated in ArcGIS using the image shown in Fig. A2. Values represent number of pixels representing Lasthenia californica flowers out of 5625 pixels in each grid area.

References

    1. Anderson K., Gaston K. J. 2013. Lightweight unmanned aerial vehicles will revolutionize spatial ecology. Frontiers in Ecology and the Environment 11: 138–146.
    1. Bannari A., Morin D., Bonn F., Huete A. R. 1995. A review of vegetation indices. Remote Sensing Reviews 13: 95–120.
    1. Bradski G. 2000. OpenCV_Library. Dr. Dobb’s Journal of Software Tools for the Professional Programmer 25: 120–125.
    1. Dandois J. P., Ellis E. C. 2010. Remote sensing of vegetation structure using computer vision. Remote Sensing 2: 1157–1176.
    1. Elith J., Leathwick J. R., Hastie T. 2008. A working guide to boosted regression trees. Journal of Animal Ecology 77: 802–813. - PubMed