

Comparison between IEGM-based approach and echocardiography in AV/PV and VV delay optimization in CRT-D recipients (Quicksept study)
- PMID: 27676162
- PMCID: PMC5832617
- DOI: 10.1016/j.ipej.2016.05.001
Comparison between IEGM-based approach and echocardiography in AV/PV and VV delay optimization in CRT-D recipients (Quicksept study)
Abstract
Background: AtrioVentricular (AV) and InterVentricular (VV) delay optimization can improve ventricular function in Cardiac Resynchronization Therapy (CRT) and is usually performed by means of echocardiography. St Jude Medical has developed an automated algorhythm which calculates the optimal AV and VV delays (QuickOpt™) based on Intracardiac ElectroGrams, (IEGM), within 2 min. So far, the efficacy of the algorhythm has been tested acutely with standard lead position at right ventricular (RV) apex. Aim of this project is to evaluate the algorhythm performance in the mid- and long-term with RV lead located in mid-septum.
Methods: AV and VV delays optimization data were collected in 13 centers using both echocardiographic and QuickOpt™ guidance in CRTD implanted patients provided with this algorhythm. Measurements of the aortic Velocity Time Integral (aVTI) were performed with both methods in a random order at pre-discharge, 6-month and 12-month follow-up.
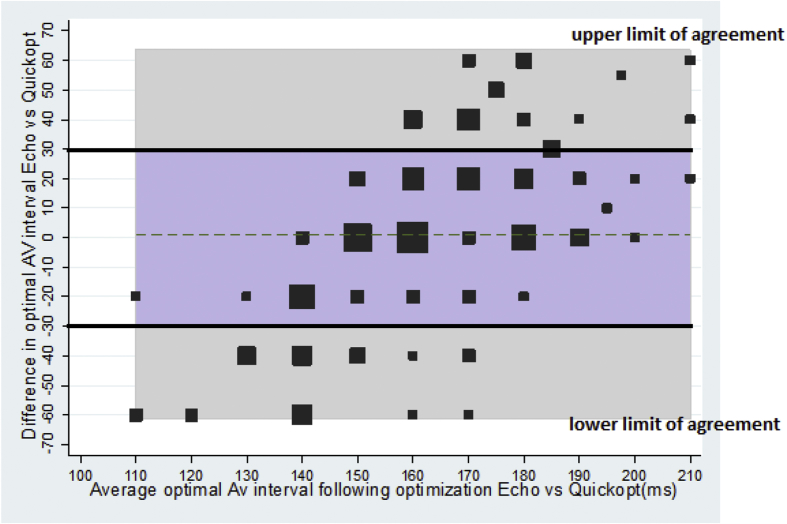
Results: Fifty-three patients were studied (46 males; age 68 ± 10y; EF 28 ± 7%). Maximum aVTI obtained by echocardiography at different AV delays, were compared with aVTI acquired at AV delays suggested by QuickOpt. The AV Pearson correlations were 0.96 at pre-discharge, 0.95 and 0,98 at 6- and 12- month follow-up respectively. After programming optimal AV, the same approach was used to compare echocardiographic aVTI with aVTI corresponding to the VV values provided by QuickOpt. The VV Pearson Correlation were 0,92 at pre-discharge, 0,88 and 0.90 at 6-month and 12- month follow-up respectively.
Conclusions: IEGM-based optimization provides comparable results with echocardiographic method (maximum aVTI) used as reference with mid-septum RV lead location.
Keywords: Cardiac resinchronization therapy; Echocardiographyc optimization; IEGM based algorythm; Mid-septum stimulation; Optimization algorythm.
Copyright © 2016 Indian Heart Rhythm Society. Production and hosting by Elsevier B.V. All rights reserved.
Figures


References
-
- Brignole M., Auricchio A., Baron-Esquivias G., Bordachar P., Boriani G., Breithardt O. ESC Guidelines on cardiac pacing and cardiac resynchronization therapy. Eur Heart J. 2013;34:2281–2329. - PubMed
-
- Moss A.J., Hall J.W., Cannom D.S., Klein H., Brown M.W., Daubert J.P. Cardiac-Resynchronization therapy for the prevention of heart-failure events. N Engl J Med. 2009;361:1329–1338. - PubMed
-
- Abraham W.T., Fisher W.G., Smith A.L., Delrugio D.B., Leon A.R., Loh E. Cardiac resynchronization in chronic heart failure. N Engl J Med. 2002;346:1845–1853. - PubMed
-
- Bristow M.R., Saxon L.A., Boehmer J., Krueger S., Kass D.A., De Marco T. Cardiac-resynchronization therapy with or without an implantable defibrillator in advanced chronic heart failure. N Engl J Med. 2004;350:2140–2150. - PubMed
-
- Cleland J.G., Daubert J.C., Erdmann E., Freemantle N., Gras D., Kappenberger L. Longer-term effects of cardiac resynchronization therapy on mortality in heart failure the Cardiac Resynchronization Heart Failure (CARE-HF) trial extension phase. Eur Heart J. 2006;27:1928–1932. - PubMed
Publication types
LinkOut - more resources
Full Text Sources
Other Literature Sources
Research Materials
Miscellaneous
