

Calcification response of a key phytoplankton family to millennial-scale environmental change
- PMID: 27677230
- PMCID: PMC5039703
- DOI: 10.1038/srep34263
Calcification response of a key phytoplankton family to millennial-scale environmental change
Abstract
Coccolithophores are single-celled photosynthesizing marine algae, responsible for half of the calcification in the surface ocean, and exert a strong influence on the distribution of carbon among global reservoirs, and thus Earth's climate. Calcification in the surface ocean decreases the buffering capacity of seawater for CO2, whilst photosynthetic carbon fixation has the opposite effect. Experiments in culture have suggested that coccolithophore calcification decreases under high CO2 concentrations ([CO2(aq)]) constituting a negative feedback. However, the extent to which these results are representative of natural populations, and of the response over more than a few hundred generations is unclear. Here we describe and apply a novel rationale for size-normalizing the mass of the calcite plates produced by the most abundant family of coccolithophores, the Noëlaerhabdaceae. On average, ancient populations subjected to coupled gradual increases in [CO2(aq)] and temperature over a few million generations in a natural environment become relatively more highly calcified, implying a positive climatic feedback. We hypothesize that this is the result of selection manifest in natural populations over millennial timescales, so has necessarily eluded laboratory experiments.
Figures
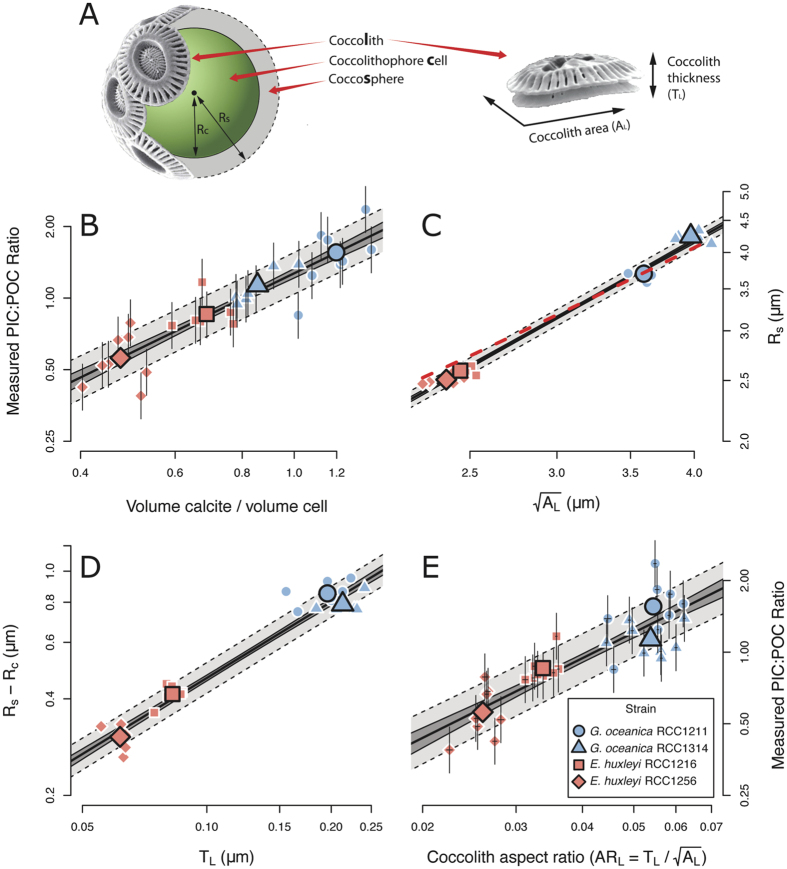
 ; Eq. 3). The dark region around each regression line represents the 1σ confidence interval of the regression, whilst the lighter region with the dashed border represents the 1σ prediction interval of the regression. Error bars on individual points represent the 1σ confidence interval of each measurement. SEM images courtesy of Jeremy Young, used and adapted with permission (
References
-
- Milliman J. Production and accumulation of calcium carbonate in the ocean: budget of a nonsteady state. Global Biogeochemical Cycles 7, 927–957 (1993).
-
- Bown P. R. (ed.) Calcareous nannofossil biostratigraphy, Chapman & Hall, Cambridge (1998).
-
- Rost B. & Riebesell U. Coccolithophores and the biological pump: responses to environmental changes. In Theirstein H. & Young J. (eds) Coccolithophores: From molecular processes to global impacts, 99–124 Springer (2004).
-
- Boyd P. W. & Doney S. C. The Impact of Climate Change and Feedback Processes on the Ocean Carbon Cycle. In Fasham M. J. (ed.) Ocean Biogeochemistry, chap. The Impact, 157–193 Springer (2003).
-
- Riebesell U. et al. Reduced calcification of marine plankton in response to increased atmospheric CO2. Nature 407, 2–5 (2000). - PubMed
Grants and funding
LinkOut - more resources
Full Text Sources
Other Literature Sources
Molecular Biology Databases
