. 2016 Sep 28:7:12983.
doi: 10.1038/ncomms12983.

Epigenomic profiling of primary gastric adenocarcinoma reveals super-enhancer heterogeneity

Affiliations

Epigenomic profiling of primary gastric adenocarcinoma reveals super-enhancer heterogeneity

Wen Fong Ooi et al. Nat Commun. .

Abstract

Regulatory enhancer elements in solid tumours remain poorly characterized. Here we apply micro-scale chromatin profiling to survey the distal enhancer landscape of primary gastric adenocarcinoma (GC), a leading cause of global cancer mortality. Integrating 110 epigenomic profiles from primary GCs, normal gastric tissues and cell lines, we highlight 36,973 predicted enhancers and 3,759 predicted super-enhancers respectively. Cell-line-defined super-enhancers can be subclassified by their somatic alteration status into somatic gain, loss and unaltered categories, each displaying distinct epigenetic, transcriptional and pathway enrichments. Somatic gain super-enhancers are associated with complex chromatin interaction profiles, expression patterns correlated with patient outcome and dense co-occupancy of the transcription factors CDX2 and HNF4α. Somatic super-enhancers are also enriched in genetic risk SNPs associated with cancer predisposition. Our results reveal a genome-wide reprogramming of the GC enhancer and super-enhancer landscape during tumorigenesis, contributing to dysregulated local and regional cancer gene expression.


Conflict of interest statement

W.F.O., S.L. and P.T are authors on patent applications entitled ‘Epigenomic Profiling of Primary Gastric Adenocarcinoma Reveals Super-Enhancer Heterogeneity', SG patent application no. 10201601141X (2016) and 10201606828P (2016). The remaining authors declare no competing financial interests.

Figures

Figure 1
Figure 1. Distal Predicted Enhancer landscapes of GC cell lines.
(a) Histone profiles of OCUM-1 and NCC59 GC cells show enrichment of H3K27ac and H3K4me3 around the DDX47 TSS. A predicted enhancer element exhibiting H3K27ac enrichment and >2.5 kb away from the DDX47 TSS was identified. (b) Snapshot of distal H3K27ac profiles in 4 of the 11 GC cell lines, visualizing the activity of the top 2,000 predicted enhancers and the genome-wide average H3K27ac signal around the predicted enhancers. (c) Genome-wide average H3K4me3 signals around predicted enhancers and active TSSs in GC cell lines. (d) Recurrence rates of regulatory elements. Data presented are the mean percentage +/− standard deviation of common regulatory elements (enhancer—blue; promoter—green) found in two or more gastric cancer cell lines, as a function of number of cell lines. (e) Chromatin accessibility of predicted enhancers versus randomly selected regions. DNase I hypersensitivity (DHS) data from normal gastric tissues was used as a surrogate. The distribution of DHS signals was tested using a one-side Welch's t-test for statistical significance. (f) Percentage of overlap between predicted enhancers, chromatin accessible regions (denoted as DHS+, x axis) and active regulatory elements (denoted as H3K27ac+, y axis) from 50 epigenomic profiles originating from nine different tissue/cell categories. (g) Percentage of predicted enhancers overlapping with EP300 and transcription factor binding sites. (h) Distribution of maximum Phast scores (a measure of DNA sequence conservation) in predicted enhancers and randomly selected regions.
Figure 2
Figure 2. GC cell-line-derived predicted super-enhancers.
(a) Distribution of H3K27ac ChIP-seq signals reveal locations of predicted super-enhancers showing unevenly high H3K27ac signals. Known cancer-associated genes proximal to predicted super-enhancers are indicated. Two cell lines are shown. (b) Percentage of distal regulatory elements (predicted typical enhancers—blue, predicted super-enhancers—red) showing H3K27ac enrichment above randomly selected regions (>99%) across increasing numbers of GC cell lines. (c) H3K27ac ChIP-seq signals at the MALAT1 locus shows stretches of predicted enhancers, corresponding to a predicted super-enhancer (in filled box) with high H3K27ac signals. (d) Examples of top significantly associated biological processes associated with recurrent distal regulatory elements (predicted super-enhancers and top predicted typical enhancers). Negative log-transformed raw P-values from GOrilla were used.
Figure 3
Figure 3. Somatic predicted super-enhancers in primary GCs and matched normal samples.
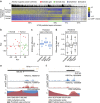
(a) Activity of cell-line-derived predicted super-enhancers in 19 primary tumour and matched normal samples. H3K27ac predicted super-enhancer signals in units of column-transformed RPKM values (z-score) were visualized. The frequency of active predicted super-enhancers in GC lines in vitro is presented as the top histogram (black, above the heatmap). Predicted super-enhancers were categorized into somatic gain, somatic loss, unaltered and inactive. In each category, the predicted super-enhancers were ordered (left to right) by their decreasing mean difference between the tumour and the normal samples. (b) Principal component analysis using recurrent somatic gain predicted super-enhancer signals establish a separation between tumour and normal samples. (c) Differences in H3K4me1 (T-N) signals (RPKM) using H3K4me1 profiles from five tumour and matched normal samples in three predicted super-enhancer categories: somatic gain, somatic loss and unaltered. *P<2.2 × 10⁻¹⁶, one-sided Welch t-test. (d) Differential β values in predicted super-enhancers indicate the state of methylation: hypermethylation (>0) or hypomethylation (<0) between tumours and matched normal samples. (e) DNA hypomethylation in a somatic gain predicted super-enhancer at the ABLIM2 locus. (f) DNA hypermethylation in a somatic loss predicted super-enhancer at the SLC1A2 locus.
Figure 4
Figure 4. Associations between somatic predicted super-enhancers with gene expression and chromatin interactions.
(a) Correlation between log-transformed fold changes in gene expression between different classes of predicted super-enhancers (unaltered, somatic gain, somatic loss) and predicted target gene expression. (b) Interaction heat map from 20 capture points covering 12 somatic gain predicted super-enhancers. Each ring represents a profile from a single capture point, denoted by a black arrowhead. Locations of the predicted super-enhancers are indicated by the gene loci in each ring. Genome-wide interaction signals were computed across the genome in 100 kb bins. Signals at regions within 2 million bases flanking the capture points were visualized. (c) Example of a somatic gain predicted super-enhancer at the CLDN4 locus and interactions with neighbouring genes. Somatic gain activity is associated with upregulation of CLDN4 and neighbouring genes (CLDN3 and ABHD11) in primary GCs. Interactions were detected in SNU16 cells using two capture points, #33 and #34 by Capture-C. Summarized interactions (Q<0.05, r3Cseq) are presented as the last track. Two constituent predicted enhancers, e1 and e2, were deleted independently in SNU16 cells using CRISPR/Cas9 genome editing. (d) Correlation between predicted super-enhancer activity and long-range interactions. Long-range interactions (green triangle) to the SLC35D3 promoter were detected with a predicted super-enhancer active in SNU16 and OCUM-1 cells. Such interactions were not observed in KATO-III cells where the predicted super-enhancer was also not detected.
Figure 5
Figure 5. Somatic predicted super-enhancers inform patient survival and disease risk.
(a) Cancer hallmark analysis using predicted super-enhancers showing recurrent somatic gain, recurrent somatic loss and unaltered H3K27ac signals. Negative log-transformed P-values from the one-sided Fisher's exact test were used. (b) Survival analysis comparing patient groups with samples exhibiting low (blue) and high (red) expression from genes associated with top recurrent somatic gain predicted super-enhancers. The signature is prognostic in the compilation of 848 GC patients (P=1.8 × 10⁻², log-rank test), with worse prognosis observed for patients with tumours having high signature expression (hazard ratio, 95% confidence interval: 1.30 (1.05–1.61); Cox regression P-value after correcting for stage, age, patient locality and Lauren's histological subtypes=4.4 × 10⁻²). Survival data are indicated for every 10 months. (c) Enrichment of disease-associated SNPs in predicted super-enhancers. Enrichments were tested on two classes of predicted super-enhancers: recurrent somatic altered and unaltered predicted super-enhancers using chi-square test. Only diseases/traits with at least 10 SNPs found in all predicted super-enhancers were analysed. (d) Differential H3K27ac signals in predicted super-enhancers with and without colorectal cancer associated SNPs. The total number of patients with or without the SNPs is indicated in brackets. The difference between the two groups was tested using one-sided Welch t-test.
Figure 6
Figure 6. Somatic gain predicted super-enhancers in GC are associated with CDX2 and HNF4α occupancy.
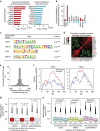
(a) Top 10 transcription factor binding enrichments at recurrent somatic gain predicted super-enhancers and unaltered predicted super-enhancers using the ReMap database. (b) Enrichment or depletion of ReMap transcription factors at recurrent somatic gain predicted super-enhancers compared to unaltered predicted super-enhancers. (c) Detection of candidate CDX2 binding partners using CDX2 binding sites and de novo HOMER motif identification. (d) Pairwise expression correlations of CDX2 and top 20 CDX2 candidate binding partners using RNA-seq from 19 primary tumour and matched normal samples. (e) Percentage of CDX2 binding sites co-occurring with HNF4α binding sites within a 500 bp window in OCUM-1 cells. (f) Differential CDX2 (left) and HNF4α (right) average binding signal analysis between recurrent somatic gain predicted super-enhancers and unaltered predicted super-enhancers. The predicted super-enhancers were also active in OCUM-1. (g) Distribution of H3K27ac depletion magnitude in between somatic gain predicted super-enhancers and predicted typical enhancers in OCUM-1 cells, for single and double TF silencing. Statistical significance was evaluated using the one-sided Wilcoxon rank sum test. (h) Association between H3K27ac sub-regional depletion in somatic gain predicted super-enhancers relative to CDX2, HNF4α or CDX2/HNF4α co-binding sites. Distances were uniformly distributed into three categories: near, moderate and distal to the binding sites. Statistical significance was evaluated using one-sided Wilcoxon rank sum test.

References

    1. Zhang L. et al. Gene expression profiles in normal and cancer cells. Science 276, 1268–1272 (1997). - PubMed
    1. Adler A. S. et al. Genetic regulators of large-scale transcriptional signatures in cancer. Nat. Genet. 38, 421–430 (2006). - PMC - PubMed
    1. Spitz F. & Furlong E. E. Transcription factors: from enhancer binding to developmental control. Nat. Rev. Genet. 13, 613–626 (2012). - PubMed
    1. Muratani M. et al. Nanoscale chromatin profiling of gastric adenocarcinoma reveals cancer-associated cryptic promoters and somatically acquired regulatory elements. Nat. Commun. 5, 4361 (2014). - PubMed
    1. Bernstein B. E. et al. Genomic maps and comparative analysis of histone modifications in human and mouse. Cell 120, 169–181 (2005). - PubMed