

Genomic and functional analysis of the host response to acute simian varicella infection in the lung
- PMID: 27677639
- PMCID: PMC5039758
- DOI: 10.1038/srep34164
Genomic and functional analysis of the host response to acute simian varicella infection in the lung
Abstract
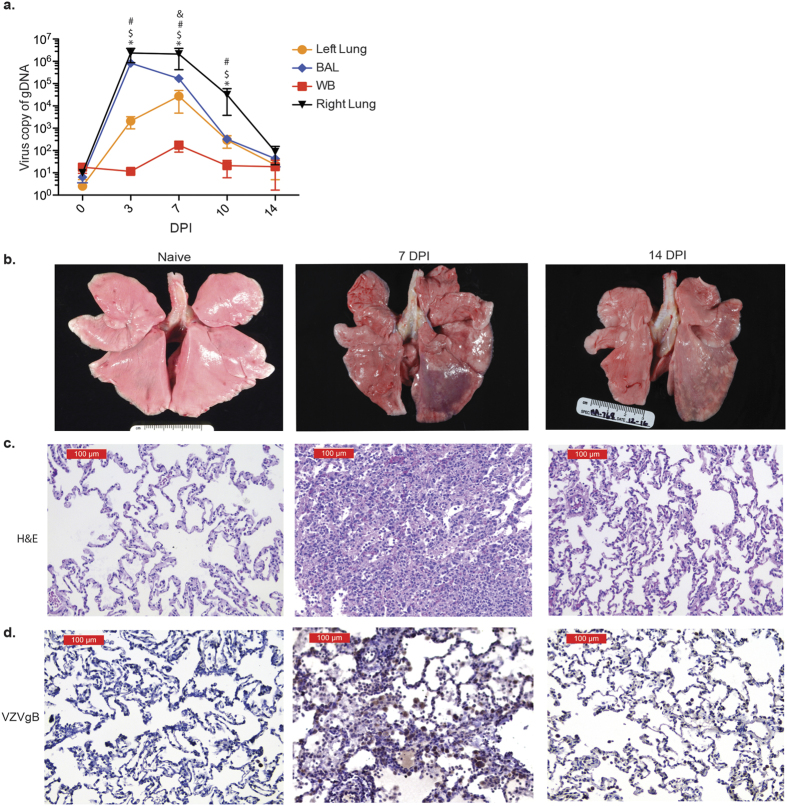
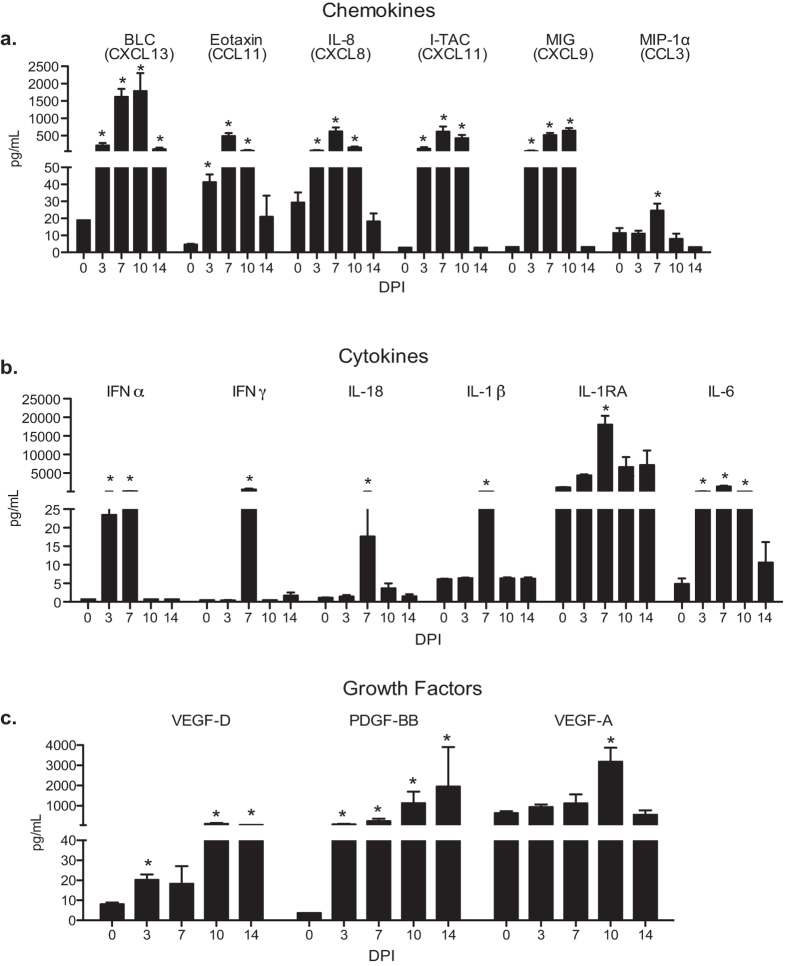
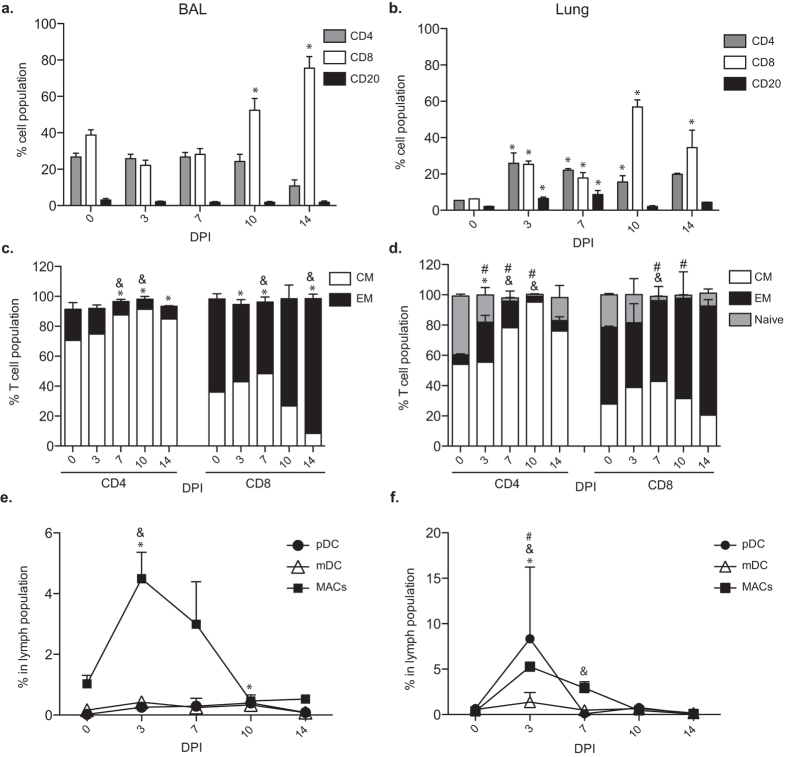
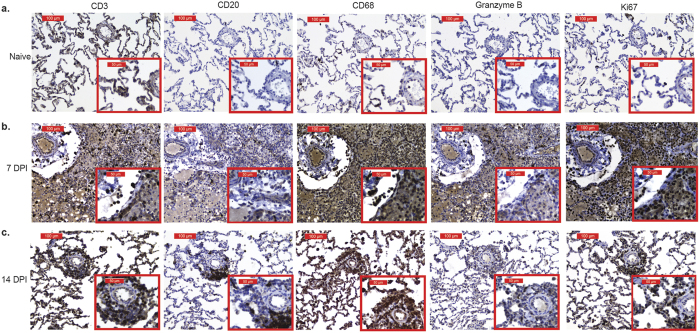
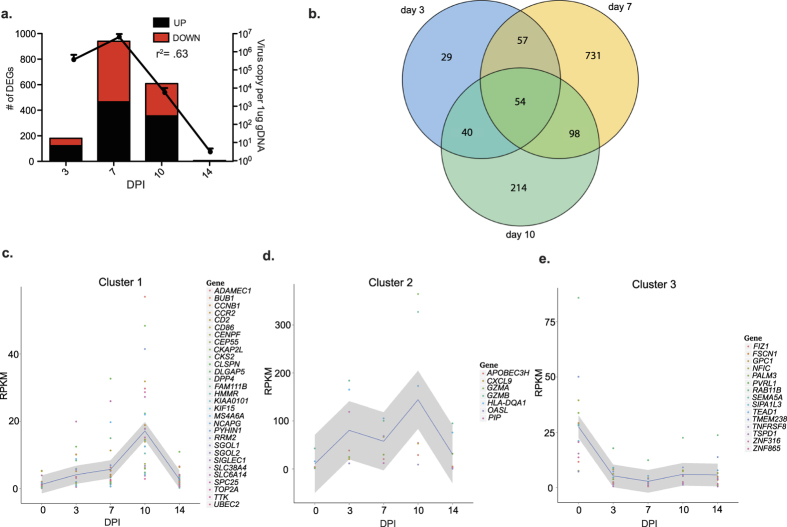
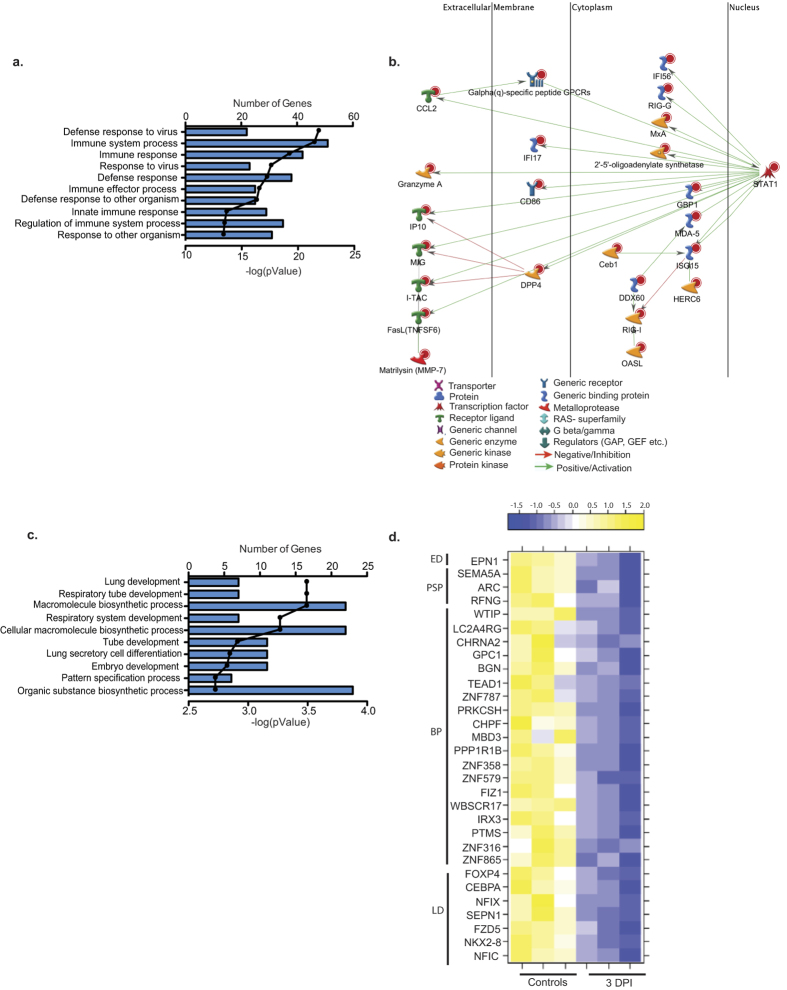
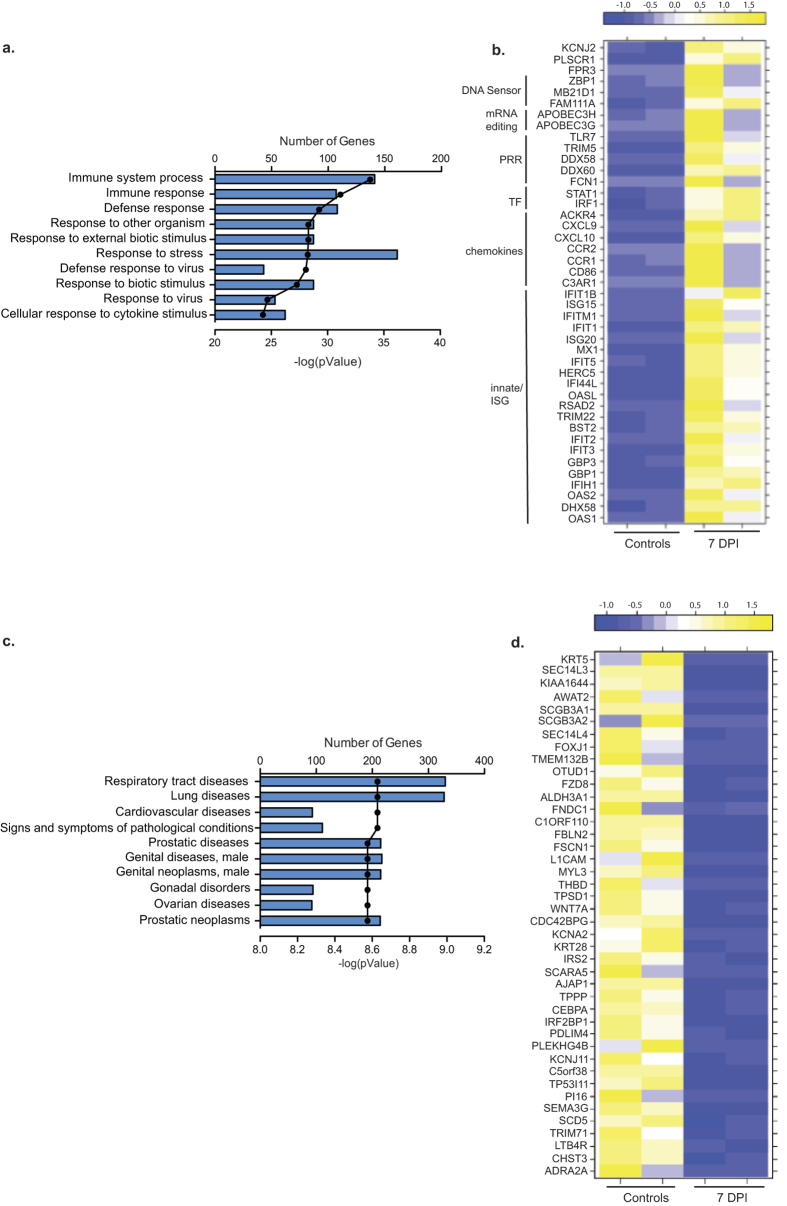
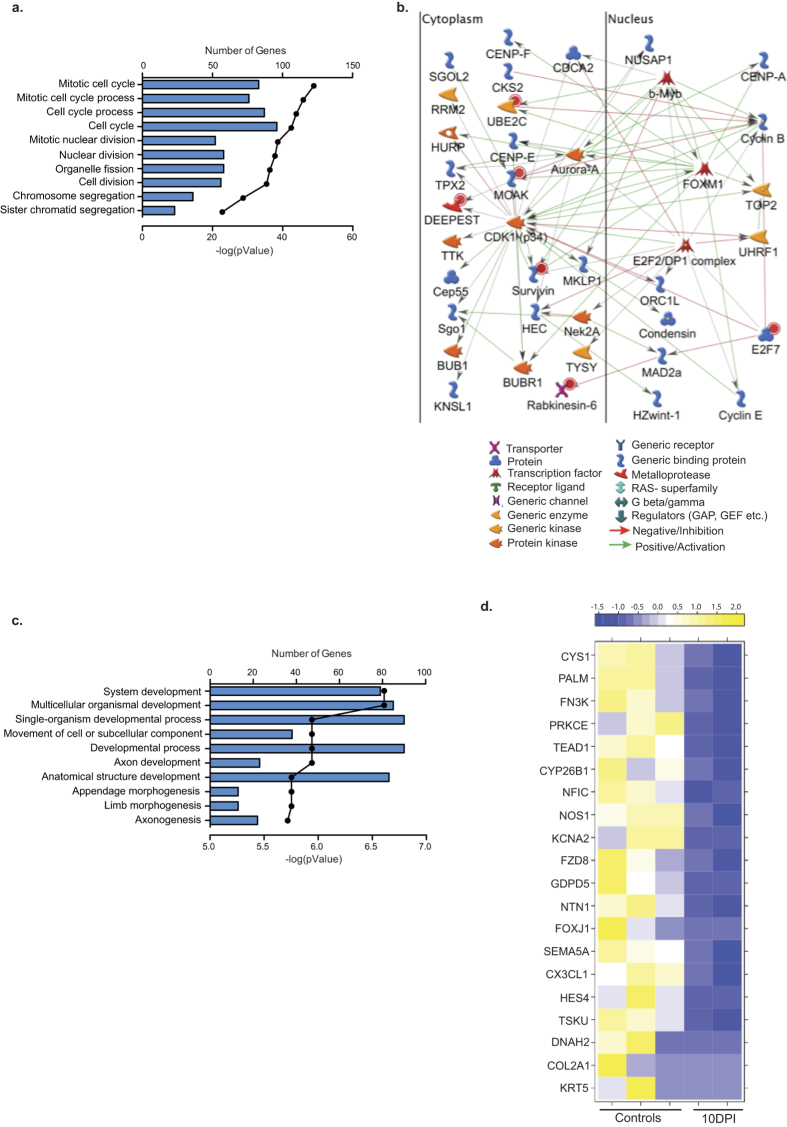
Varicella Zoster Virus (VZV) is the causative agent of varicella and herpes zoster. Although it is well established that VZV is transmitted via the respiratory route, the host-pathogen interactions during acute VZV infection in the lungs remain poorly understood due to limited access to clinical samples. To address these gaps in our knowledge, we leveraged a nonhuman primate model of VZV infection where rhesus macaques are intrabronchially challenged with the closely related Simian Varicella Virus (SVV). Acute infection is characterized by immune infiltration of the lung airways, a significant up-regulation of genes involved in antiviral-immunity, and a down-regulation of genes involved in lung development. This is followed by a decrease in viral loads and increased expression of genes associated with cell cycle and tissue repair. These data provide the first characterization of the host response required to control varicella virus replication in the lung and provide insight into mechanisms by which VZV infection can cause lung injury in an immune competent host.
Figures
Similar articles
-
Intrabronchial infection of rhesus macaques with simian varicella virus results in a robust immune response in the lungs.J Virol. 2014 Nov;88(21):12777-92. doi: 10.1128/JVI.01814-14. Epub 2014 Aug 20. J Virol. 2014. PMID: 25142604 Free PMC article.
-
Acute Simian Varicella Virus Infection Causes Robust and Sustained Changes in Gene Expression in the Sensory Ganglia.J Virol. 2016 Nov 14;90(23):10823-10843. doi: 10.1128/JVI.01272-16. Print 2016 Dec 1. J Virol. 2016. PMID: 27681124 Free PMC article.
-
Abortive intrabronchial infection of rhesus macaques with varicella-zoster virus provides partial protection against simian varicella virus challenge.J Virol. 2015 Feb;89(3):1781-93. doi: 10.1128/JVI.03124-14. Epub 2014 Nov 19. J Virol. 2015. PMID: 25410871 Free PMC article.
-
Varicella Virus-Host Interactions During Latency and Reactivation: Lessons From Simian Varicella Virus.Front Microbiol. 2018 Dec 21;9:3170. doi: 10.3389/fmicb.2018.03170. eCollection 2018. Front Microbiol. 2018. PMID: 30619226 Free PMC article. Review.
-
Comparative Analysis of the Simian Varicella Virus and Varicella Zoster Virus Genomes.Viruses. 2022 Apr 19;14(5):844. doi: 10.3390/v14050844. Viruses. 2022. PMID: 35632586 Free PMC article. Review.
Cited by
-
Transcriptional and functional remodeling of lung-resident T cells and macrophages by Simian varicella virus infection.Front Immunol. 2024 Jun 3;15:1408212. doi: 10.3389/fimmu.2024.1408212. eCollection 2024. Front Immunol. 2024. PMID: 38887303 Free PMC article.
-
Alveolar barrier disruption in varicella pneumonia is associated with neutrophil extracellular trap formation.JCI Insight. 2020 Nov 5;5(21):e138900. doi: 10.1172/jci.insight.138900. JCI Insight. 2020. PMID: 33021967 Free PMC article.
-
Insights into the pathogenesis of varicella viruses.Curr Clin Microbiol Rep. 2019 Sep;6(3):156-165. doi: 10.1007/s40588-019-00119-2. Epub 2019 Jul 6. Curr Clin Microbiol Rep. 2019. PMID: 32999816 Free PMC article.
-
Humanized Severe Combined Immunodeficient (SCID) Mouse Models for Varicella-Zoster Virus Pathogenesis.Curr Top Microbiol Immunol. 2023;438:135-161. doi: 10.1007/82_2022_255. Curr Top Microbiol Immunol. 2023. PMID: 35292858
-
Blood-Epigenetic Biomarker Associations with Tumor Immunophenotype in Patients with Urothelial Carcinoma from JAVELIN Bladder 100.Cancers (Basel). 2025 Jul 14;17(14):2332. doi: 10.3390/cancers17142332. Cancers (Basel). 2025. PMID: 40723216 Free PMC article.
References
-
- Moffat J., Ku C. C., Zerboni L., Sommer M. & Arvin A. In Human Herpesviruses: Biology, Therapy, and Immunoprophylaxis (eds Arvin A. et al..) (2007). - PubMed
-
- Feldman S. Varicella-zoster virus pneumonitis. Chest 106, 22S–27S (1994). - PubMed
-
- Mohsen A. H. & McKendrick M. Varicella pneumonia in adults. Eur Respir J 21, 886–891 (2003). - PubMed
-
- Gray W. L. & Oakes J. E. Simian varicella virus DNA shares homology with human varicella-zoster virus DNA. Virology 136, 241–246 (1984). - PubMed
Grants and funding
LinkOut - more resources
Full Text Sources
Other Literature Sources
