

Large field-of-view movement-compensated intrinsic optical signal imaging for the characterization of the haemodynamic response to spreading depolarizations in large gyrencephalic brains
- PMID: 27677673
- PMCID: PMC5435296
- DOI: 10.1177/0271678X16668988
Large field-of-view movement-compensated intrinsic optical signal imaging for the characterization of the haemodynamic response to spreading depolarizations in large gyrencephalic brains
Abstract
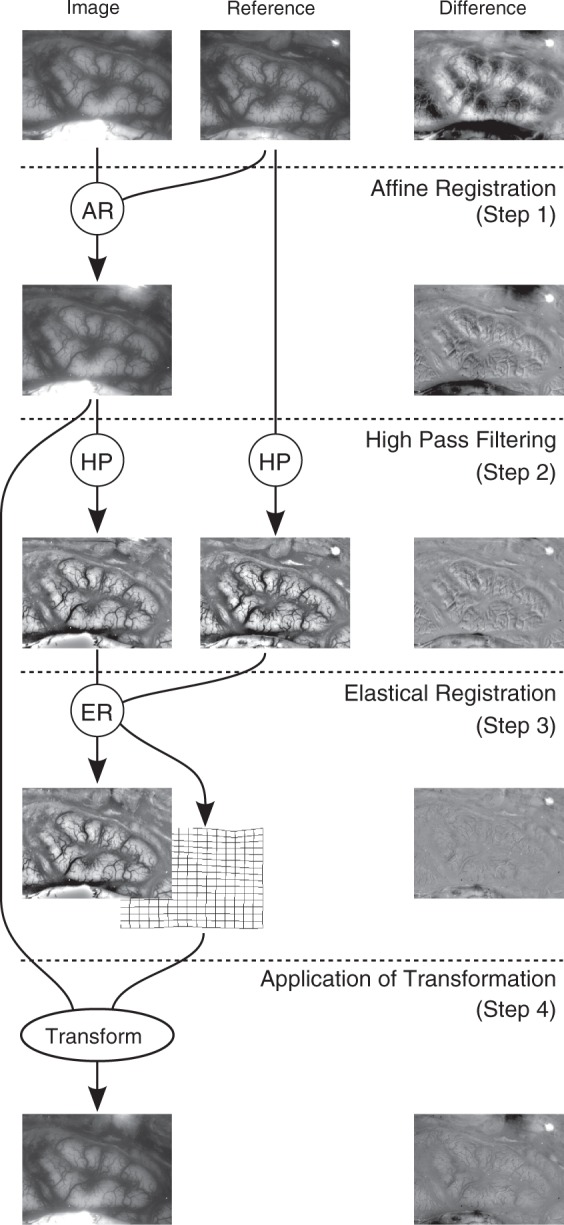
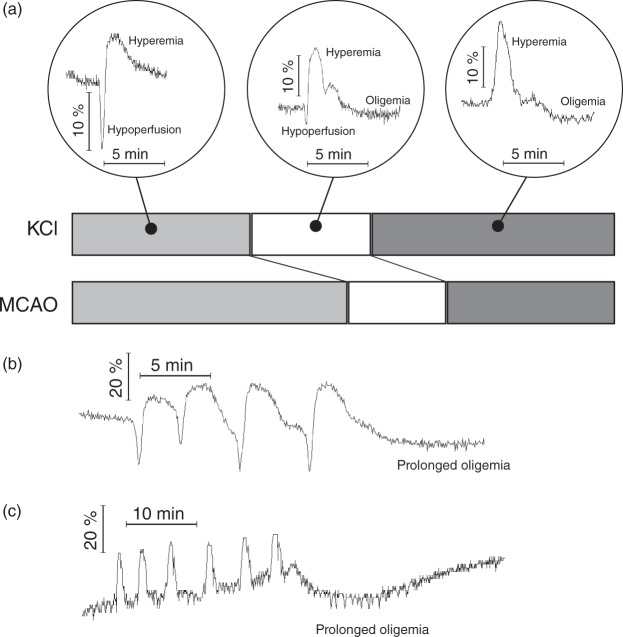
Haemodynamic responses to spreading depolarizations (SDs) have an important role during the development of secondary brain damage. Characterization of the haemodynamic responses in larger brains, however, is difficult due to movement artefacts. Intrinsic optical signal (IOS) imaging, laser speckle flowmetry (LSF) and electrocorticography were performed in different configurations in three groups of in total 18 swine. SDs were elicited by topical application of KCl or occurred spontaneously after middle cerebral artery occlusion. Movement artefacts in IOS were compensated by an elastic registration algorithm during post-processing. Using movement-compensated IOS, we were able to differentiate between four components of optical changes, corresponding closely with haemodynamic variations measured by LSF. Compared with ECoG and LSF, our setup provides higher spatial and temporal resolution, as well as a better signal-to-noise ratio. Using IOS alone, we could identify the different zones of infarction in a large gyrencephalic middle cerebral artery occlusion pig model. We strongly suggest movement-compensated IOS for the investigation of the role of haemodynamic responses to SDs during the development of secondary brain damage and in particular to examine the effect of potential therapeutic interventions in gyrencephalic brains.
Keywords: Brain imaging; acute stroke; animal models; intrinsic optical imaging; spreading depression.
Figures
Similar articles
-
Detection of spreading depolarizations in a middle cerebral artery occlusion model in swine.Acta Neurochir (Wien). 2020 Mar;162(3):581-592. doi: 10.1007/s00701-019-04132-8. Epub 2020 Jan 15. Acta Neurochir (Wien). 2020. PMID: 31940093
-
Cortical spreading depression dynamics can be studied using intrinsic optical signal imaging in gyrencephalic animal cortex.Acta Neurochir Suppl. 2013;118:93-7. doi: 10.1007/978-3-7091-1434-6_16. Acta Neurochir Suppl. 2013. PMID: 23564111
-
Ketamine modulation of the haemodynamic response to spreading depolarization in the gyrencephalic swine brain.J Cereb Blood Flow Metab. 2017 May;37(5):1720-1734. doi: 10.1177/0271678X16646586. Epub 2016 Jan 1. J Cereb Blood Flow Metab. 2017. PMID: 27126324 Free PMC article.
-
The continuum of spreading depolarizations in acute cortical lesion development: Examining Leão's legacy.J Cereb Blood Flow Metab. 2017 May;37(5):1571-1594. doi: 10.1177/0271678X16654495. Epub 2016 Jan 1. J Cereb Blood Flow Metab. 2017. PMID: 27328690 Free PMC article. Review.
-
Spreading depolarization monitoring in neurocritical care of acute brain injury.Curr Opin Crit Care. 2017 Apr;23(2):94-102. doi: 10.1097/MCC.0000000000000395. Curr Opin Crit Care. 2017. PMID: 28207602 Review.
Cited by
-
Mild hypothermia reduces spreading depolarizations and infarct size in a swine model.J Cereb Blood Flow Metab. 2023 Jun;43(6):999-1009. doi: 10.1177/0271678X231154604. Epub 2023 Feb 1. J Cereb Blood Flow Metab. 2023. PMID: 36722153 Free PMC article.
-
Characterization of spreading depolarizations in swine following superior sagittal sinus occlusion: a novel gyrencephalic model study.Thromb J. 2025 Feb 12;23(1):15. doi: 10.1186/s12959-025-00689-w. Thromb J. 2025. PMID: 39940023 Free PMC article.
-
Cerebrovascular Pressure Reactivity According to Long-Pressure Reactivity Index During Spreading Depolarizations in Aneurysmal Subarachnoid Hemorrhage.Neurocrit Care. 2023 Aug;39(1):135-144. doi: 10.1007/s12028-022-01669-y. Epub 2023 Jan 25. Neurocrit Care. 2023. PMID: 36697998 Free PMC article.
-
Spatial and temporal frequency band changes during infarct induction, infarct progression, and spreading depolarizations in the gyrencephalic brain.Front Neurosci. 2022 Dec 5;16:1025967. doi: 10.3389/fnins.2022.1025967. eCollection 2022. Front Neurosci. 2022. PMID: 36570832 Free PMC article.
-
Incidence, hemodynamic, and electrical characteristics of spreading depolarization in a swine model are affected by local but not by intravenous application of magnesium.J Cereb Blood Flow Metab. 2016 Dec;36(12):2051-2057. doi: 10.1177/0271678X16671317. Epub 2016 Sep 28. J Cereb Blood Flow Metab. 2016. PMID: 27683450 Free PMC article.
References
-
- Strong AJ, Fabricius M, Boutelle MG, et al. Spreading and synchronous depressions of cortical activity in acutely injured human brain. Stroke J Cereb Circ 2002; 33: 2738–2743. - PubMed
-
- Hartings JA, Bullock MR, Okonkwo DO, et al. Spreading depolarisations and outcome after traumatic brain injury: a prospective observational study. Lancet Neurol 2011; 10: 1058–1064. - PubMed
-
- Dohmen C, Sakowitz OW, Fabricius M, et al. Spreading depolarizations occur in human ischemic stroke with high incidence. Ann Neurol 2008; 63: 720–728. - PubMed
-
- Dreier JP, Woitzik J, Fabricius M, et al. Delayed ischaemic neurological deficits after subarachnoid haemorrhage are associated with clusters of spreading depolarizations. Brain J Neurol 2006; 129: 3224–3237. - PubMed
-
- Fabricius M, Fuhr S, Bhatia R, et al. Cortical spreading depression and peri-infarct depolarization in acutely injured human cerebral cortex. Brain J Neurol 2006; 129: 778–790. - PubMed
MeSH terms
LinkOut - more resources
Full Text Sources
Other Literature Sources
Medical
