. 2016 Sep 28:6:34447.
doi: 10.1038/srep34447.

A new design for a green calcium indicator with a smaller size and a reduced number of calcium-binding sites

Affiliations

A new design for a green calcium indicator with a smaller size and a reduced number of calcium-binding sites

Natalia V Barykina et al. Sci Rep. .

Abstract

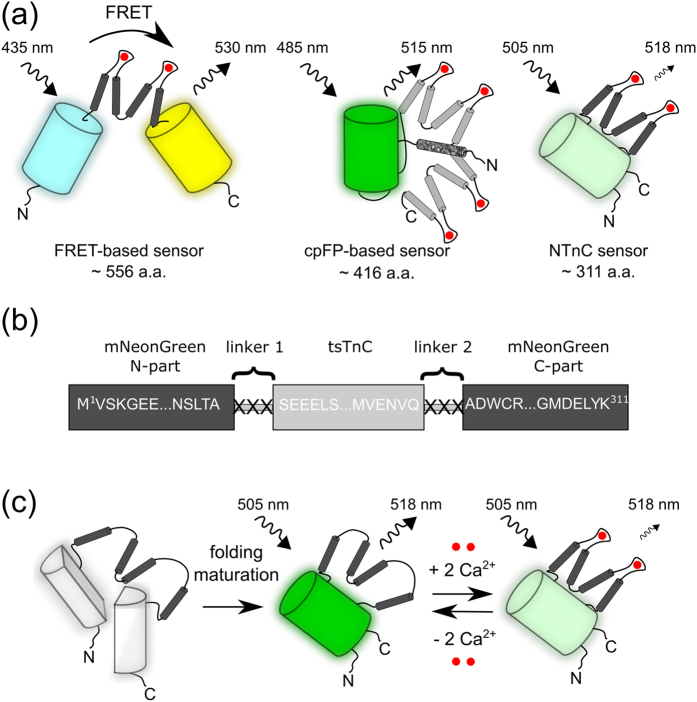
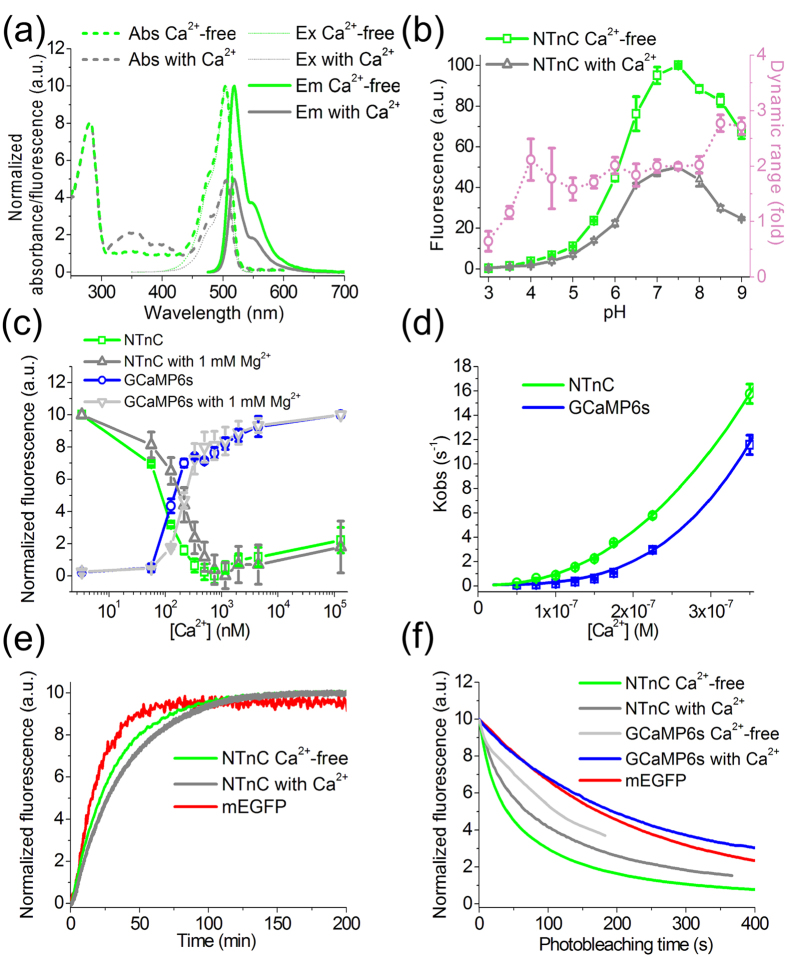
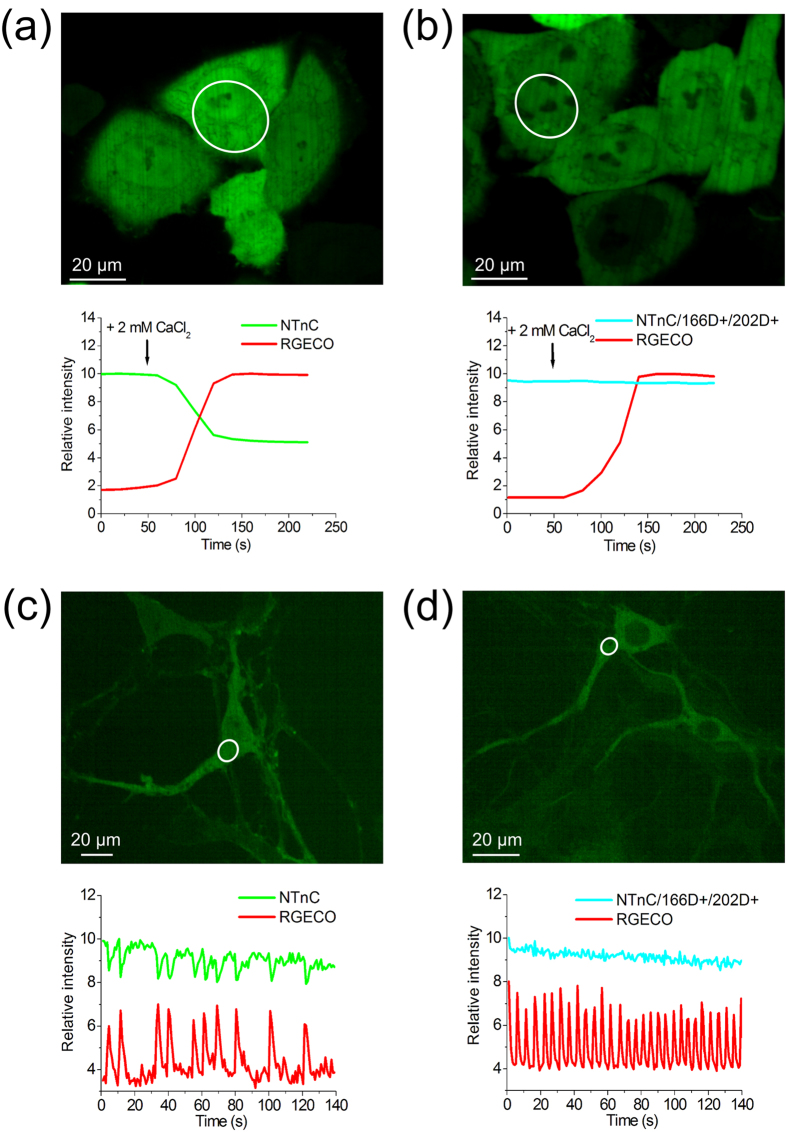
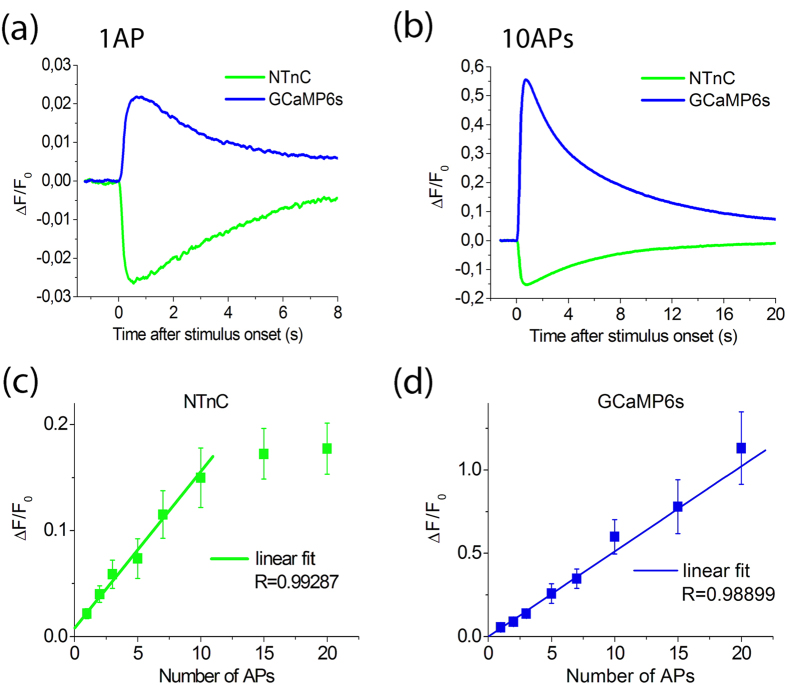
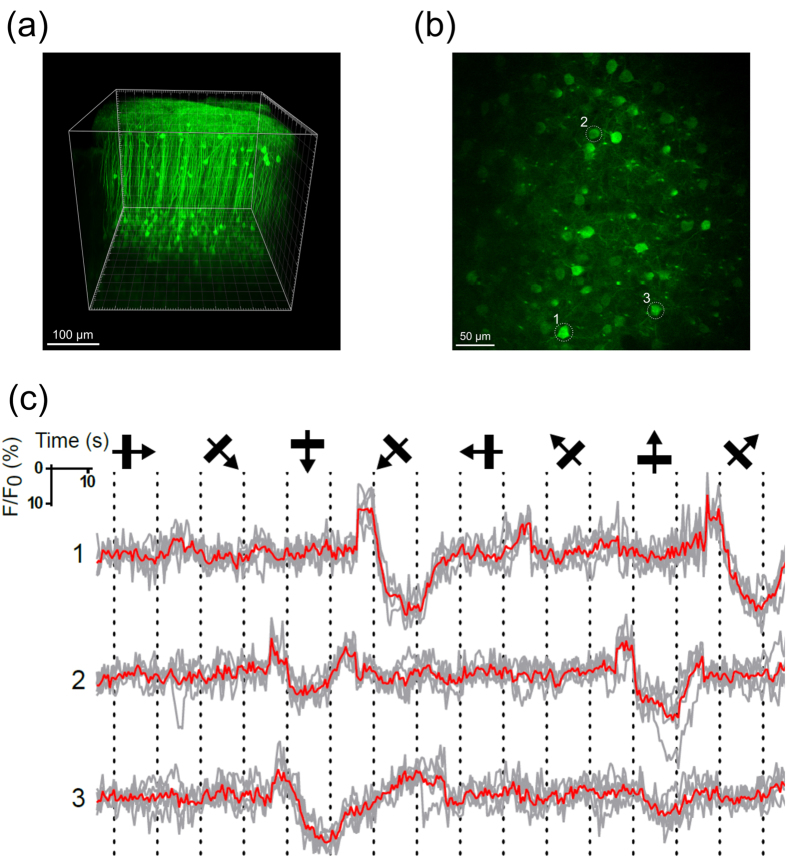
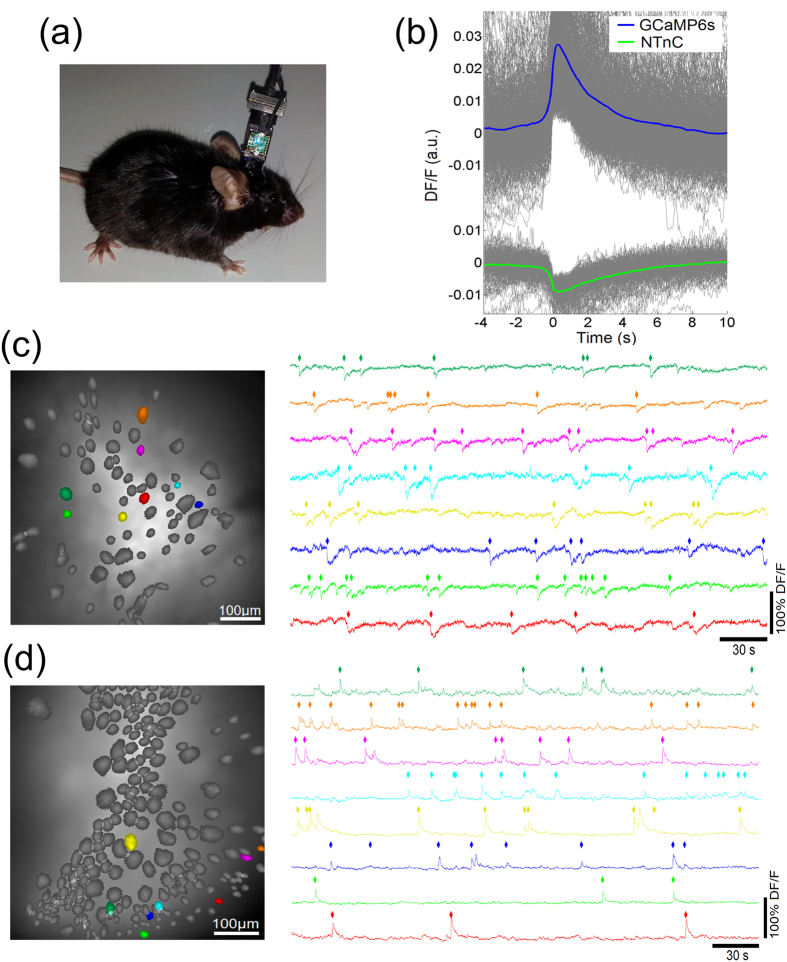
Genetically encoded calcium indicators (GECIs) are mainly represented by two- or one-fluorophore-based sensors. One type of two-fluorophore-based sensor, carrying Opsanus troponin C (TnC) as the Ca2+-binding moiety, has two binding sites for calcium ions, providing a linear response to calcium ions. One-fluorophore-based sensors have four Ca2+-binding sites but are better suited for in vivo experiments. Herein, we describe a novel design for a one-fluorophore-based GECI with two Ca2+-binding sites. The engineered sensor, called NTnC, uses TnC as the Ca2+-binding moiety, inserted in the mNeonGreen fluorescent protein. Monomeric NTnC has higher brightness and pH-stability in vitro compared with the standard GECI GCaMP6s. In addition, NTnC shows an inverted fluorescence response to Ca2+. Using NTnC, we have visualized Ca2+ dynamics during spontaneous activity of neuronal cultures as confirmed by control NTnC and its mutant, in which the affinity to Ca2+ is eliminated. Using whole-cell patch clamp, we have demonstrated that NTnC dynamics in neurons are similar to those of GCaMP6s and allow robust detection of single action potentials. Finally, we have used NTnC to visualize Ca2+ neuronal activity in vivo in the V1 cortical area in awake and freely moving mice using two-photon microscopy or an nVista miniaturized microscope.


Figures

Figure 1
Figure 1. Schematic representation of the different designs of GECIs, composition of the original library, and suggested stages of NTnC Ca2+ indicator function.
(a) Schematic representation of FRET-based, cpFP-based, and NTnC sensor families in the Ca2+-bound state. FPs are shown as cylinders, and tsTnC, CaM and M13-peptide are shown in dark grey, light grey, and speckled grey, respectively. (b) The original library for NTnC consisted of the sensory C-terminal minimal domain of TnC (tsTnC) inserted into the mNeonGreen fluorescent protein between residues 145 and 146, with randomized linkers located between the fluorescent and sensory components. (c) Schematic representation of the NTnC indicator formation and functioning. The mNeonGreen component is shown as a cylinder, which reversibly quenches upon binding with two Ca2+ ions (red dots).
Figure 2
Figure 2. In vitro properties of purified NTnC protein.
(a) Absorbance, excitation and emission spectra of NTnC in Ca2+-free and Ca2+-bound states. (b) Intensity and dynamic range of NTnC as a function of pH. The dynamic range (fold) at each pH value was determined as the ratio of NTnC fluorescence intensity in the absence of Ca2+ to that in the presence of Ca2+. (c) Ca2+ titration curves for NTnC and GCaMP6s in the absence or presence of 1 mM MgCl2. (d) Observed Ca2+ association rates at moderate Ca2+ concentrations (in the range of 0–350 nM) overlaid with the fitting curves (kobs = kon × [Ca2+]n + koff, see Table 1 for the fitting parameters kon and n). (e) Maturation curves for NTnC in the Ca2+-free (green line) and Ca2+-bound (grey line) states and for mEGFP (red line). (f) Photobleaching curves for NTnC and GCaMP6s in Ca2+-free and Ca2+-bound states and for mEGFP. Error represents the standard error of the estimate for the average of three records.
Figure 3
Figure 3. Response of NTnC to variations in Ca2+ concentration in HeLa cells and neuronal cultures.
(a) HeLa Kyoto cells co-expressing NTnC and R-GECO1. The graph illustrates green and red fluorescence changes in response to the addition of 2 mM CaCl2 and 5 μM ionomycin. (b) Co-expression of the NTnC/166D+/202D+ mutant, which has inhibited binding affinity, together with R-GECO1 in HeLa Kyoto cells. The graph shows the changes in green and red fluorescence as a result of the addition of 2 mM CaCl2 and 5 μM ionomycin. R-GECO1 is co-expressed as a control and confirms the increase in Ca2+ concentration. (c) Dissociated neuronal culture co-expressing NTnC and R-GECO1 sensors. The graph shows the green and red fluorescence changes of the NTnC and R-GECO1 indicators as a result of spontaneous neuronal activity. (d) Dissociated neuronal culture co-expressing the NTnC/166D+/202D+ mutant and R-GECO1. Graph shows green and red fluorescence changes of the NTnC/166D+/202D+ mutant and R-GECO1 as a result of spontaneous neuronal activity. (ad) For cellular images, the red channel is not shown. The graphs illustrate changes in green and red fluorescence in the areas indicated with white circles.
Figure 4
Figure 4. Fluorescence changes in response to intracellularly induced APs in cultured neurons expressing the indicators NTnC and GCaMP6s.
(a) Response to a single AP. (b) Response to a train of 10 APs at 50 Hz. All responses were averaged across all recorded neurons in different wells. Note similar signal amplitudes and response kinetics induced by single APs in NTnC and GCaMP6s cells. (c,d) Dependence of the amplitudes of responses induced by different numbers of APs in neurons expressing NTnC (N = 6) and GCaMP6s (N = 7). Note that in the range from 1 to 10 APs, dependence is linear for both sensors. The linear regression shown in the figure was calculated for the 1–10 APs subset for NTnC and for the whole data range (1–20 APs) for GCaMP6s. Values are shown as the means ± SEM.
Figure 5
Figure 5. In vivo complex visual stimuli evoked neuronal Ca2+ activity in the mouse cortex as visualized with the calcium sensor NTnC and two-photon microscopy.
(a) Representative image of a 3D volume reconstruction of the mouse V1 at 11 weeks following stereotactic injection of rAAV (AAV-CAG-NTnC) viral particles. (b) Two-photon image of cells in a mouse visual cortex visualized with the calcium indicator NTnC, imaged in vivo at 460 μm below the pial surface. (c) Time-courses of cells 1–3, as marked in (b). Average Ca2+ traces (ΔF/F0) from three neurons during stimulation with the presentation of drifting gratings (eight directions, five repetitions). The directions of the drifting gratings are shown; dashed lines show drift onset and offset, grey – individual trial, red – mean signal over all five repetitions.
Figure 6
Figure 6. In vivo neuronal Ca2+ activity in freely behaving mice visualized with the calcium indicators NTnC and GCaMP6s and an nVista HD system.
(a) Photo of an nVista HD miniature head-mounted microscope attached to a mouse’s head. (b) Mean spikes in the calcium indicators NTnC and GCaMP6s; spikes were aligned at the moment of 4 MAD threshold crossing (0 s); only single spikes were considered, i.e., a spike was taken into account only if there were no other spikes for 10 s after and 4 s before it. (c) Spatial filters and sample traces obtained from a 5-min imaging session with a freely behaving mouse expressing NTnC; rhombi over traces denote spikes that were counted as 4 MAD threshold crossings. (d) Spatial filters and sample traces obtained from a 5-min imaging session with a freely behaving mouse expressing GCaMP6s. The sensors NTnC and GCaMP6s were delivered to brain cortices with rAAV (AAV-CAG-NTnC and AAV-CAG-GCaMP6s) particles.

References

    1. Miyawaki A. et al. Fluorescent indicators for Ca2+ based on green fluorescent proteins and calmodulin. Nature 388, 882–887 (1997). - PubMed
    1. Rose T., Goltstein P. M., Portugues R. & Griesbeck O. Putting a finishing touch on GECIs. Front Mol Neurosci. 7, 88 (2014). - PMC - PubMed
    1. Thestrup T. et al. Optimized ratiometric calcium sensors for functional in vivo imaging of neurons and T lymphocytes. Nature methods 11, 175–182 (2014). - PubMed
    1. Nakai J., Ohkura M. & Imoto K. A high signal-to-noise Ca(2+) probe composed of a single green fluorescent protein. Nature biotechnology 19, 137–141 (2001). - PubMed
    1. Podor B. et al. Comparison of genetically encoded calcium indicators for monitoring action potentials in mammalian brain by two-photon excitation fluorescence microscopy. Neurophotonics 2, 021014 (2015). - PMC - PubMed