

Adenylyl cyclase 3 haploinsufficiency confers susceptibility to diet-induced obesity and insulin resistance in mice
- PMID: 27678003
- PMCID: PMC5039768
- DOI: 10.1038/srep34179
Adenylyl cyclase 3 haploinsufficiency confers susceptibility to diet-induced obesity and insulin resistance in mice
Abstract
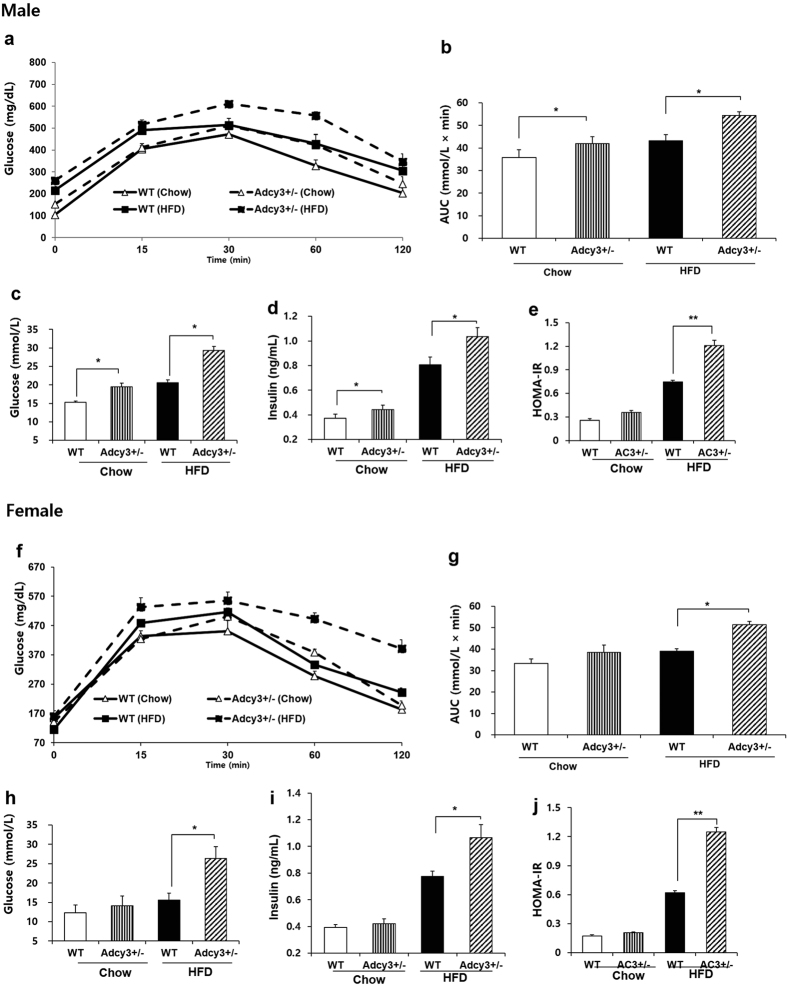
Adenylyl cyclase 3 (Adcy3), a member of the mammalian adenylyl cyclase family responsible for generating the second messenger cAMP, has long been known to play an essential role in olfactory signal transduction. Here, we demonstrated that Adcy3 heterozygous null mice displayed increased visceral adiposity in the absence of hyperphagia and developed abnormal metabolic features characterized by impaired insulin sensitivity, dyslipidemia, and increased plasma levels of proinflammatory cytokines on both chow and high-fat diet (HFD). Of note, HFD decreased the Adcy3 expression in white adipose tissue, liver, and muscle. We also report for the first time that Adcy3 haploinsufficiency resulted in reduced expression of genes involved in thermogenesis, fatty acid oxidation, and insulin signaling, with enhanced expression of genes related to adipogenesis in peripheral tissues of mice. In conclusion, these findings suggest that cAMP signals generated by Adcy3 in peripheral tissues may play a pivotal role in modulating obesity and insulin sensitivity.
Figures


Similar articles
-
Obesity Resistance and Enhanced Insulin Sensitivity in Ahnak-/- Mice Fed a High Fat Diet Are Related to Impaired Adipogenesis and Increased Energy Expenditure.PLoS One. 2015 Oct 14;10(10):e0139720. doi: 10.1371/journal.pone.0139720. eCollection 2015. PLoS One. 2015. PMID: 26466345 Free PMC article.
-
Haploinsufficiency of the retinoblastoma protein gene reduces diet-induced obesity, insulin resistance, and hepatosteatosis in mice.Am J Physiol Endocrinol Metab. 2009 Jul;297(1):E184-93. doi: 10.1152/ajpendo.00163.2009. Epub 2009 May 5. Am J Physiol Endocrinol Metab. 2009. PMID: 19417128
-
Carvacrol prevents diet-induced obesity by modulating gene expressions involved in adipogenesis and inflammation in mice fed with high-fat diet.J Nutr Biochem. 2012 Feb;23(2):192-201. doi: 10.1016/j.jnutbio.2010.11.016. Epub 2011 Mar 29. J Nutr Biochem. 2012. PMID: 21447440
-
Adenylate cyclase 3: a new target for anti-obesity drug development.Obes Rev. 2016 Sep;17(9):907-14. doi: 10.1111/obr.12430. Epub 2016 Jun 3. Obes Rev. 2016. PMID: 27256589 Review.
-
Adenylate cyclase 3: a potential genetic link between obesity and major depressive disorder.Physiol Genomics. 2024 Jan 1;56(1):1-8. doi: 10.1152/physiolgenomics.00056.2023. Epub 2023 Nov 13. Physiol Genomics. 2024. PMID: 37955134 Free PMC article. Review.
Cited by
-
Paternal High-Protein Diet Programs Offspring Insulin Sensitivity in a Sex-Specific Manner.Biomolecules. 2021 May 18;11(5):751. doi: 10.3390/biom11050751. Biomolecules. 2021. PMID: 34069853 Free PMC article.
-
A Mutation in the Transmembrane Domain of Adenylate Cyclase 3 Impairs Enzymatic Function to Cause Sex-Specific Depression- and Anxiety-Like Behaviors and Food Seeking in a Rat Model.Genes Brain Behav. 2025 Jun;24(3):e70028. doi: 10.1111/gbb.70028. Genes Brain Behav. 2025. PMID: 40492272 Free PMC article.
-
Early fish domestication affects methylation of key genes involved in the rapid onset of the farmed phenotype.Epigenetics. 2022 Oct;17(10):1281-1298. doi: 10.1080/15592294.2021.2017554. Epub 2022 Jan 10. Epigenetics. 2022. PMID: 35006036 Free PMC article.
-
High-Throughput Screening of Mouse Gene Knockouts Identifies Established and Novel High Body Fat Phenotypes.Diabetes Metab Syndr Obes. 2021 Aug 28;14:3753-3785. doi: 10.2147/DMSO.S322083. eCollection 2021. Diabetes Metab Syndr Obes. 2021. PMID: 34483672 Free PMC article.
-
Optogenetic activation of UCP1-dependent thermogenesis in brown adipocytes.iScience. 2023 Apr 1;26(4):106560. doi: 10.1016/j.isci.2023.106560. eCollection 2023 Apr 21. iScience. 2023. PMID: 37123235 Free PMC article.
References
-
- Hanoune J. & Defer N. Regulation and role of adenylyl cyclase isoforms. Annu. Rev. Pharmacol. 41, 145–174 (2001). - PubMed
LinkOut - more resources
Full Text Sources
Other Literature Sources
Molecular Biology Databases
