. 2016 Oct;42(4):637-658.
doi: 10.1007/s10867-016-9427-2. Epub 2016 Sep 27.

Tumor proliferation and diffusion on percolation clusters

Affiliations

Tumor proliferation and diffusion on percolation clusters

Chongming Jiang et al. J Biol Phys. 2016 Oct.

Abstract

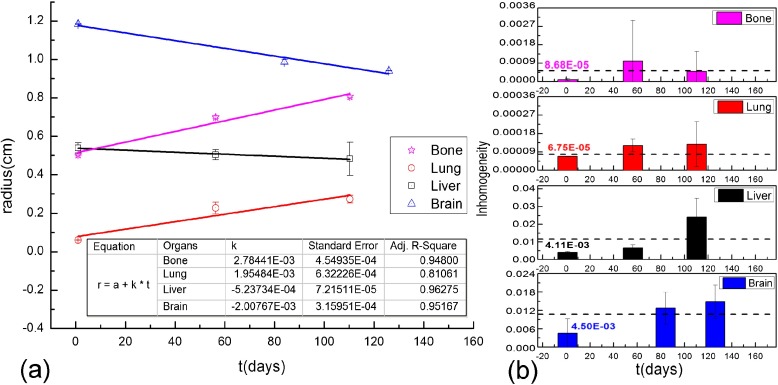
We study in silico the influence of host tissue inhomogeneity on tumor cell proliferation and diffusion by simulating the mobility of a tumor on percolation clusters with different homogeneities of surrounding tissues. The proliferation and diffusion of a tumor in an inhomogeneous tissue could be characterized in the framework of the percolation theory, which displays similar thresholds (0.54, 0.44, and 0.37, respectively) for tumor proliferation and diffusion in three kinds of lattices with 4, 6, and 8 connecting near neighbors. Our study reveals the existence of a critical transition concerning the survival and diffusion of tumor cells with leaping metastatic diffusion movement in the host tissues. Tumor cells usually flow in the direction of greater pressure variation during their diffusing and infiltrating to a further location in the host tissue. Some specific sites suitable for tumor invasion were observed on the percolation cluster and around these specific sites a tumor can develop into scattered tumors linked by some advantage tunnels that facilitate tumor invasion. We also investigate the manner that tissue inhomogeneity surrounding a tumor may influence the velocity of tumor diffusion and invasion. Our simulation suggested that invasion of a tumor is controlled by the homogeneity of the tumor microenvironment, which is basically consistent with the experimental report by Riching et al. as well as our clinical observation of medical imaging. Both simulation and clinical observation proved that tumor diffusion and invasion into the surrounding host tissue is positively correlated with the homogeneity of the tissue.

Keywords: Inhomogeneity; Invasive and metastatic diffusion; Percolation; Reaction–diffusion systems; Tumor.


Conflict of interest statement

Compliance with ethical standards Ethical approval This study did not involve any human experiments or treatment processes. The physiological and clinical images of tumors were acquired from ordinary medical examinations of patients at the Sun Yat-sen University Cancer Center. These examinations were carried out for therapy only and no additional drugs or measures were used. This study was approved by the ethics committee of the Sun Yat-sen University Cancer Center and every effort was made to maximize the protection of the patients’ privacy (e.g., anonymous analysis of data). The research materials and results were used for scientific purposes without any conflict of interest. All procedures performed in studies involving human participants were in accordance with the ethical standards of the institutional and/or national research committee and with the 1964 Helsinki Declaration and its later amendments or comparable ethical standards.

Figures

Fig. 1
Fig. 1
Schematic diagram of tumor proliferation and diffusion into surrounding tissue. Physiological diffusion and invasion in a tumor (left-hand side) and in a percolation cluster (right-hand side). The tumor cells diffusion is affected by the inhomogeneity of surrounding tissue and shows an anisotropic distribution. To investigate the influence of the inhomogeneity of the surrounding tissue, the Monte Carlo method and the percolation theory were used to produce a discrete two-dimensional lattice given by a square lattice with sides X × Y, which represented the inhomogeneous surrounding tissue. The tumor cell could pass through the open bonds (bold lines) and occupy these open sites (solid points) but was hindered by the blocked bonds and sites. More details are given in the text
Fig. 2
Fig. 2
The inhomogeneity of the percolation cluster affects tumor proliferation and diffusion. Figs ad show the tumor proliferation and diffusion at different site-occupation probabilities P. (a) p = 1.0. (b) p = 0.75. (c) p = 0.54. (d) p < 0.54. As P decreased, tumor evolution was inhibited and the active contour of the tumor cells shrunk. In this study, the tumor cells were able to survive and proliferate from a small tumor into a widespread one when P was greater than the threshold of 0.54. When the occupation probability P was lower than the threshold, the tumor cells in the region died. Simulation parameters: X*Y = 50*50, t = 100. The remaining parameters were fixed
Fig. 3
Fig. 3
The dependence of probability α on site-occupation probability P. The inset is the relationship of P and α over time. α is the probability that tumor cells can pass through the cluster and is defined as α = M/N*100%, where N is the total number of percolation clusters for each occupation probability P, N was set to 10 000 and M is the statistical number of tumor cells that can reach the right edge of the cluster for 10 000 repetitions. For each value of α, the statistical errors were estimated from 10 independent simulation results (error bars, SD). Simulation parameters: X*Y = 50*50. The remaining parameters were fixed
Fig. 4
Fig. 4
The relationship between P and α in three kinds of lattice constructors. Turning points were observed in the 4-neighbor, 6-neighbor and 8-neighbor lattice percolations (LNN = 4, 6, and 8) and are marked with arrows. The curves of α versus P are similar in trend but the locations of the turning points, i.e., the thresholds, shift from 0.54 to 0.44 and 0.37, respectively, with increasing LNN. Simulation parameters: X*Y = 50*50, t = 100. The remaining parameters were fixed
Fig. 5
Fig. 5
The peak location of tumor diffusion at different times. a The schematic peak location. b The specific location of the tumor cell peak emerging on the percolation cluster at different times at p = 0.90. The time to monitor the peak is listed in brackets, i.e., from t = 71 to t = 210 is in the form p 9, 71 ≤ t ≤ 210. The dashed line represents a link between two peaks. A new peak appears at t = 71 and remains unchanged until t = 210, which we consider to be the quasi-steady state for the peak. Another new peak p 10 emerges at t = 211 as an increase from the previous peak p 9. The peak location then remains unchanged until t = 824, indicating that the tumor entered a new quasi-steady-state period from t = 211 to t = 823. Simulation parameters: X*Y = 50*50. The remaining parameters were fixed
Fig. 6
Fig. 6
Snapshots of the tumor cell density contour over time on the percolation cluster. The peak location of the tumor density contour exhibits a leaping metastatic diffusion characteristic with the evolution of time. The evolution of tumor diffusion at time (a) t = 1, (b) t = 100, (c) t = 211, (d) t = 500, (e) t = 750 and (f) t = 1000. A new peak appears and moves away from the original peak area at t = 211 and remains unchanged between t = 211 and t = 750. Another new peak emerges at t = 750 and increases over time, such as t = 1000. The original peak disappears as the new peak appears over time. Double peaks clearly develop. Simulation parameters: X*Y = 50*50, p = 0.90. The remaining parameters were fixed
Fig. 7
Fig. 7
The time evolution of the peak location with a link between the new and original peaks. a The stepwise evolution of the peak location at p = 0.90. b The tumor distribution was determined with a meticulous division at t = 750, revealing a link between the new and old peaks of the tumor density contour. The link was similar to the dashed line connecting the two peaks in Fig. 5b. Simulation parameters: X*Y = 50*50. The remaining parameters were fixed
Fig. 8
Fig. 8
Slope k is positively correlated to the site-occupation probability P. a The peak location r m versus evolution time t at the occupation probability p = 0.85. The simulated data points were linearly fitted using the least squares method. b The measured value of slope k for different occupation probabilities P. The process of tumor diffusion and invasion slows down with a reduction in the occupation probability P, indicating that inhomogeneous surrounding tissue can inhibit tumor diffusion and invasion. For each value of slope k, statistical errors were estimated from seven independent simulation results (error bars, SD). Simulation parameters: X*Y = 50*50, t = 100. The remaining parameters were fixed
Fig. 9
Fig. 9
Diffusion of growing liver metastasis with the characteristic of leaping metastatic diffusion. a 1st day. b 45th day. c 72nd day. The red cross is the anchor point for image measurement and the white arrow in a indicates the original location of the tumor. The insets within (a) ∼ (c) display the measured optical density of the tumor peaks versus the peak location r m. (d) The location of the maximum optical density in the liver at different clinical observation times. The statistical errors of these values were estimated from three independent measurements (error bars, SD). The maximum optical density was used to characterize the peak of the tumor cell density. The tumor diffused and infiltrated from the original location to a new location. Three new peak areas appeared and grew over time. Their optical densities were even greater than that of the original. The maximum optical density moved from the original location to the third peak area at t = 45th day and then to the fourth peak area at t = 72nd day. Tumor cells were also distributed among these peak areas via an obvious link to both the second and third peak areas, as indicated by the double arrow in (b) and (c). As in our simulation, the link connected the new and old peaks of the tumor density contour, as shown in Fig. 7b
Fig. 10
Fig. 10
Differential diffusivity of metastasized breast cancer in bone, lung, liver and brain. a The radius of the tumor versus the time of clinical observation (t). b The inhomogeneity of the surrounding tissues versus the time of clinical observation (t). The dotted lines in Fig (b) mark the averaged inhomogeneity and the initial inhomogeneity of the surrounding tissues are also enumerated above the first histogram, respectively. The statistical errors of these values were estimated from three independent measurements (error bars, SD). The patient received a clinical diagnosis of breast cancer and suffered with bone, lung, liver and brain metastases. The metastases of the breast tumor diffused faster in bone and lung than in liver and brain. The initial and average inhomogeneity of the surrounding tissue microenvironments are in good agreement with the order of diffusion velocities in breast metastases of bone, lung, liver and brain
Fig. 11
Fig. 11
Differential diffusivity of metastasized lung adenocarcinoma in bone, left lung, liver and brain. a The radius of the tumor versus the time of clinical observation (t). b The inhomogeneity of the surrounding tissue versus the time of clinical observation (t). The dotted lines in Fig (b) mark the averaged inhomogeneity and the initial inhomogeneity of the surrounding tissues are also enumerated above the first histogram, respectively. The statistical errors of these values were estimated from three independent measurements (error bars, SD). The patient received a clinical diagnosis of lung adenocarcinoma and suffered with bone, left lung, liver and brain metastases. The metastases of the lung adenocarcinoma diffused faster in bone and lung than in liver and brain. The initial and average inhomogeneity of the surrounding tissue microenvironments are in good agreement with the order of diffusion velocities in lung adenocarcinoma metastases of bone, lung, liver and brain

Similar articles

Cited by

References

    1. Friedl P, Alexander S. Cancer invasion and the microenvironment: plasticity and reciprocity. Cell. 2011;147:992–1009. doi: 10.1016/j.cell.2011.11.016. - DOI - PubMed
    1. Stewart BW, Wild CP, editors. World cancer report 2014. Lyon: IARC; 2014.
    1. Christofori G. New signals from the invasive front. Nature. 2006;441:444–50. doi: 10.1038/nature04872. - DOI - PubMed
    1. Gupta GP, Massagué J. Cancer metastasis: building a framework. Cell. 2006;127:679–95. doi: 10.1016/j.cell.2006.11.001. - DOI - PubMed
    1. Steeg PS. Tumor metastasis: mechanistic insights and clinical challenges. Nat. Med. 2006;12:895–904. doi: 10.1038/nm1469. - DOI - PubMed

Publication types

LinkOut - more resources