. 2016 Nov 1;134(18):1353-1368.
doi: 10.1161/CIRCULATIONAHA.115.020754. Epub 2016 Sep 27.

Genetic and Pharmacologic Inhibition of the Chemokine Receptor CXCR2 Prevents Experimental Hypertension and Vascular Dysfunction

Affiliations

Genetic and Pharmacologic Inhibition of the Chemokine Receptor CXCR2 Prevents Experimental Hypertension and Vascular Dysfunction

Lei Wang et al. Circulation. .

Abstract

Background: The recruitment of leukocytes to the vascular wall is a key step in hypertension development. Chemokine receptor CXCR2 mediates inflammatory cell chemotaxis in several diseases. However, the role of CXCR2 in hypertension development and the underlying mechanisms remain unknown.

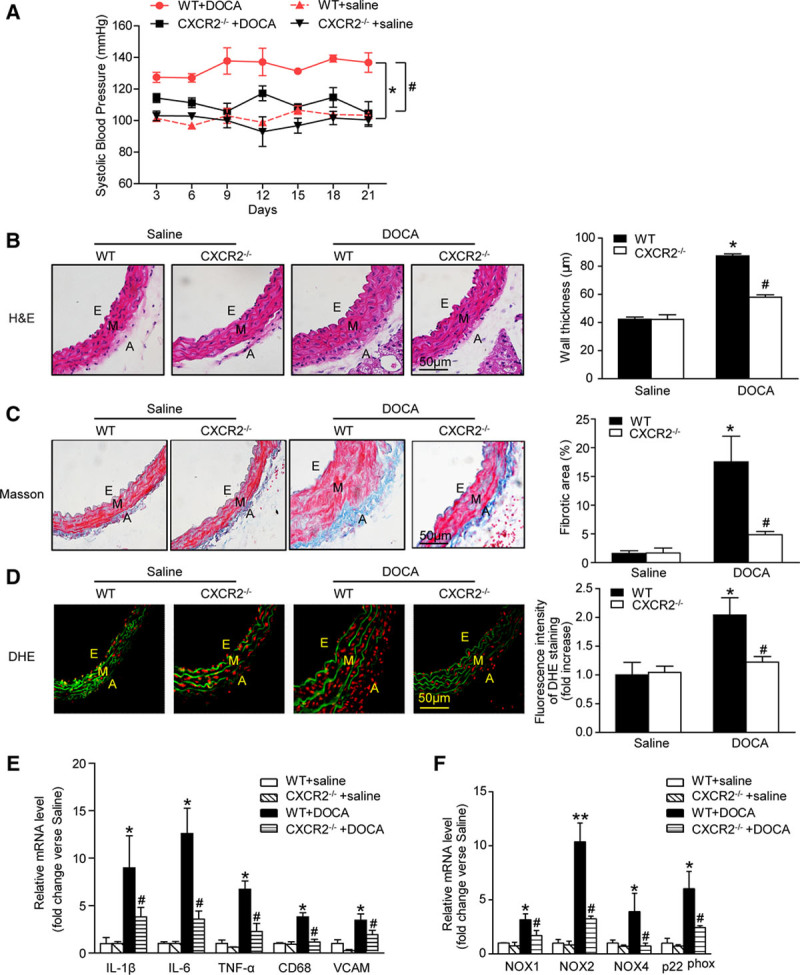
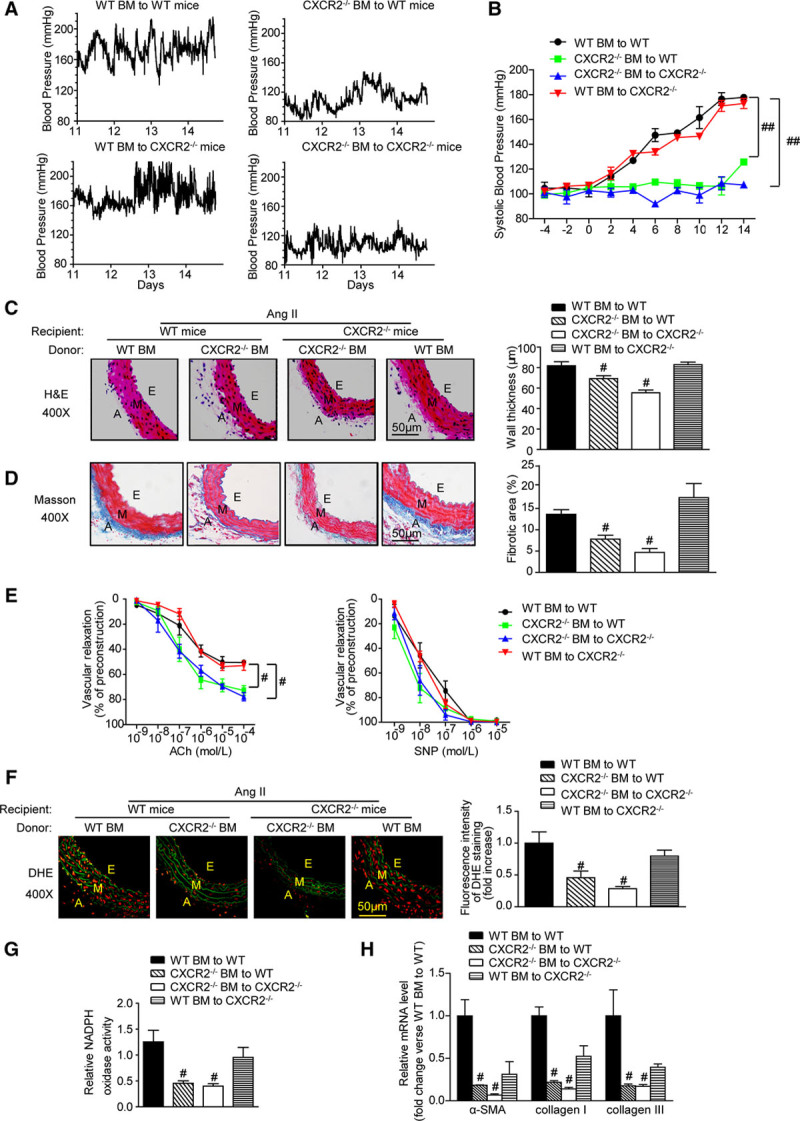
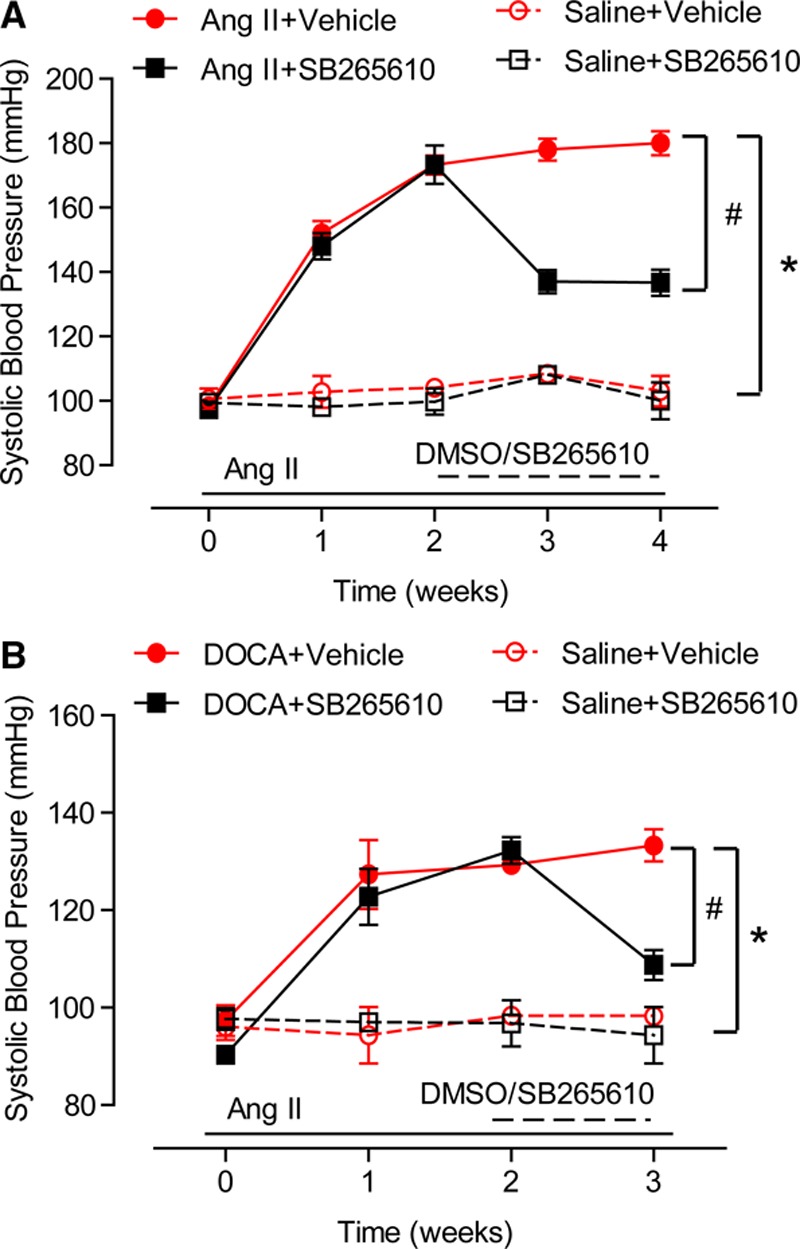
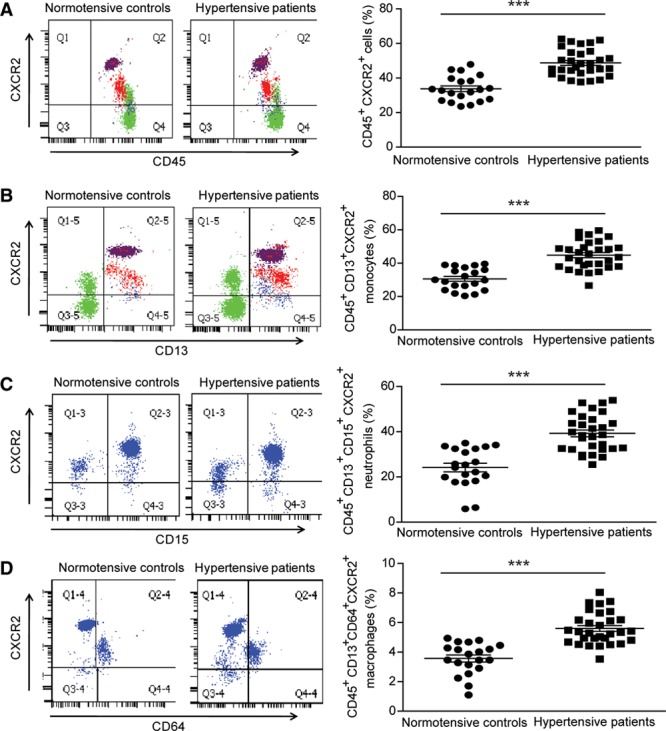
Methods: Angiotensin II (490 ng·kg-1·min-1) or deoxycorticosterone acetate (DOCA) salt-induced mouse hypertensive models in genetic ablation, pharmacologic inhibition of CXCR2, and adoptive bone marrow transfer mice were used to determine the role of CXCR2 in hypertension (measured by radiotelemetry and tail-cuff system), inflammation (verified by flow cytometry and quantitative real-time polymerase chain reaction [PCR] analysis), vascular remodeling (studied by haematoxylin and eosin and Masson's trichrome staining), vascular dysfunction (assessed by aortic ring), and oxidative stress (indicated by nicotinamide adenine dinucleotide phosphate [NADPH] oxidase activity, dihydroethidium staining, and quantitative real-time PCR analysis). Moreover, the blood CXCR2+ cells in normotensive controls and hypertension patients were analyzed by flow cytometry.

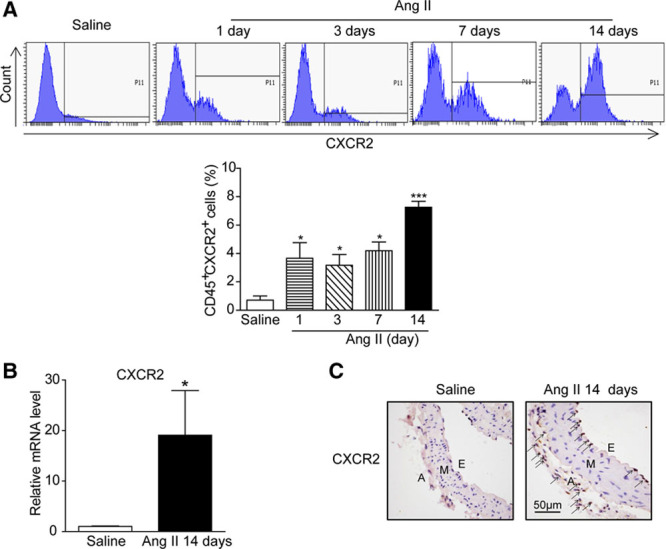
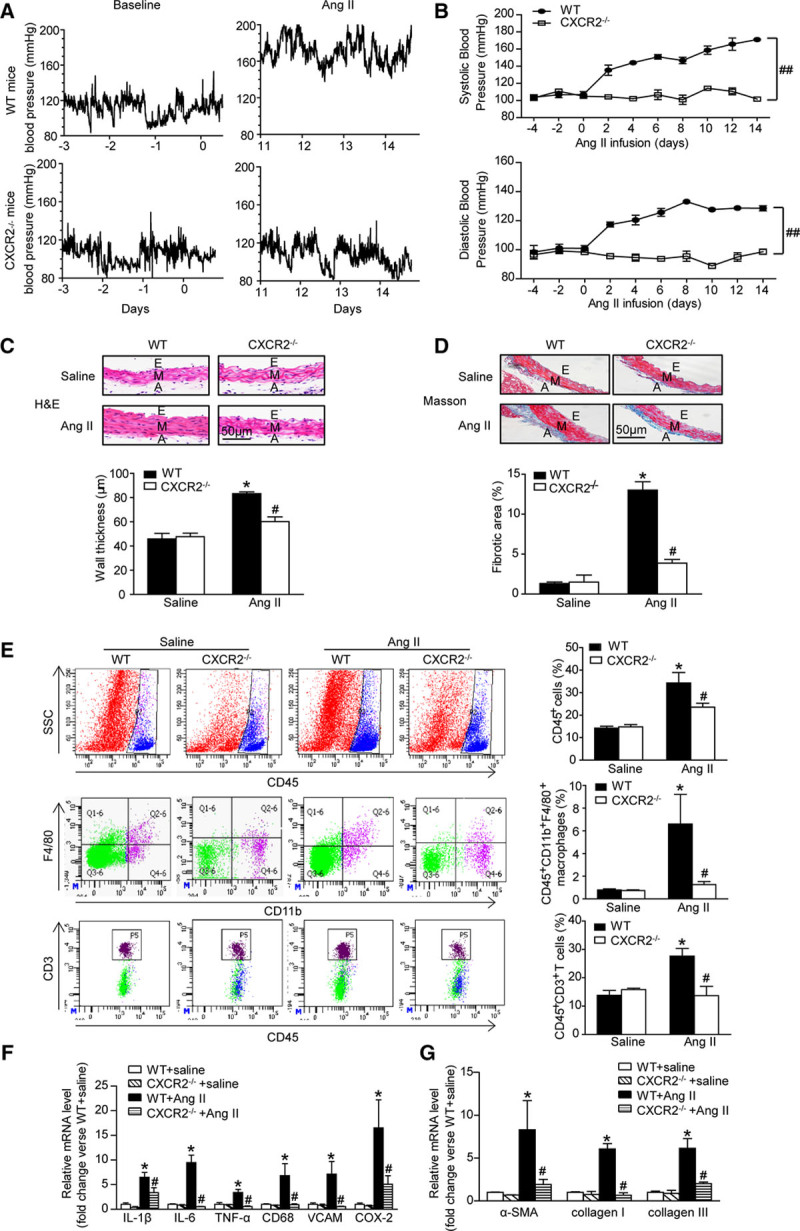
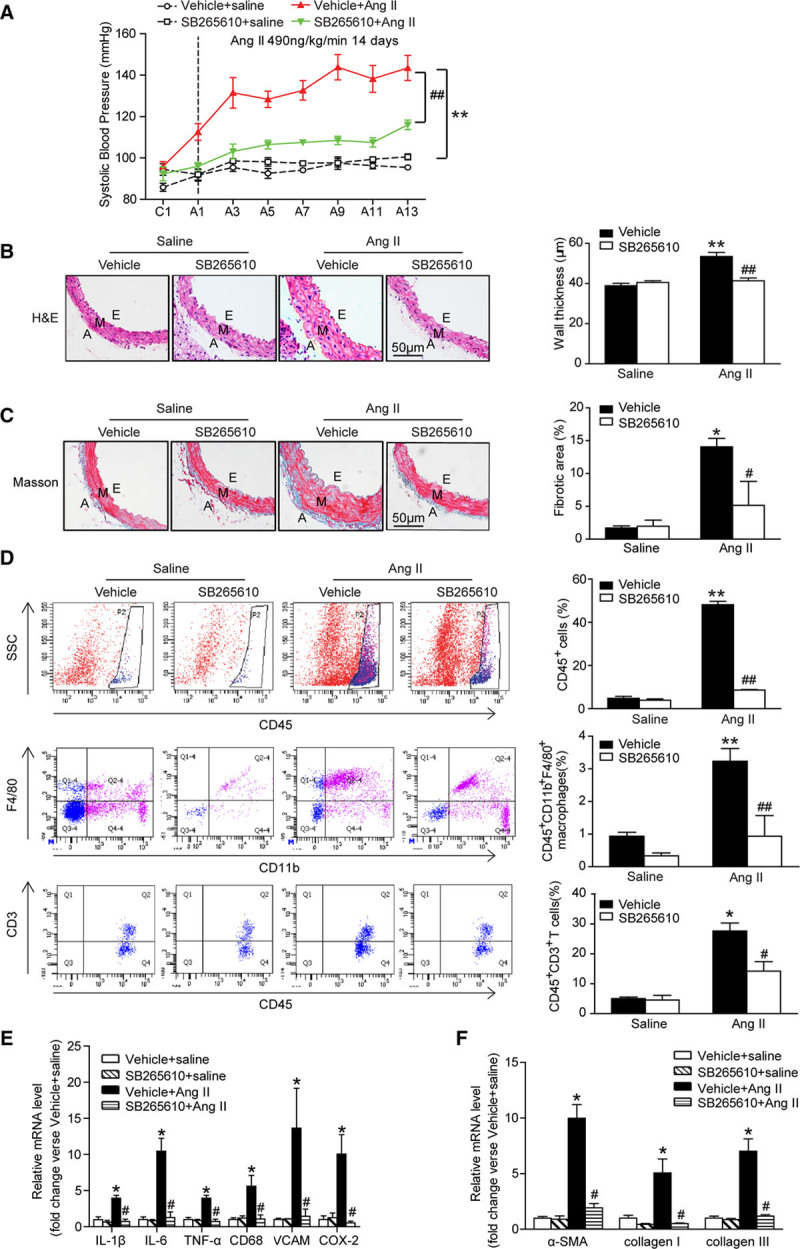
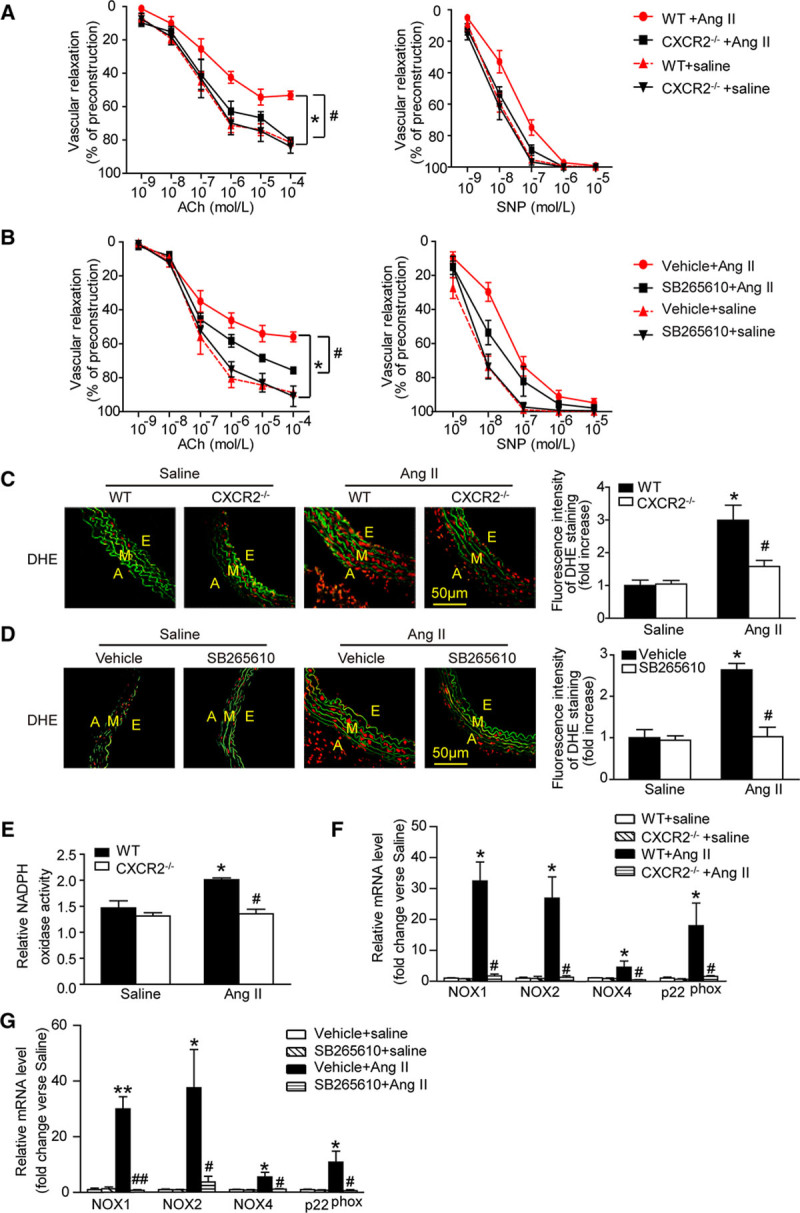
Results: Angiotensin II significantly upregulated the expression of CXCR2 mRNA and protein and increased the number of CD45+ CXCR2+ cells in mouse aorta (n=8 per group). Selective CXCR2 knockout (CXCR2-/-) or pharmacological inhibition of CXCR2 markedly reduced angiotensin II- or DOCA-salt-induced blood pressure elevation, aortic thickness and collagen deposition, accumulation of proinflammatory cells into the vascular wall, and expression of cytokines (n=8 per group). CXCR2 inhibition also ameliorated angiotensin II-induced vascular dysfunction and reduced vascular superoxide formation, NADPH activity, and expression of NADPH oxidase subunits (n=6 per group). Bone marrow reconstitution of wild-type mice with CXCR2-/- bone marrow cells also significantly abolished angiotensin II-induced responses (n=6 per group). It is important to note that CXCR2 blockade reversed established hypertension induced by angiotensin II or DOCA-salt challenge (n=10 per group). Furthermore, we demonstrated that CXCR2+ proinflammatory cells were higher in hypertensive patients (n=30) compared with normotensive individuals (n=20).

Conclusions: Infiltration of CXCR2+ cells plays a pathogenic role in arterial hypertension and vascular dysfunction. Inhibition of CXCR2 pathway may represent a novel therapeutic approach to treat hypertension.

Keywords: CXCR2; chemoreceptor; hypertension; inflammation; oxidant stress.


Figures

Figure 1.
Figure 1.
Angiotensin II promotes myeloid-derived CXCR2-positive cells. A, Flow cytometry analysis of CD45+CXCR2+ cells in aortic samples before and after angiotensin II infusion at day 1, 3, 7, and 14 (top). The percentage of CD45+CXCR2+ cells was shown as the histogram (bottom). B, Aortic mRNA level of CXCR2 was measured by quantitative real-time polymerase chain reaction (qPCR) after saline and angiotensin II infusion for 14 days. C, Immunohistochemical staining of the CXCR2-positive cells in aortic sections. Arrows indicate the CXCR2-positive cells. Scale bar, 50 μm. *P<0.05, ***P<0.001 versus saline, n=8 per group. A indicates adventitia; Ang II, angiotensin II; E, endothelium; M, media; and WT, wild-type.
Figure 2.
Figure 2.
Depletion of CXCR2 prevents angiotensin II-induced hypertension, vascular inflammation, and fibrosis. A, Representative original systolic blood pressure recordings in WT and CXCR2-/- mice 3 days before angiotensin II treatment (baseline) and during the last 3 days of angiotensin II infusion (Ang II) by telemetric blood pressure measurements. B, Average systolic (top) and diastolic (bottom) blood pressure of WT and CXCR2-/- mice before and after angiotensin II treatment obtained by telemetry. ##P<0.01 versus WT + Ang II; n=8 per group. C, H&E staining of thoracic aorta (top) and the wall thickness of each group were analyzed (bottom). Scale bar, 50 μm. D, Masson staining of thoracic aorta (top) and the percentage of fibrotic area were analyzed (bottom). Scale bar, 50 μm. E, Flow cytometry analysis of CD45+ cells, CD45+CD11b+F4/80+ macrophages, and CD45+CD3+ T cells in aortic lysates (left). The histograms indicate the percentage of gated cells in the total cells (right). F, qPCR analysis of IL-1β, IL-6, TNF-α, CD68, VCAM-1, and COX-2 mRNA expression levels in the aorta. G, qPCR analysis of α-SMA, collagen I, and collagen III mRNA expression levels in the aorta. *P<0.05 versus WT + saline, #P<0.05 versus WT + Ang II; n=8 per group. α-SMA indicates α-smooth muscle actin; A, adventitia; Ang II, angiotensin II; COX-2, cyclooxygenase-2; E, endothelium; H&E, hematoxylin and eosin; IL-1β, interleukin-1β; IL-6, interleukin-6; M, media; SSC, side scatter; TNF-α, tumor necrosis factor-α; VCAM, vascular cell adhesion molecule-1; and WT, wild-type.
Figure 3.
Figure 3.
The CXCR2 inhibitor SB265610 alleviates hypertension, vascular inflammation, and fibrosis after angiotensin II infusion. A, Systolic blood pressure was measured by the noninvasive tail-cuff method in vehicle or SB265610-treated mice before (C) and after angiotensin II treatment (T, 490ng/kg/min). B, H&E staining of thoracic aorta (left) and the wall thickness of each group were analyzed (right). Scale bar, 50 μm. C, Masson staining of thoracic aorta (left) and the percentage of fibrotic area were analyzed (right). Scale bar, 50 μm. D, Flow cytometry analysis of CD45+ cells, CD45+CD11b+F4/80+ macrophages, and CD45+CD3+ T cells in aortic lysates (left). The histograms indicate the percentage of gated cells (right). E, qPCR analysis of IL-1β, IL-6, TNF-α, CD68, VCAM-1, and COX-2 mRNA expression levels in the aorta. F, qPCR analysis of α-SMA, collagen I, and collagen III mRNA expression levels in the aorta. *P<0.05, **P<0.01 versus vehicle + saline, #P<0.05, ##P<0.01 versus vehicle + Ang II; n=8 per group. α-SMA indicates α-smooth muscle actin; A, adventitia; A, after Ang II treatment; Ang II, angiotensin II; C, before Ang II treatment; COX-2, cyclooxygenase-2; E, endothelium; H&E, hematoxylin and eosin; IL-1β: interleukin-1β; IL-6, interleukin-6; M, media; TNF-α, tumor necrosis factor-α; VCAM, vascular cell adhesion molecule-1; and WT, wild-type.
Figure 4.
Figure 4.
Inhibition or genetic ablation of CXCR2 improves vascular function and reduces oxidative stress in response to Angiotensin II. A and B, Concentration-response curves of endothelium-dependent (acetylcholine, left) and nonendothelium-dependent (SNP, right) relaxation. C and D, DHE staining of the aortic segments (left) and the DHE fluorescence intensity of each group were analyzed (right). Red fluorescence reflects the superoxide formation, whereas green fluorescence shows the laminae. Scale bar, 50 μm. E, Aortic NADPH oxidase activity was measured. F and G, qPCR analysis of NOX1, NOX2, NOX4, and p22phox mRNA expression. *P<0.05, **P<0.01 versus WT/vehicle + saline, #P<0.05, ##P<0.01 versus WT + Ang II; n=6 per group. A indicates adventitia; Ach, acetylcholine; Ang II, angiotensin II; DHE, dihydroethidine; E, endothelium; M, media; NADPH, nicotinamide adenine dinucleotide phosphate; NOX, NADPH oxidase; SNP, sodium nitroprusside; and WT, wild-type.
Figure 5.
Figure 5.
Depletion of CXCR2 attenuates DOCA-salt-induced hypertension. A, Systolic blood pressure was measured by the tail-cuff method of each group. B and C, H&E and Masson staining of thoracic aorta (left), wall thickness, and percentage of fibrotic area of each group were analyzed (right). Scale bar, 50 μm. D, DHE staining of the aortic segments (left) and the DHE fluorescence intensity of each group were analyzed (right). Scale bar, 50 μm. E and F, IL-1β, IL-6, TNF-α, CD68, VCAM-1, NOX1, NOX2, NOX4, and p22phox mRNA expression levels were measured by qPCR. *P<0.05, **P<0.01 versus WT + saline; #P<0.05 versus WT + DOCA; n=8 per group. A indicates adventitia; DHE, dihydroethidine; DOCA, desoxycorticosterone acetate; E, endothelium; H&E, hematoxylin; IL-1β: interleukin-1β; IL-6, interleukin-6; M, media; NOX, nicotinamide adenine dinucleotide phosphate oxidase; TNF-α, tumor necrosis factor-α; VCAM, vascular cell adhesion molecule-1; and WT, wild-type.
Figure 6.
Figure 6.
CXCR2 deficiency in bone marrow-derived cells prevents angiotensin II-induced hypertension, vascular inflammation, fibrosis, dysfunction, and oxidative stress. A, Representative telemetric trace recording of systolic blood pressure of each group during the last 3 days of angiotensin II infusion. B, Average systolic blood pressure of each group before and after angiotensin II treatment obtained by telemetry. C and D, H&E and Masson staining of thoracic aorta (left), wall thickness, and percentage of fibrotic area of each group were analyzed (right). Scale bar, 50 μm. E, Concentration-response curves of endothelium acetylcholine-dependent and nonendothelium (SNP)-dependent relaxation. F, DHE staining of the aortic segments (left) and the DHE fluorescence intensity of each group were analyzed (right). Scale bar, 50 μm. G, Aortic NADPH oxidase activity was measured. H, qPCR analysis of α-SMA, collagen I, and collagen III mRNA expression levels in the aorta. #P<0.05, ##P<0.01 versus WT BM to WT; n=6 per group. α-SMA indicates α-smooth muscle actin; A, adventitia; Ach, acetylcholine; BM, bone marrow; DHE, dihydroethidine; E, endothelium; H&E, hematoxylin and eosin; M, media; NADPH oxidase, nicotinamide adenine dinucleotide phosphate oxidase; and SNP, sodium nitroprusside.
Figure 7.
Figure 7.
Treatment with SB265610 reverses angiotensin II- and DOCA-salt–induced hypertension. A and B, After 2 weeks of saline, angiotensin II, or DOCA-salt treatment, mice were given either vehicle or SB265610 for the remaining 1 or 2 weeks of saline, angiotensin II, or DOCA-salt treatment. The systolic blood pressure was recorded by the tail-cuff method every week. *P<0.05 versus saline + vehicle, #P<0.05 versus Ang II/DOCA + SB265610; n=10 per group.
Figure 8.
Figure 8.
Blood CXCR2+ cells are increased in hypertensive patients. A–D, Flow cytometric analysis of circulating CD45+CXCR2+ inflammatory cells (A), CD45+CD13+CXCR2+ monocytes (B), CD45+CD13+CD15+CXCR2+ neutrophils (C), and CD45+CD13+CD64+CXCR2+ macrophages (D) in both hypertensive patients (n=30) and normotensive individuals (n=20). ***P<0.001 hypertensive patients versus normotensive control.

Comment in

  • Is Hypertension a Bone Marrow Disease?
    Montaniel KR, Harrison DG. Montaniel KR, et al. Circulation. 2016 Nov 1;134(18):1369-1372. doi: 10.1161/CIRCULATIONAHA.116.024520. Epub 2016 Sep 27. Circulation. 2016. PMID: 27678263 Free PMC article. No abstract available.

References

    1. Rodríguez-Iturbe B, Pons H, Quiroz Y, Lanaspa MA, Johnson RJ. Autoimmunity in the pathogenesis of hypertension. Nat Rev Nephrol. 2014;10:56–62. doi: 10.1038/nrneph.2013.248. - PubMed
    1. Harrison DG, Guzik TJ, Lob HE, Madhur MS, Marvar PJ, Thabet SR, Vinh A, Weyand CM. Inflammation, immunity, and hypertension. Hypertension. 2011;57:132–140. doi: 10.1161/HYPERTENSIONAHA.110.163576. - PMC - PubMed
    1. Harrison DG. The immune system in hypertension. Trans Am Clin Climatol Assoc. 2014;125:130–38. - PMC - PubMed
    1. Guzik TJ, Hoch NE, Brown KA, McCann LA, Rahman A, Dikalov S, Goronzy J, Weyand C, Harrison DG. Role of the T cell in the genesis of angiotensin II induced hypertension and vascular dysfunction. J Exp Med. 2007;204:2449–2460. doi: 10.1084/jem.20070657. - PMC - PubMed
    1. Vinh A, Chen W, Blinder Y, Weiss D, Taylor WR, Goronzy JJ, Weyand CM, Harrison DG, Guzik TJ. Inhibition and genetic ablation of the B7/CD28 T-cell costimulation axis prevents experimental hypertension. Circulation. 2010;122:2529–2537. doi: 10.1161/CIRCULATIONAHA.109.930446. - PMC - PubMed