. 2016 Sep 28:6:34261.
doi: 10.1038/srep34261.

Quantitative Proteomics Reveals the Defense Response of Wheat against Puccinia striiformis f. sp. tritici

Affiliations

Quantitative Proteomics Reveals the Defense Response of Wheat against Puccinia striiformis f. sp. tritici

Yuheng Yang et al. Sci Rep. .

Erratum in

Abstract

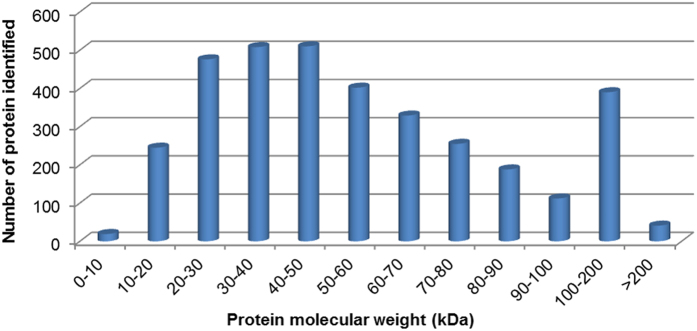
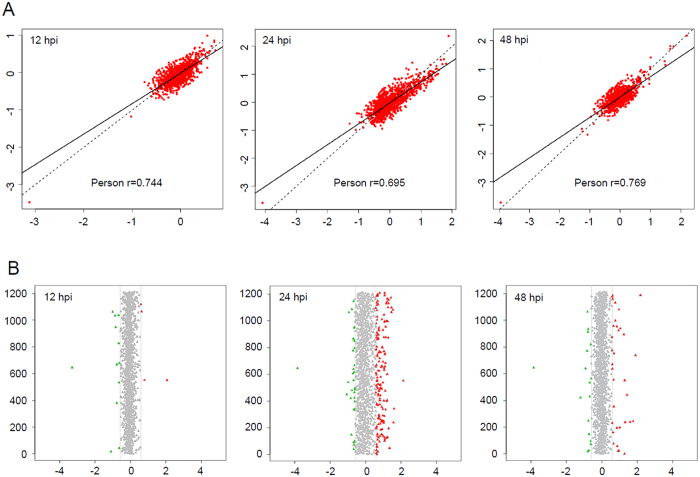
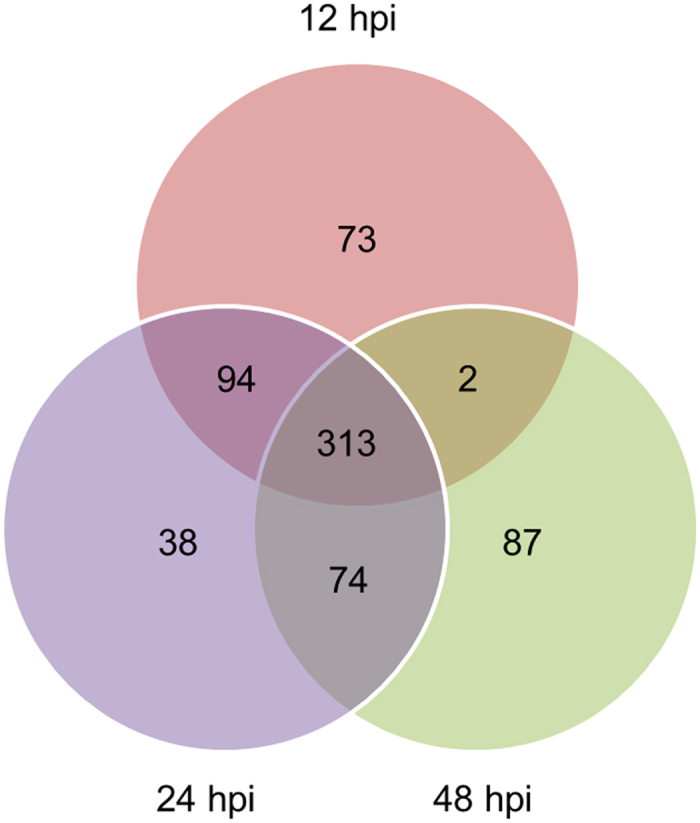
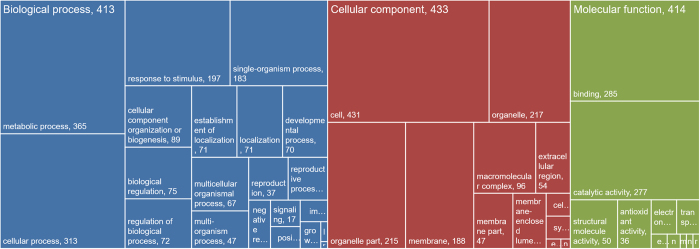
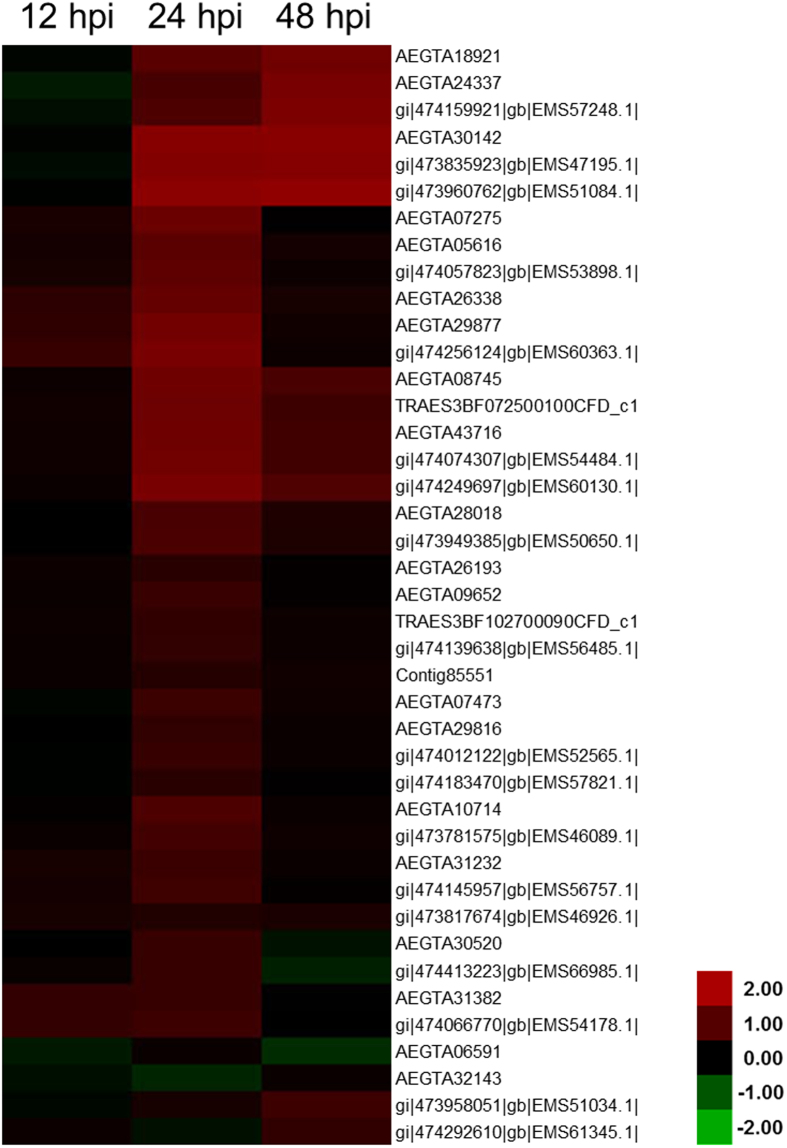
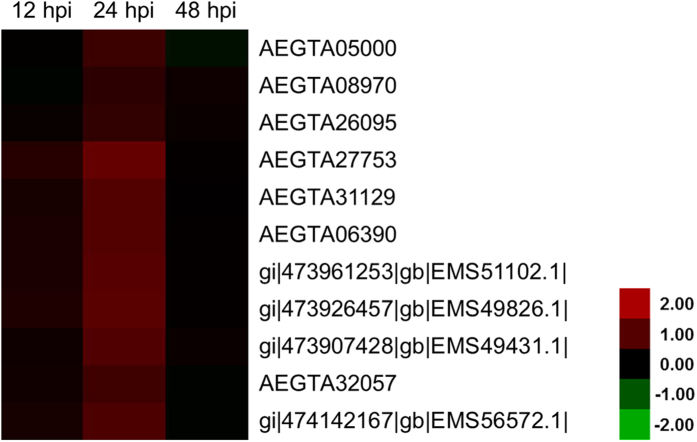
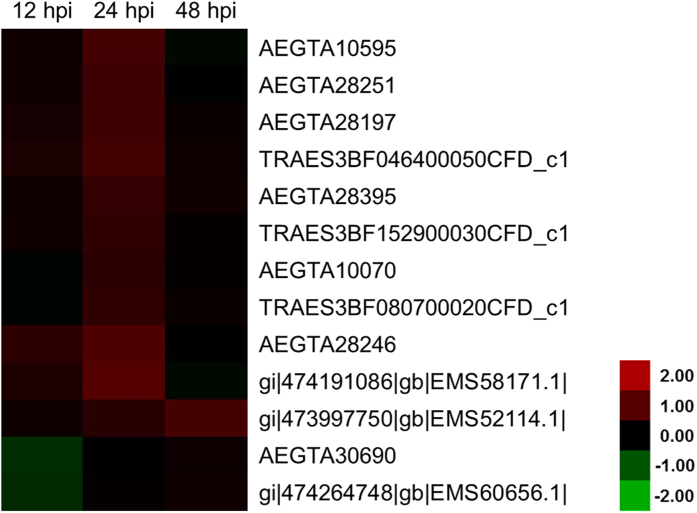
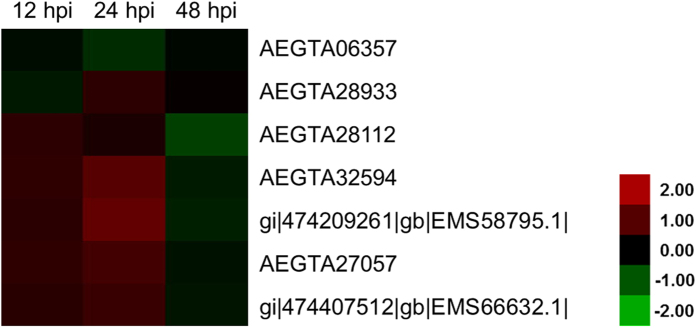
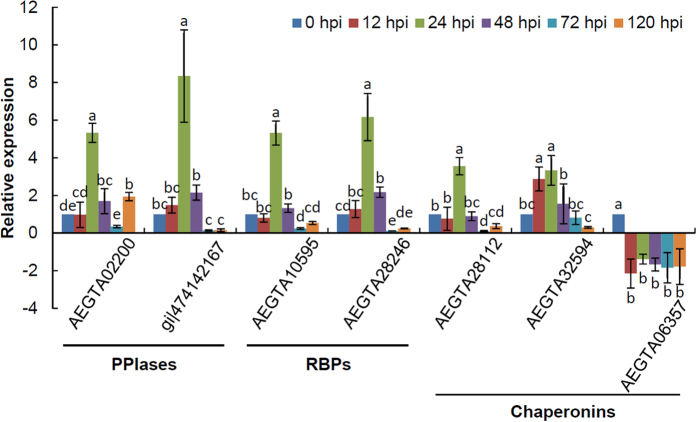
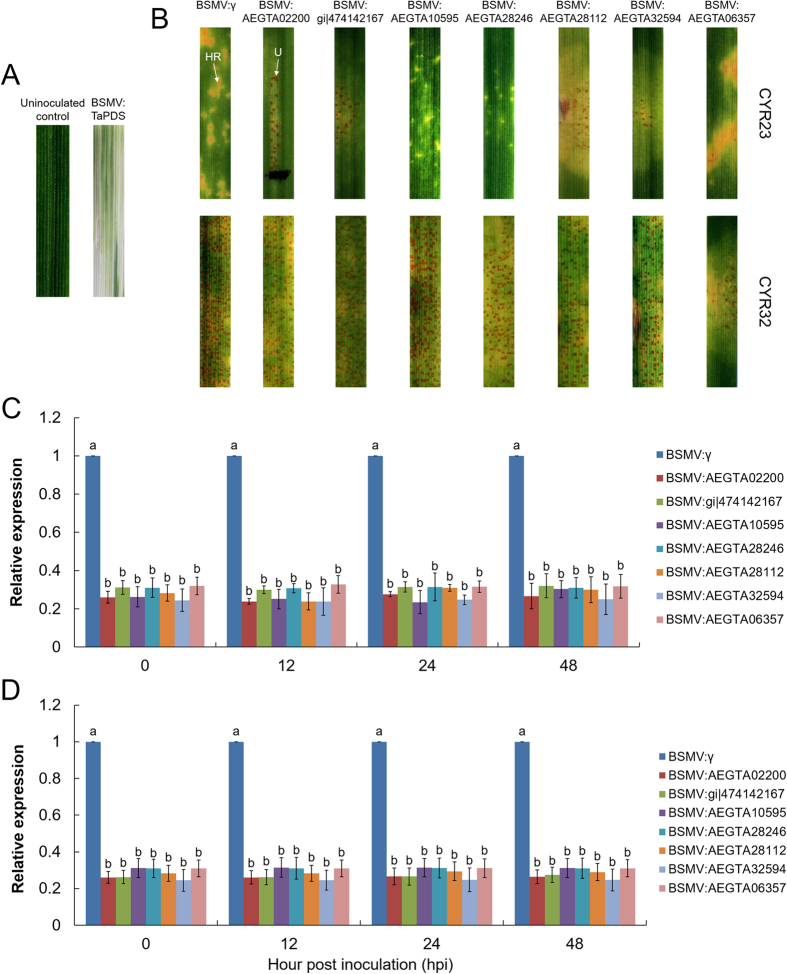
Wheat stripe rust, caused by Puccinia striiformis f. sp. tritici (Pst), is considered one of the most aggressive diseases to wheat production. In this study, we used an iTRAQ-based approach for the quantitative proteomic comparison of the incompatible Pst race CYR23 in infected and non-infected leaves of the wheat cultivar Suwon11. A total of 3,475 unique proteins were identified from three key stages of interaction (12, 24, and 48 h post-inoculation) and control groups. Quantitative analysis showed that 530 proteins were differentially accumulated by Pst infection (fold changes >1.5, p < 0.05). Among these proteins, 10.54% was classified as involved in the immune system process and stimulus response. Intriguingly, bioinformatics analysis revealed that a set of reactive oxygen species metabolism-related proteins, peptidyl-prolyl cis-trans isomerases (PPIases), RNA-binding proteins (RBPs), and chaperonins was involved in the response to Pst infection. Our results were the first to show that PPIases, RBPs, and chaperonins participated in the regulation of the immune response in wheat and even in plants. This study aimed to provide novel routes to reveal wheat gene functionality and better understand the early events in wheat-Pst incompatible interactions.


Figures

Figure 1
Figure 1. Molecular mass distribution of the wheat proteins identified from the iTRAQ analysis spanned across a wide range of molecular weights, which were induced by incompatible Puccinia striiformis f. sp. tritici.
The abscissa represented the molecular weight of identified proteins (kDa), and the ordinate represented the number of identified proteins.
Figure 2
Figure 2. The quantitative proteomic analysis of the wheat peoteins induced by incompatible Puccinia striiformis f. sp. tritici.
(A) The correlation of three treatment groups (12, 24 and 48 hpi). The Pearson correlation factors are 0.744, 0.695 and 0.769, respectively. The abscissa represented the first repeat whereas the ordinate represented the second repeat (as log2 value). hpi, hour post-inoculation. (B) Gaussian distribution of the quantitative dates of three treatment groups (12, 24, and 48 hpi). The ordinate represented the quantity of identified proteins, and the abscissa represented protein ratios (as log2 value). Red triangles indicated up-regulated proteins whereas green triangles indicated down-regulated proteins. hpi, hour post-inoculation.
Figure 3
Figure 3. Venn diagram representing the overlap among differentially expressed proteins identified by iTRAQ analysis of three treatment groups (12, 24, and 48 hpi) of wheat–Puccinia striiformis f. sp. tritici incompatible interaction.
hpi, hour post-inoculation.
Figure 4
Figure 4. Gene Ontology annotation of differentially expressed proteins identified by iTRAQ analysis in the wheat–Puccinia striiformis f. sp. tritici incompatible interaction.
GO enrichment analysis of identified proteins by Blast2GO software, the three unrelated ontologies: biological process, cellular component and molecular function were analyzed, respectively.
Figure 5
Figure 5. Heat map representing the profile of differentially accumulated reactive oxygen species metabolism-related proteins induced by the avirulent Puccinia striiformis f. sp. tritici race CYR23.
Red color indicated high expression whereas green color indicated low expression.
Figure 6
Figure 6. Heat map representing the profile of differentially accumulated wheat peptidyl–prolyl cis–trans isomerases induced by the avirulent Puccinia striiformis f. sp. tritici race CYR23.
Red color indicated high expression whereas green color indicated low expression.
Figure 7
Figure 7. Heat map representing the profile of differentially accumulated wheat RNA-binding proteins induced by the avirulent Puccinia striiformis f. sp. tritici race CYR23.
Red color indicated high expression whereas green color indicated low expression.
Figure 8
Figure 8. Heat map representing the profile of differentially accumulated wheat chaperonins induced by the avirulent Puccinia striiformis f. sp. tritici race CYR23.
Red color indicated high expression whereas green color indicated low expression.
Figure 9
Figure 9. Expression patterns of differentially expressed proteins induced by the avirulent Puccinia striiformis f. sp. tritici race CYR23.
hpi, hour post-inoculation. Leaf tissues were sampled for both inoculated and mock-inoculated plants at 0, 12, 24, 48, 72 and 120 hpi. The relative expression levels of these genes were calculated using the comparative threshold (2−ΔΔCT) method. The mean value and standard deviation of gene expression were calculated from three independent biological replications. ANOVA was conducted to determine the differences between each time point. Superscripts with the same letter indicate that values are not significantly different at p < 0.01.
Figure 10
Figure 10. Functional characterization of differentially expressed proteins by BSMV-VIGS system.
(A) Mild chlorotic mosaic symptoms were observed on the fourth leaves inoculated with BSMV:TaPDS at 12 dpi; uninoculated control, wheat leaves treated with full-strength inoculation buffer. (B) Disease symptoms were observed at 14 dpi on the fourth leaves of wheat plants that were inoculated with the avirulent pathogen CYR23 and virulent pathogen CYR32, respectively. HR, hypersensitive response; U, uredium. (C) Relative transcript levels of differentially expressed proteins assayed in knocked-down wheat leaves inoculation with CYR23. (D) Relative transcript levels of differentially expressed proteins assayed in knocked-down wheat leaves inoculation with CYR32. The mean value and standard deviation of gene expression were calculated from three independent biological replications. ANOVA was conducted to determine the differences between each time point. Superscripts with the same letter indicate that values are not significantly different at p < 0.01.

Similar articles

Cited by

References

    1. Hovmoller M. S. et al. Diversity of Puccinia striiformis on Cereals and Grasses. Annu Rev Phytopathol 49, 197–217 (2011). - PubMed
    1. Dean R. et al. The Top 10 fungal pathogens in molecular plant pathology. Mol Plant Pathol 13, 414–430 (2012). - PMC - PubMed
    1. Kolmer J. A., Ordonez M. E. & Groth J. V. The Rust Fungi. In: eLS (ed^(eds). John Wiley & Sons, Ltd (2009).
    1. Chen W. Q. et al. Wheat stripe (yellow) rust caused by Puccinia striiformis f. sp. tritici. Mol Plant Pathol 15, 433–446 (2014). - PMC - PubMed
    1. Quirino B. F. et al. Proteomic approaches to study plant-pathogen interactions. Phytochemistry 71, 351–362 (2010). - PubMed

LinkOut - more resources