. 2017 Apr 15;23(8):1945-1954.
doi: 10.1158/1078-0432.CCR-16-1562. Epub 2016 Sep 27.

A Novel Compound ARN-3236 Inhibits Salt-Inducible Kinase 2 and Sensitizes Ovarian Cancer Cell Lines and Xenografts to Paclitaxel

Affiliations

A Novel Compound ARN-3236 Inhibits Salt-Inducible Kinase 2 and Sensitizes Ovarian Cancer Cell Lines and Xenografts to Paclitaxel

Jinhua Zhou et al. Clin Cancer Res. .

Abstract

Purpose: Salt-inducible kinase 2 (SIK2) is a centrosome kinase required for mitotic spindle formation and a potential target for ovarian cancer therapy. Here, we examine the effects of a novel small-molecule SIK2 inhibitor, ARN-3236, on sensitivity to paclitaxel in ovarian cancer.Experimental Design: SIK2 expression was determined in ovarian cancer tissue samples and cell lines. ARN-3236 was tested for its efficiency to inhibit growth and enhance paclitaxel sensitivity in cultures and xenografts of ovarian cancer cell lines. SIK2 siRNA and ARN-3236 were compared for their ability to produce nuclear-centrosome dissociation, inhibit centrosome splitting, block mitotic progression, induce tetraploidy, trigger apoptotic cell death, and reduce AKT/survivin signaling.Results: SIK2 is overexpressed in approximately 30% of high-grade serous ovarian cancers. ARN-3236 inhibited the growth of 10 ovarian cancer cell lines at an IC50 of 0.8 to 2.6 μmol/L, where the IC50 of ARN-3236 was inversely correlated with endogenous SIK2 expression (Pearson r = -0.642, P = 0.03). ARN-3236 enhanced sensitivity to paclitaxel in 8 of 10 cell lines, as well as in SKOv3ip (P = 0.028) and OVCAR8 xenografts. In at least three cell lines, a synergistic interaction was observed. ARN-3236 uncoupled the centrosome from the nucleus in interphase, blocked centrosome separation in mitosis, caused prometaphase arrest, and induced apoptotic cell death and tetraploidy. ARN-3236 also inhibited AKT phosphorylation and attenuated survivin expression.Conclusions: ARN-3236 is the first orally available inhibitor of SIK2 to be evaluated against ovarian cancer in preclinical models and shows promise in inhibiting ovarian cancer growth and enhancing paclitaxel chemosensitivity. Clin Cancer Res; 23(8); 1945-54. ©2016 AACR.


Conflict of interest statement

DISCLOSURE OF POTENTIAL CONFLICTS OF INTEREST

The authors have no conflicts of interest.

Figures

Figure 1
Figure 1. SIK2 is overexpressed in 30% of serous ovarian cancers
(A) Representative images of human ovarian tumors with low or high immunohistochemical staining for SIK2, and the percentage of SIK2-positive (+) and SIK2-negative samples (−). (B) Lysates from 3 cases of normal ovarian epithelium and 12 cases of primary serous ovarian cancer tissue were subjected to immunoblotting analysis for SIK2 expression.
Figure 2
Figure 2. ARN-3236 inhibits SIK2 kinase activity and ovarian cancer cell growth
(A) SKOv3-SIK2 cells were treated with ARN-3236 at the indicated concentrations for 48 hrs or SKOv3-SIK2 cell were treated with ARN3236 at final concentration of 2μM for the indicated time periods. Cell lysates were collected and analyzed by western blot for SIK2-pS358 and total protein level of SIK2. The numbers blow the bands are intensities of pS358 normalized to GAPDH.(B) SKOv3 ells were plated at a density of 8000/well in 96-well plates, then treated with ARN-3236 or DMSO for 72 hrs, and cell viability was measured with an SRB assay. (C) Endogenous SIK2 expression was detected by western blot in indicated ovarian cancer cell lines. (D) The correlation between endogenous SIK2 expression and IC50 value in each cell line was plotted.
Figure 3
Figure 3. ARN-3236 increases paclitaxel sensitivity in ovarian cancer cells in vitro and in vivo
(A, B) OC316 and OVCAR8 cells were plated at a density of 8000/well in 96-well plate, then sequentially treated with ARN-3236 or DMSO for 24 hr and with increasing concentration of paclitaxel for another 72 hrs. Cell viability was measured with an SRB assay. (C) A flow diagram showing the design of the in vivo experiment. (D) SKOv3ip cancer cells were inoculated i.p. into nu/nu mice and treated as indicated in the Methods. After treatment, mice were sacrificed and the tumors weighed. The tumor weight of individual mice in each group is plotted (n=6 in each group).
Figure 4
Figure 4. ARN-3236 uncouples the centrosome from the nucleus and inhibits centrosome separation
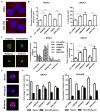
(A) Shown is a representative centrosome localization in relation to the nucleus 48 hrs post DMSO or ARN-3236 treatment. DAPI, blue; α-tubulin, red; γ-tubulin, green. Arrow head points to dislocated centrosome. (B) SKOv3 cells were plated on cover slips and transfected with siRNA or treated with DMSO or ARN-3236 (1 μM), 48 hrs following treatment, the distance from the centrosome to the nuclear envelop in each cell was measured and the percentage of cells showing nuclear-centrosome uncoupling (NCU) was calculated. The bar plots show the mean ± s.d. of the distance in microns (left plot) and the mean ± s.d. of the percentage of cells with NCU from three independent experiments (right plot). (C) Cells were treated as in (B) and stained using anti-γ-tubulin (red) and anti-phosphohistone H3 (green) to reveal the centrosome position in mitosis in relation to chromosomes. Shown are the representative examples of different mitosis phase in control cells. (D) After the same treatment as in (B), mitotic cells at each stage were counted and plotted. Bar plots represents the mean ± s.d. of the percentage of cells at different stage of mitosis (left plot) and the mean prometaphase/metaphase ratio ± s.d (right plot). (E) Cells were treated as in (B) and stained using anti-γ-tubulin (green), α-tubulin (red) and DAPI to reveal the centrosome position in relation to chromosomes. Shown are the representative examples of bipolar and mono/multipolar mitotic cells. (F) After the same treatment as in (B), bipolar and mono/multipolar mitotic cells were counted and plotted. Bar plots represents the mean ± s.d. of the percentage of bipolar and mono/multipolar mitotic cells.
Figure 5
Figure 5. ARN-3236 induces cell cycle arrest, apoptosis and tetraploidy
(A) SKOv3 cells were transfected with SIK2 siRNA or treated with ARN-3236 (1 μM) for 48 hrs. After treatment, cells were fixed, stained with PI, and subjected to cell cycle analysis. (B) SKOv3 cells were treated with ARN-3236 (1 μM) for 24 hrs and with paclitaxel (3 nM) for another 72 hrs, then were stained with Annexin V-FITC/PI and subjected to apoptotic analysis. (C) SKOv3 cells were treated with SIK2 siRNA or ARN-3236 (1 μM) for 48 hrs, fixed, stained with PI and subjected to cell ploidy analysis. The representative percentage of cell in 2n, 4n and 8n are shown. (D) SKOv3 cells were transfected with SIK2 siRNA or treated with ARN-3236 (1 μM) for 24hr and with paclitaxel (3 nM) for another 72 hrs, then cells were fixed, stained with PI and subjected to cell ploidy analysis. The representative percentage of cell in 2n, 4n and 8n are shown. All the experiments were repeated in triplicate.
Figure 6
Figure 6. ARN-3236 attenuates the AKT/survivin pathway
(A) SKOv3 cells were transfected with SIK2 siRNA or treated with ARN-3236 for 48 hrs, cell lysates were collected and analyzed by western blot for AKT-pS473, AKT-pT308, AKT and survivin expression (left panel), in the right panel is shown immunoblotting analysis of tumor lysates after the indicated treatment detecting AKT-pS473, AKT-pT308, AKT and survivin. (B) The vector expressed survivin (C-survivin) and endogenous survivin (E-survivin) were detected by western blot in the cell lines indicated. (C, D) Ovarian cancer cells of the lines indicated were added to 96 well plates at density of 8000 cells/well and treated with DMSO or ARN-3236 (0.6 μM) for 24 hrs, followed by different concentrations of paclitaxel for a subsequent 72 hrs. Cell viability was measured by an SRB assay. Triplicate assays were performed. The fold change in paclitaxel IC50 values after ARN-3236 treatment are plotted for each cell line in (C) and the cell viability curves are shown in (D). (E) Ovarian cancer cells were treated with ARN-3236 (0.6 μM) for 24 hr and/or with paclitaxel (4 nM) for subsequent 72 hr, cell lysates well collected and subjected to western blot analysis of activated caspase-3.

References

    1. Muggia FM, Braly PS, Brady MF, Sutton G, Niemann TH, Lentz SL, et al. Phase III randomized study of cisplatin versus paclitaxel versus cisplatin and paclitaxel in patients with suboptimal stage III or IV ovarian cancer: a gynecologic oncology group study. J Clin Oncol. 2000;18:106–15. - PubMed
    1. Coleman RL, Monk BJ, Sood AK, Herzog TJ. Latest research and treatment of advanced-stage epithelial ovarian cancer. Nat Rev Clin Oncol. 2013;10:211–24. - PMC - PubMed
    1. Yu Y, Gaillard S, Phillip JM, Huang TC, Pinto SM, Tessarollo NG, et al. Inhibition of Spleen Tyrosine Kinase Potentiates Paclitaxel-Induced Cytotoxicity in Ovarian Cancer Cells by Stabilizing Microtubules. Cancer Cell. 2015;28:82–96. - PMC - PubMed
    1. McGrail DJ, Khambhati NN, Qi MX, Patel KS, Ravikumar N, Brandenburg CP, et al. Alterations in ovarian cancer cell adhesion drive taxol resistance by increasing microtubule dynamics in a FAK-dependent manner. Sci Rep. 2015;5:9529. - PMC - PubMed
    1. Kurman RJ, Shih Ie M. The Dualistic Model of Ovarian Carcinogenesis: Revisited, Revised, and Expanded. Am J Pathol. 2016;186:733–47. - PMC - PubMed