. 2016 Dec;139(Pt 12):3187-3201.
doi: 10.1093/brain/aww237. Epub 2016 Sep 27.

Exosome secretion is a key pathway for clearance of pathological TDP-43

Affiliations

Exosome secretion is a key pathway for clearance of pathological TDP-43

Yohei Iguchi et al. Brain. 2016 Dec.

Abstract

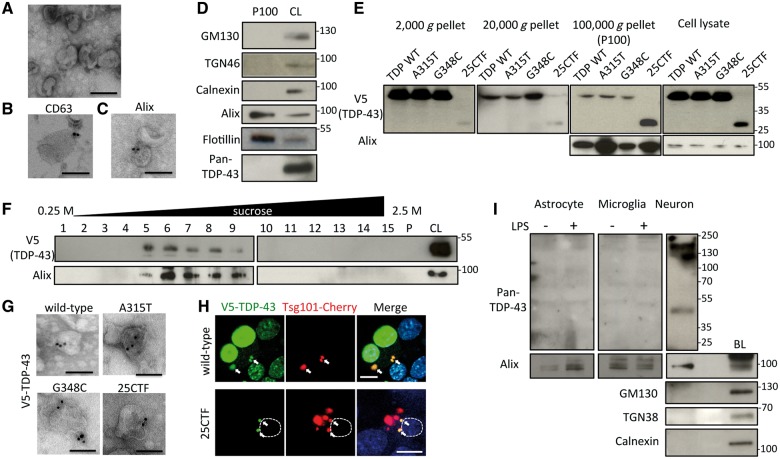
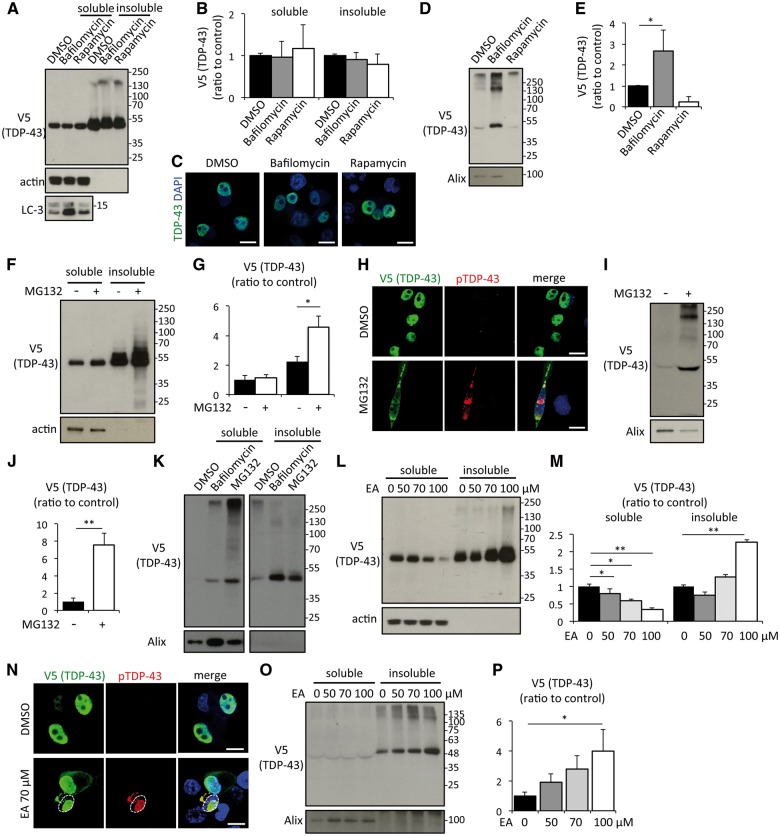
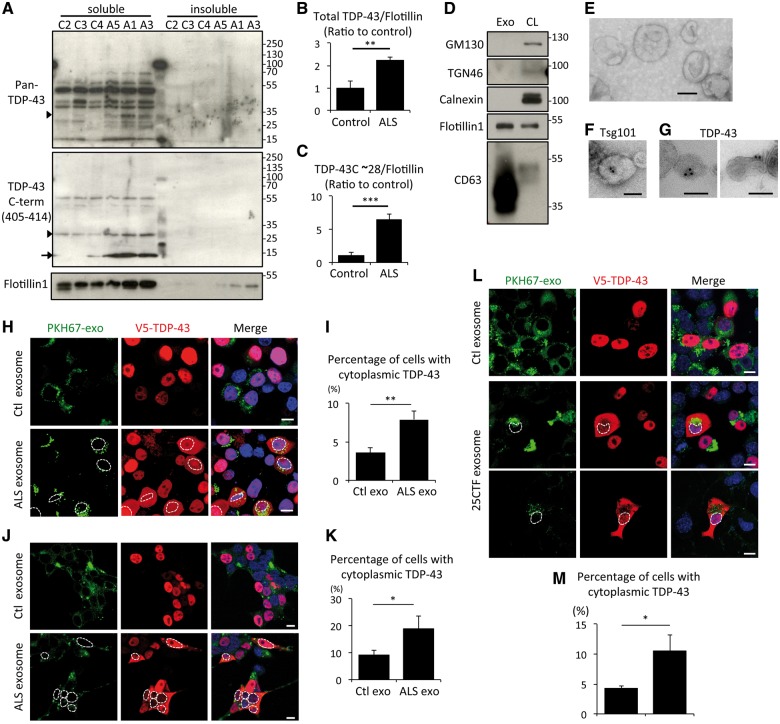
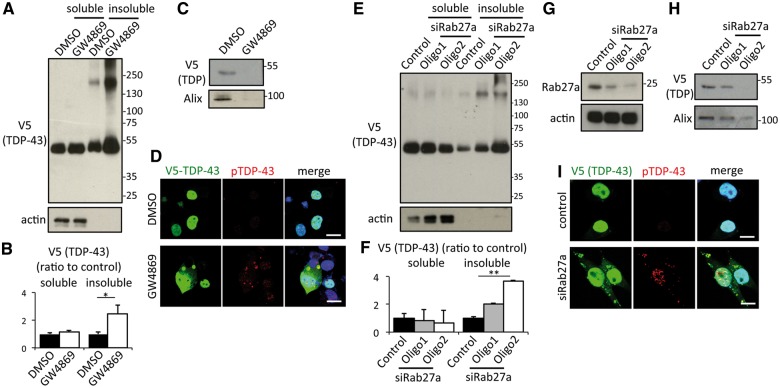
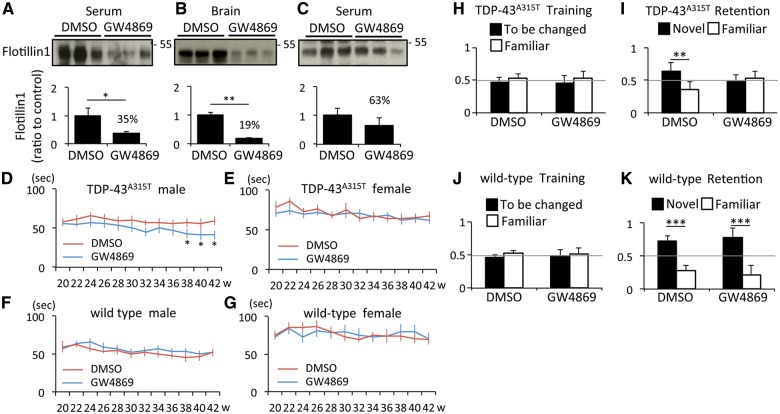
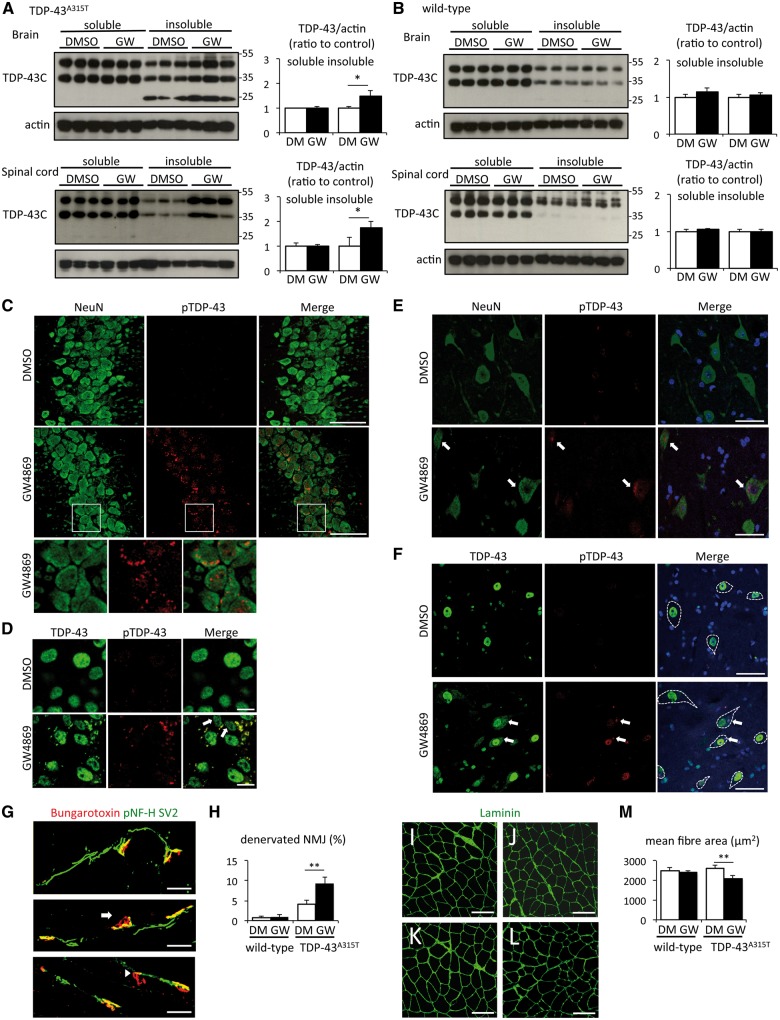
Cytoplasmic TDP-43 aggregation is a pathological hallmark of amyotrophic lateral sclerosis and frontotemporal lobar degeneration. Here we investigated the role of exosomes in the secretion and propagation of TDP-43 aggregates. TDP-43 was detected in secreted exosomes from Neuro2a cells and primary neurons but not from astrocytes or microglia. Evidence is presented that protein aggregation and autophagy inhibition are factors that promote exosomal secretion of TDP-43. We also report that levels of exosomal TDP-43 full length and C-terminal fragment species are upregulated in human amyotrophic lateral sclerosis brains. Exposure of Neuro2a cells to exosomes from amyotrophic lateral sclerosis brain, but not from control brain, caused cytoplasmic redistribution of TDP-43, suggesting that secreted exosomes might contribute to propagation of TDP-43 proteinopathy. Yet, inhibition of exosome secretion by inactivation of neutral sphingomyelinase 2 with GW4869 or by silencing RAB27A provoked formation of TDP-43 aggregates in Neuro2a cells. Moreover, administration of GW4869 exacerbated the disease phenotypes of transgenic mice expressing human TDP-43A315T mutant. Thus, even though results suggest that exosomes containing pathological TDP-43 may play a key role in the propagation of TDP-43 proteinopathy, a therapeutic strategy for amyotrophic lateral sclerosis based on inhibition of exosome production would seem inappropriate, as in vivo data suggest that exosome secretion plays an overall beneficial role in neuronal clearance of pathological TDP-43.

Keywords: TDP-43; amyotrophic lateral sclerosis; exosome; neutral sphingomyelinase 2 inhibition.


Figures

Figure 1
Figure 1
TDP-43 is secreted via exosomes in Neuro2a cells. (A) Electron microscopic image of secreted vesicles from Neuro2a cells. Scale bar = 100 nm. (B and C) Immunoelectron microscopic images with anti-CD63 (B) or Alix (C) antibodies. Scale bars = 100 nm. (D) Immunoblots of P100 and cell lysate (CL) of Neuro2a cells. (E) Immunoblots of pellets from different centrifugations of medium or cell lysates of Neuro2a cells transfected with wild-type (WT), A315T, G348C, or C-terminal fragment (25CTF) of hTDP-43. (F) Sucrose density gradient fractionation of P100 of Neuro2a cells transfected with V5-hTDP-43. Fifteen fractions of sucrose gradient, pellet (P), and cell lysate of Neuro2a cells. (G) Immunoelectron microscopic image of P100 of Neuro2a cells transfected with wild-type, A315T, G348C, or 25CTF hTDP-43 with V5 antibody. Scale bars = 100 nm. (H) Immunofluorescent images of Neuro2a cells transfected with V5-wild-type or -25CTF hTDP-43, Tsg101-Cherry (green; V5-TDP-43, red; Tsg101-Cherry, blue; DAPI). Dotted line indicates boundary of nucleus. Scale bars = 10 μm. Arrows indicate co-localization of V5-TDP-43 and Tsg101-Cherry. (I) Immunoblots of exosome fraction from primary astrocytes, primary microglial cells or primary neurons with brain lysate (BL) of C57BL6 mouse. Primary astrocytes or microglial cells were treated with DMSO or LPS (100 ng/ml) for 24 h.
Figure 2
Figure 2
Autophagy, proteasome and protein aggregation are modulators of TDP-43 exosomal secretion. (A) Immunoblots of RIPA-soluble or -insoluble fraction of Neuro2a cells treated with DMSO, 100 nM of bafilomycin A1 or 0.4 μM of rapamycin for 24 h. Neuro2a cells were transfected with V5-hTDP-43. (B) Densitometric quantification of V5 (n = 3 for each group). Error bars indicate standard deviation (SD). (C) Immunofluorescent images of Neuro2a cells treated with DMSO, bafilomycin A1, or rapamycin (green; V5-TDP-43, blue; DAPI). Scale bars = 10 μm. (D) Immunoblots of exosome fraction of Neuro2a cells. (E) Densitometric quantification of V5 (n = 3 for each group, *P < 0.05, ANOVA followed by Bonferroni post hoc tests). Error bars indicate SD. (F) Immunoblots of RIPA-soluble or -insoluble fraction of Neuro2a cells treated with DMSO or 1 μM MG132 for 24 h. Neuro2a cells were transfected with V5-hTDP-43. (G) Densitometric quantification of V5 (n = 3 for each group). Error bars indicate SD. (H) Immunofluorescent images of Neuro2a cells treated with DMSO or MG132 (green; V5-TDP-43, red; phosphoTDP-43 Ser409/410, blue; DAPI). Scale bars = 10 μm. (I) Immunoblots of exosome fraction of Neuro2a cells. (J) Densitometric quantification of V5 (n = 3 for each group, *P < 0.05, ANOVA followed by Bonferroni post hoc tests). Error bars indicate SD. RIPA-soluble or -insoluble exosome fraction of Neuro2a cells treated with DMSO or 100 nM bafilomycin A1. (K) Immunoblots of RIPA-soluble or -insoluble exosome fractions of Neuro2a cells treated with DMSO, bafilomycin, or MG132. (L) Immunoblots of RIPA-soluble or -insoluble fractions of Neuro2a cells treated with ethacrynic acid (EA) for 24 h. Neuro2a cells were transfected with V5-hTDP-43. (M) Densitometric quantification of V5 (n = 3 for each group, *P < 0.05, and **P < 0.01, ANOVA followed by Bonferroni post hoc tests). (N) Immunofluorescent images of Neuro2a cells treated with DMSO or 70 μM ethacrynic acid (green; V5-TDP-43, red; phosphoTDP-43 Ser409/410, blue; DAPI). Dotted line indicates boundary of nucleus. Scale bars = 10 μm. (O) Immunoblots of RIPA soluble or insoluble exosome fractions of Neuro2a cells treated with ethacrynic acid. (P) Densitometric quantification of V5 (n = 3 for each group, *P < 0.05, ANOVA followed by Bonferroni post hoc tests).
Figure 3
Figure 3
Exosomal TDP-43 is increased in ALS brain. (A) Immunoblots of exosomal fraction from control and ALS brains using anti-pan-TDP-43 or anti-TDP-43 C-term (405-414) antibody. Arrowhead and arrow indicate 28 kDa and 15 kDa of TDP-43 C-terminal fragment, respectively. (B and C) Densitometric quantification of total TDP-43 from pan-TDP-43 blot (B) or of TDP-43 C-terminal fragment (∼28 kDa) (C) normalized with flotillin-1 (n = 3 for each group, **P < 0.01, and ***P < 0.001, unpaired Student’s t-test). Error bars indicate SD. (D) Immunoblots of exosome fraction from Control patient 1 brain and cell lysate (CL) of HEK293 cells. (E–G) Electron microscopic images of exosome fraction of Patient ALS-3 brain. The vesicles were positive for Tsg101 (F) or TDP-43 (G). Scale bars = 100 nm. (H) Fluorescent images of Neuro2a cells treated with PKH67-labeled exosomes (green: PKH67, red; V5-TDP-43, blue; DAPI) from control or ALS brain. Neuro2a cells were transfected with V5-hTDP-43. Scale bars = 10 μm. (I) Percentage of cells with cytoplasmic TDP-43 redistribution in cells internalizing PKH67-labelled exosomes (n = 3 for each group, *P < 0.05, unpaired Student’s t-test). Neuro2a cells were treated with each 10 -μg exosomes purified from three different control (Control patients 2, 3 and 4) or ALS (Patients ALS-1, 3 and 5) brains for 24 h. More than 100 cells were evaluated for each. (J) Fluorescent images of HEK293 cells treated with PKH67-labelled exosomes (green: PKH67, red; V5-TDP-43, blue; DAPI) from control or ALS brains. Cells were transfected with V5-hTDP-43. Scale bars = 10 μm. Dotted lines indicate boundary of nucleus. (K) Percentage of cells with cytoplasmic TDP-43 redistribution in cells internalizing PKH67-labelled exosomes (n = 3 for each group, *P < 0.05, unpaired Student’s t-test). HEK293 cells were treated with each 10 μg exosomes purified from three different controls (Control 2, 3 and 4) or ALS (Patients ALS-1, 3 and 5) brains for 24 h. More than 100 cells were evaluated for each. (L) Fluorescent images of Neuro2a cells treated with PKH67-labelled exosomes (green: PKH67, red; V5-TDP-43, blue; DAPI) from control or ALS brain. Cells were transfected with V5-hTDP-43. Scale bars = 10 μm. Dotted lines indicate boundary of nucleus. (M) Percentage of cells with cytoplasmic TDP-43 redistribution in cells internalizing PKH67-labelled exosomes (n = 3 for each group, *P < 0.05, unpaired Student’s t-test). Neuro2a cells were treated with exosomes purified from Neuro2a cells transfected with mock or TDP-43 C-terminal fragment plasmid (25CTF) for 24 h. More than 100 cells were evaluated for each plate.
Figure 4
Figure 4
Inhibition of exosome secretion induces TDP-43 aggregation in Neuro2a cells. (A) Immunoblots of RIPA-soluble or -insoluble cell lysate of Neuro2a cells treated with DMSO or 10 μM GW4869 for 24 h. Neuro2a cells were transfected with V5-hTDP-43. (B) Densitometric quantification of V5 (n = 3 for each group, **P < 0.01, unpaired Student’s t-test). Error bars indicate SD. (C) Immunoblots of exosome fraction from Neuro2a cells treated with DMSO or 10 μM GW4869. (D) Immunofluorescent image of Neuro2a cells (green; V5-TDP-43, red; phosphoTDP-43 ser409/410, blue; DAPI). Scale bars = 10 μm. (E) Immunoblots of cell lysate of Neuro2a cells transfected with V5-TDP-43 and Rab27a siRNA. (F) Immunoblots of exosome fraction from Neuro2a cells transfected with V5-TDP-43 and Rab27a siRNA. (G) Immunoblots of RIPA-soluble or -insoluble fraction in Neuro2a cells transfected with V5-TDP-43 and Rab27a siRNA. (H) Densitometric quantification of V5 (n = 3 for each group, **P < 0.01, ANOVA followed by Bonferroni post hoc tests). Error bars indicate SD. (I) Immunofluorescent analysis of Neuro2a (green; V5-TDP-43, red; phosphoTDP-43 Ser409/410, blue; DAPI). Scale bars = 10 μm.
Figure 5
Figure 5
GW4869 treatment exacerbated TDP-43A315T mouse phenotype. (A and B) Immunoblots of serum and brain exosomes from six independent wild-type mice 4 h after the intraperitoneal injection of DMSO or GW4869, and densitometric quantification of flotillin 1 (n = 3 for each group, *P < 0.05, and **P < 0.01, unpaired Student’s t-test). Error bars indicate SD. (C) Immunoblots of serum exosomes from six independent wild-type mice 24 h after the injection of DMSO or GW4869, and densitometric quantification of Flotillin-1 (n = 3 for each group). Error bars indicate SD. (D–G) Latency to fall in rotarod task. (D) Male TDP-43A315T mice treated with DMSO (n = 12) or GW4869 (n = 13) (*P < 0.05, unpaired Student’s t-test). (E) Female TDP-43A315T mice treated with DMSO (n = 12) or GW4869 (n = 11). (F) Male wild-type mice treated with DMSO (n = 8) or GW4869 (n = 10). (G) Female wild-type mice treated with DMSO (n = 12) or GW4869 (n = 15). Error bars indicate SEM. (H–K) Novel object recognition test. (H and I) Data of second day (H) or third day (I) of TDP-43A315T mice treated with DMSO (n = 12) or GW4869 (n = 13) (**P < 0.01, unpaired Student’s t-test). (J and K) Data of second day (J) or third day (K) of wild-type mice treated with DMSO (n = 14) or GW4869 (n = 16) (***P < 0.001, unpaired Student’s t-test). Error bars indicate SD.
Figure 6
Figure 6
GW4869 treatment induced TDP-43 pathological modification and muscle denervation. (A) Immunoblots of RIPA-soluble or -insoluble brain/spinal cord fraction from six independent TDP-43A315T mice treated with DMSO or GW4869, and densitometric quantification (n = 3 for each group, *P < 0.05, unpaired Student’s t-test). Error bars indicate SD. (B) Immunoblots of RIPA-soluble or -insoluble brain/spinal cord fraction from six independent wild-type mice treated with DMSO or GW4869, and densitometric quantification (n = 3 for each group). Error bars indicate SD. (C and D) Immunofluorescent images of CA3 hippocampal region of TDP-43A315T mouse treated with DMSO or GW4869 using NeurN (green) and phosphoTDP-43 ser409/410 (red) antibodies (C) or TDP-43 (green) and phosphoTDP-43 ser409/410 (red) antibodies (D). Scale bars = 50 μm (C) or 10 μm (D). (E and F) Immunofluorescent images of spinal cord of TDP-43A315T mouse treated with DMSO or GW4869 using NeurN (green), phosphoTDP-43 ser409/410 (red) antibodies, and DAPI (blue) (E), or TDP-43 (green), phosphoTDP-43 ser409/410 (red) antibodies, and DAPI (blue) (F). Arrows indicate TDP-43 cytoplasmic aggregates, and dotted lines indicate boundaries of motor neuron. Scale bars = 50 μm. (G) Representative immunofluorescent images of neuromuscular junction (NMJ) (pNF-H and SV2; green, bungarotoxin; red). Arrow indicates partially denervated neuromuscular junction and arrowhead indicates totally denervated neuromuscular junction. (H) Percentage of partially or totally denervated neuromuscular junction of wild-type or TDP-43A315T mice treated with DMSO or GW4869 (n = 3 for wild-type mouse group, and n = 6 for TDP-43A315T mouse group **P < 0.01, unpaired Student’s t-test). Error bars indicate SD. (I–L) Immunofluorescent images of gastrocnemius muscle of wild-type mouse treated with DMSO (I) or GW4869 (J), and TDP-43A315T mouse treated with DMSO (K) or GW4869 (L) (green; laminin). (M) Analysis of mean fibre size of wild-type or TDP-43A315T mice treated with DMSO or GW4869 (n = 3 for wild-type mouse group, and n = 6 for TDP-43A315T mouse group, **P < 0.01, unpaired Student’s t-test). More than 100 muscle fibres were measured for each mouse. Error bars indicate SD.

References

    1. Arai T, Hasegawa M, Akiyama H, Ikeda K, Nonaka T, Mori H, et al. TDP-43 is a component of ubiquitin-positive tau-negative inclusions in frontotemporal lobar degeneration and amyotrophic lateral sclerosis. Biochem Biophys Res Commun 2006; 351: 602–11. - PubMed
    1. Asai H, Ikezu S, Tsunoda S, Medalla M, Luebke J, Haydar T, et al. Depletion of microglia and inhibition of exosome synthesis halt tau propagation. Nat Neurosci 2015; 18: 1584–93. - PMC - PubMed
    1. Bliederhaeuser C, Grozdanov V, Speidel A, Zondler L, Ruf WP, Bayer H, et al. Age-dependent defects of alpha-synuclein oligomer uptake in microglia and monocytes. Acta Neuropathol 2016; 131: 379–91. - PubMed
    1. Blokhuis AM, Groen EJ, Koppers M, van den Berg LH, Pasterkamp RJ. Protein aggregation in amyotrophic lateral sclerosis. Acta Neuropathol 2013; 125: 777–94. - PMC - PubMed
    1. Bobrie A, Colombo M, Raposo G, Thery C. Exosome secretion: molecular mechanisms and roles in immune responses. Traffic 2011; 12: 1659–68. - PubMed

Grants and funding